Cell culture
J1 mouse ESCs (129S4/SvJae, XY) were cultured on gelatin-coated dishes in serum/LIF medium containing DMEM/GlutaMAX supplemented with 15% fetal bovine serum (FBS), non-essential amino acids (NEAA), penicillin/streptomycin, and 1000 U/ml leukemia inhibitory factor (LIF). When necessary, ESCs were adapted to 2i/Vitamin C/LIF medium containing serum-free DMEM-F12 and Neurobasal media supplemented with 1% N2, 2% B27, 100 μg/ml ascorbic acid, 1 μM PD0325901, and 3 μM CHIR99021. Cells were incubated in a humidified atmosphere at 37°C under 5% CO2. For spontaneous differentiation assays, cells were seeded at clonal density in a serum medium without LIF.
Cloning of sgRNA, transfection, and transduction in ESCs
The single-guide RNAs (sgRNAs) were designed using either Benchling/CRISPOR software or sequences were obtained from the Brie library. The sgRNAs were cloned either in the PX459 vector (Addgene #62988) or in lentiCRISPRv2 (Addgene #52961). For ESC transfection, we used an Amaxa 4D-Nucleofector (Lonza), according to the manufacturer’s instructions. Production of lentiviral particles was performed by calcium-phosphate transfection of HEK293T with psPAX2 and pMD2.G plasmids, in a BSL3 tissue culture facility.
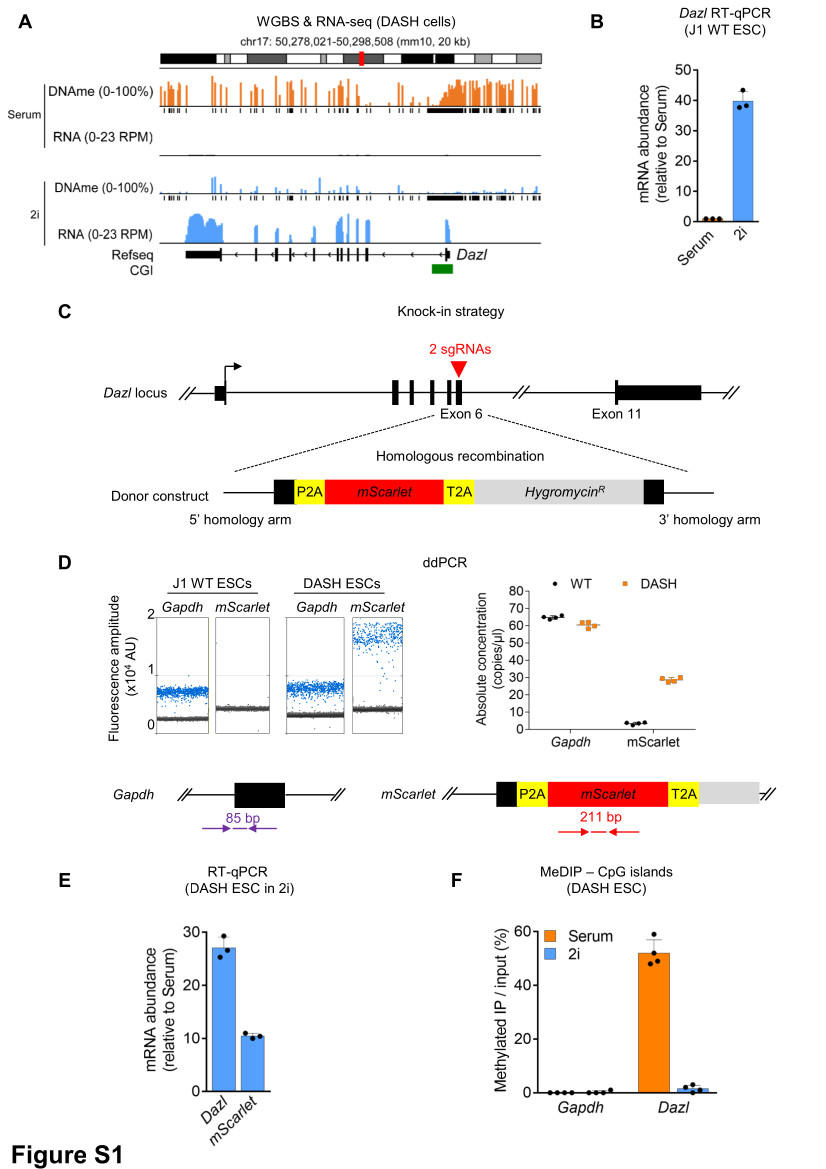
Generation of DASH (Dazl-mScarlet-HygromycinR) reporter cell line
The reporter cassette P2A-mScarlet-T2A-HygroR (synthesized by GenScript) was inserted in-frame within the exon 6 of mouse Dazl gene. The cassette was flanked by Dazl homology arms (HA) corresponding to endogenous intron 5-exon 6 and intron 6 sequences respectively. Protospacer Adjacent Motif (PAM) sites of the two sgRNAs targeting Dazl exon 6 were mutated in the homology arms to prevent re-cutting of Cas9 after the insertion of the cassette through homologous recombination. The synthesized cassette was cloned into pUC57-Simple. The two sgRNAs targeting Dazl exon 6 were cloned into the pSpCas9(BB)-2A-GFP backbone (Addgene #48138). The homologous integration of the reporter cassette in one of the alleles of Dazl was confirmed by PCR and sequencing.
CRISPR KO screen: amplification of sgRNA library, lentiviral transduction, and sample collection
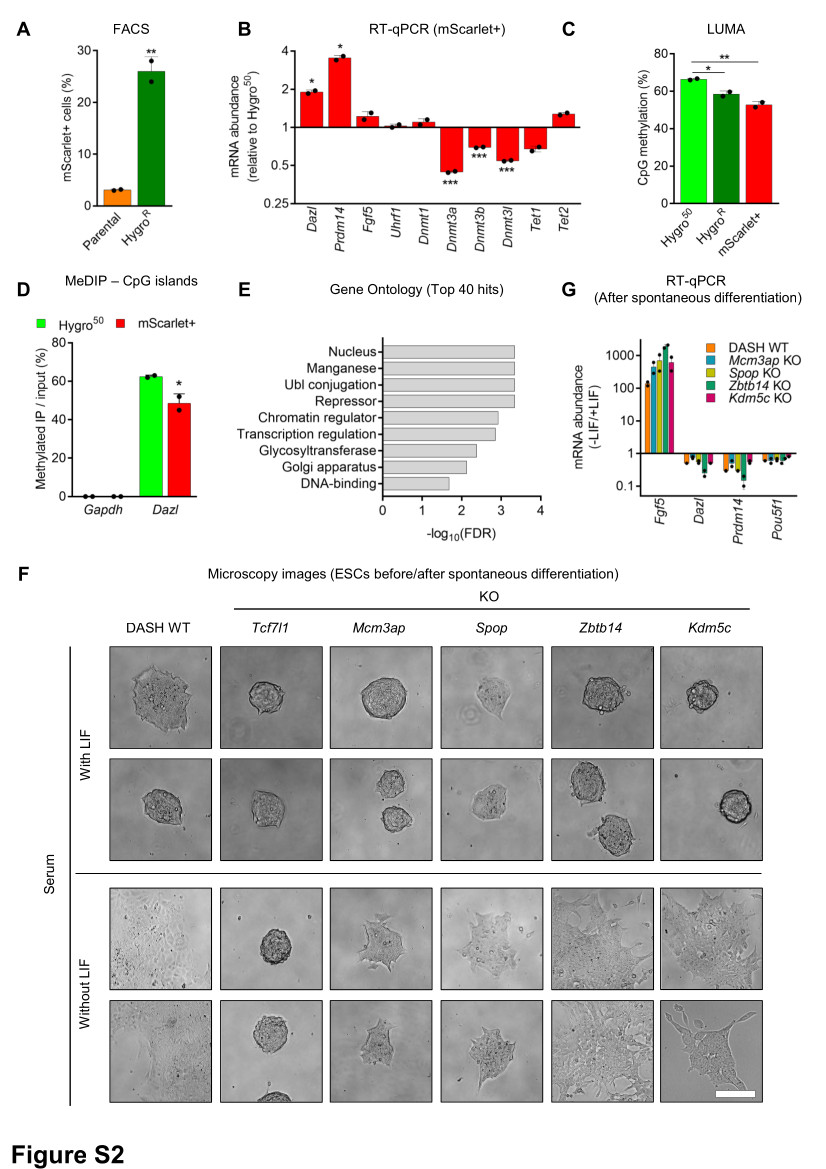
We performed a genome-wide CRISPR knock-out (KO) screen using the lentiviral Brie sgRNA library containing 4 sgRNAs per protein-coding gene (Addgene #73632)27. The sgRNA library was amplified and sequenced confirming an equal representation of the ~80,000 sgRNAs, as expected and lentiviruses were produced. The screen was performed in two biological replicates, cells were transduced with a lentiviral plasmid pool at a multiplicity of infection (MOI) ~0.1. After 48 h, transduced cells were positively selected with 2 µg/ml puromycin for 5 days. Coverage was 150X (150 transduced cells/sgRNA) for each biological replicate. Sequencing of the PuroR sample confirmed a comprehensive representation of the sgRNA library in the screen. Following this, cells were initially selected with 50 µg/ml Hygromycin for 3 days followed by additional selection for 11 days at 125 µg/ml Hygromycin. Three weeks post-infection, Hygromycin-resistant cells were sorted by FACS for mScarlet expression.
CRISPR KO screen: sequencing and analysis
Genomic DNA was isolated from cells using AllPrep DNA/RNA Mini Kit (Qiagen) following the recommended protocol. For the sgRNA plasmid library, 50 ng DNA was used for each reaction whereas 300 ng of genomic DNA was used per reaction. Multiple reactions were set-up for each sample to reflect the coverage and PCR reactions were pooled. Briefly, PCR was performed with Platinum Taq polymerase (Thermo Fisher Scientific), employing a pool of P5 primers (designed in the lab) and a unique P7 barcode primer (primer sequences are listed in Supplementary File 1). The PCR conditions were: initial denaturation at 94°C for 4 min; 28 cycles of denaturation at 94°C for 30 s, annealing at 53°C for 30 s and extension at 72°C for 30 s per kb; final extension at 72°C for 10 min. The PCR products were retrieved using QIAquick PCR Purification Kit (Qiagen) and verified for the right amplicon on an agarose gel. The DNA was further purified using AMPure XP (Beckman Coulter). Libraries were sequenced on an Illumina HiSeq 1500 in single-end (SE) 100 bp output mode. The sgRNA distribution and enrichment at different time points were analyzed with the MAGeCK workflow28. A statistical threshold of p-value < 0.0005 resulted in a list of 40 candidates whose knockout led to the expression of mScarlet and HygroR in DASH ESCs. The list of enriched genes is available in Supplementary File 2.
CRISPR KO screen: protein-protein interaction network analysis
Protein-protein interactions for the 40 significant hits from the genome-wide CRISPR KO screen were performed using the STRING v11.0 tool. Interactions were computed using default parameters and network edges with a confidence score > 0.6 were displayed. Network visualization was edited with Cytoscape software.
Generation of individual gene KO and clonal cell lines
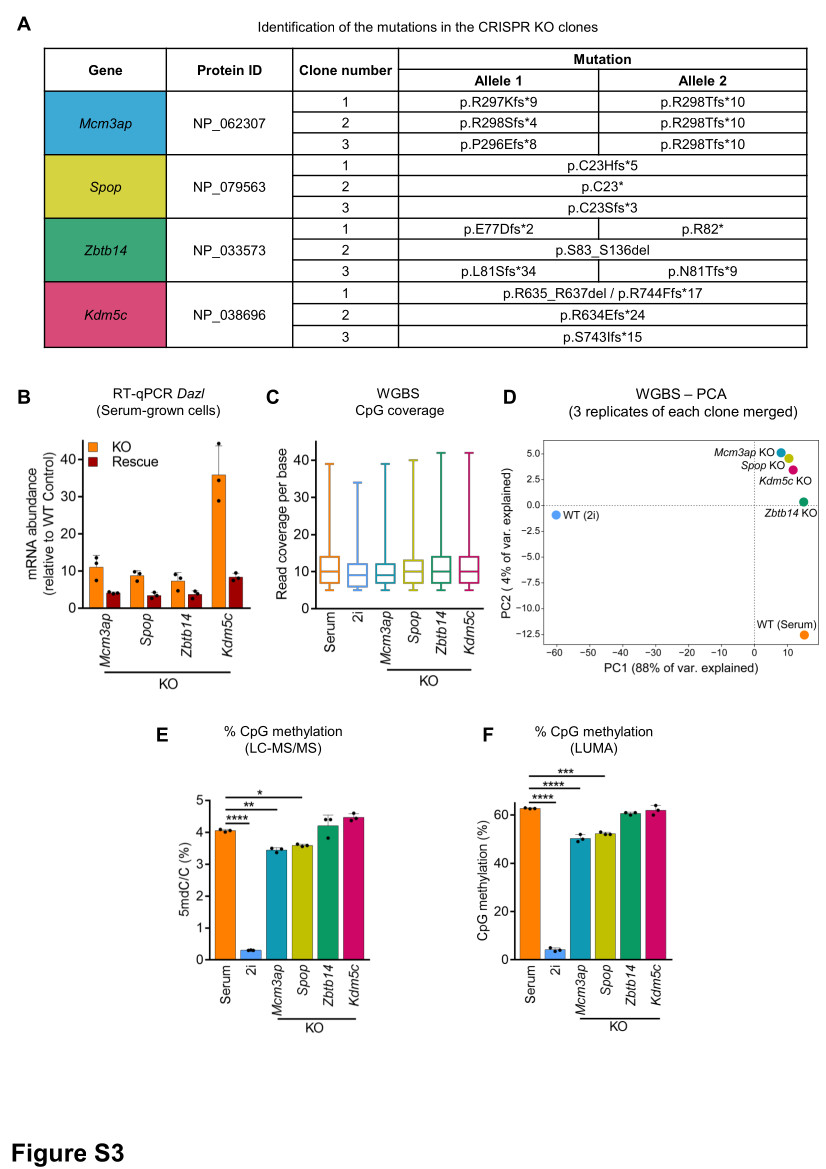
To validate candidates from the screen, individual KOs in DASH ESCs were generated using the top two most efficient sgRNAs (as determined by MAGeCK analysis). During lentiviral production, both sgRNA plasmids targeting the same gene were mixed to increase knockout efficiency. Transduced cells were selected with 2 µg/ml puromycin for 3 days; followed by Hygromycin selection (50 µg/ml for 3 days, and 125 µg/ml for the next 7 days). For Kdm5c, Mcm3ap, Spop, and Zbtb14, three independent clonal KO lines were established.
Rescue experiments, piggyBac system
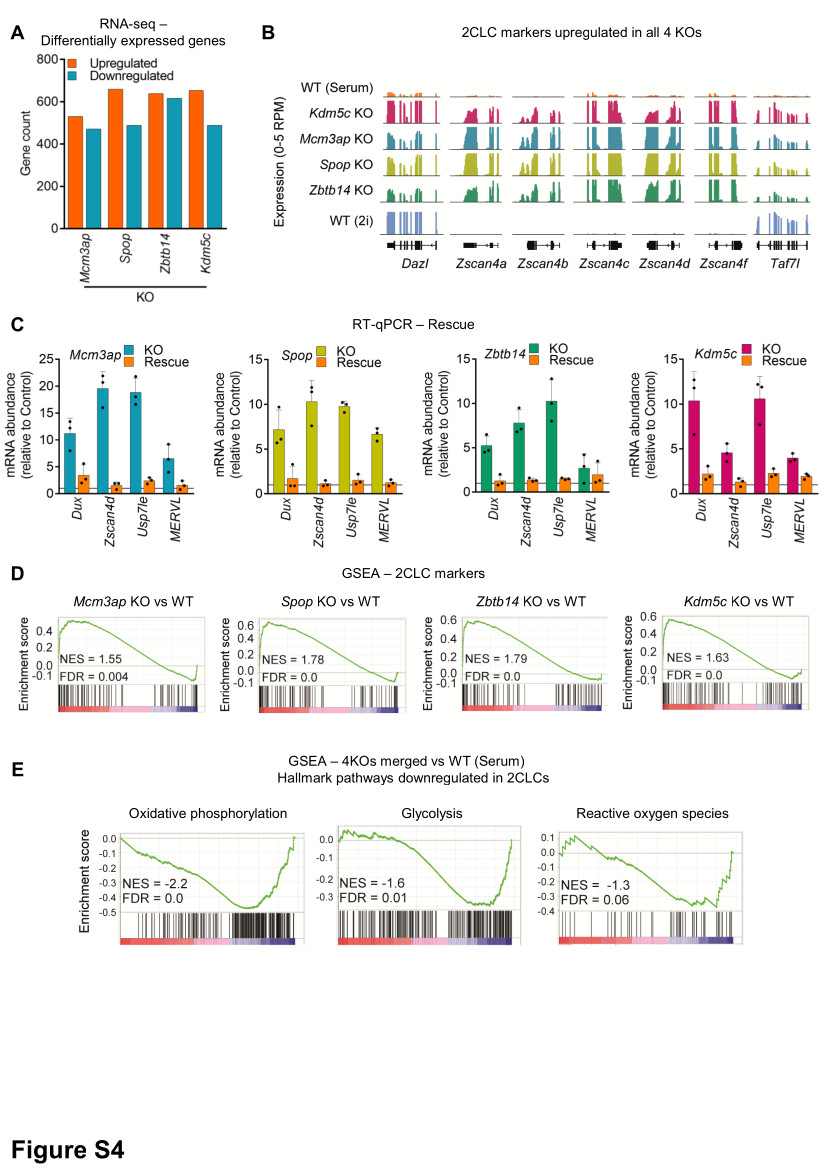
For rescue experiments, the coding sequence (CDS) of candidates was either synthesized (Spop and Zbtb14) (GenScript), amplified from cDNA (Kdm5c), or obtained from colleagues (Mcm3ap, kindly shared by Prof. N. Sakaguchi32). In all cases, silent mutations were incorporated either within the PAM and/or sgRNA sequence to block targeting by the active cognate sgRNAs in the KO clonal cell lines. For Kdm5c, an additional catalytically inactive mutant plasmid with the H514A mutation was generated. These CDS sequences were cloned into a piggyBac vector and co-transfected with PB transposase for stable insertion36. Empty piggyBac vector served as a control. Transfected cells were selected with 5 µg/ml blasticidin for 5 days and processed for phenotypic and molecular assays.
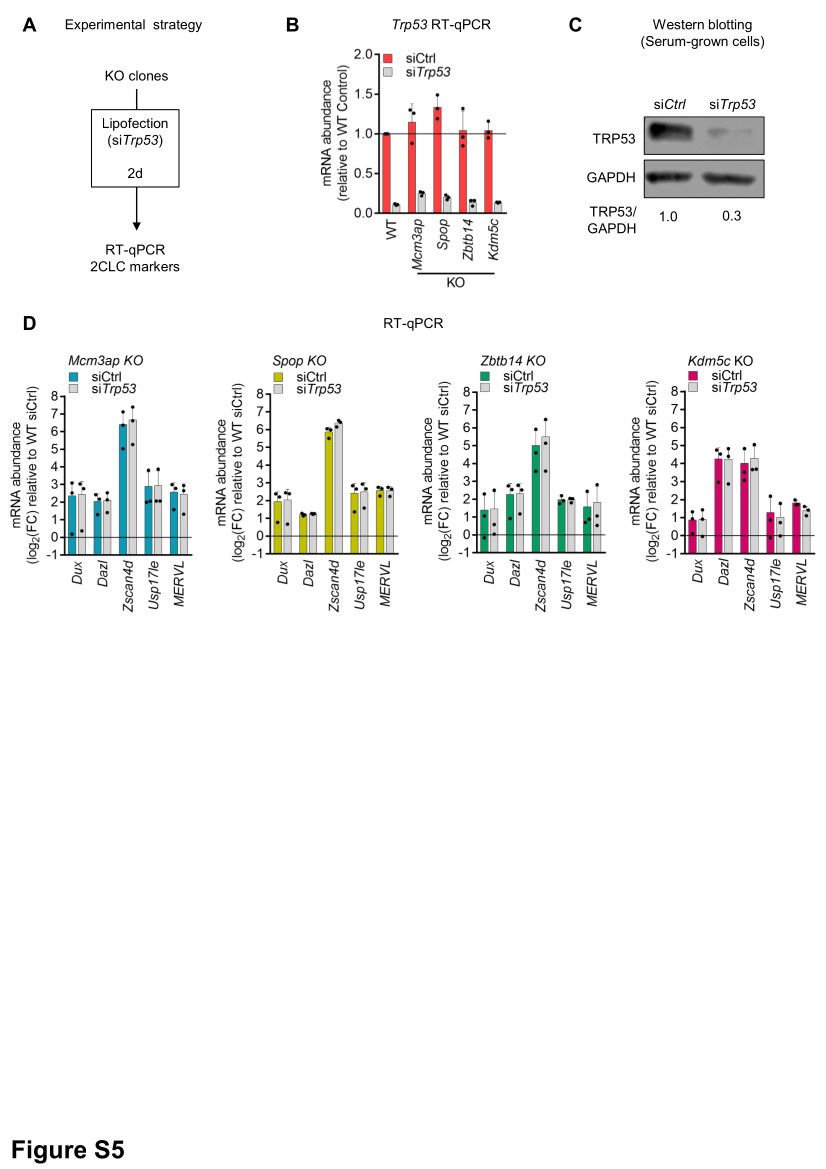
Knock-down experiments, siRNA/shRNA transfection
For stable knock-down experiments, the pLKO.1-blasticidin shRNA vector for Dux was kindly shared by Prof. Didier Trono3, and the pLKO.1-neomycin shRNA vector for Dppa2 was ordered from Sigma (TRCN0000174599). In both instances, empty backbones were used as controls. Transduced cells were respectively selected with 5 µg/ml blasticidin for 5 days or 400 µg/ml geneticin for 7 days, then processed for phenotypic and molecular assays. For transient knock-down experiments, the siRNA vector for Tp53 was kindly shared by G. Velasco26. A non-targeting siRNA pool (siGenome siControl Pool #2, Dharmacon) was used as a control. Cells were transfected with 50 nM siRNA and 3 µl/ml Lipofectamine RNAiMAX (Thermo Fisher Scientific) diluted in Opti-MEM. Total RNA was extracted 2 days after transfection for RT-qPCR. Primer sequences are listed in Supplementary File 1.
Flow cytometry
The number of cells expressing mScarlet was determined by flow cytometry using a yellow laser (561 nm) of the Influx or FACSAria Fusion cell sorter (BD Biosciences) at the ImagoSeine core facility (Institut Jacques Monod). A threshold on mScarlet signal intensity (subtracting background fluorescence from non-reporter wild-type mESC) was used to determine the proportion of positive cells. Data were analyzed with FlowJo software.
Crystal violet staining
Cells were seeded at the same density in all wells and grown with or without Hygromycin for 7 days. Surviving cells were fixed with absolute ethanol for 15 min, stained with 1% Crystal violet dye (Sigma) for 30 min, and washed extensively with water to remove the unbound stain.
Digital droplet PCR (ddPCR)
The PCR reaction mixture composed of 2X EvaGreen ddPCR Supermix (Bio-Rad), primers at a final concentration of 100 nM and 10 ng of template DNA were partitioned into up to 20,000 droplets by water-oil emulsion. After droplet generation, a regular PCR was performed with the following conditions: 95°C for 5 min; 95°C for 30 s and 60°C for 1 min (40 cycles); 4°C for 5 min, 90°C for 5 min, 4°C hold. For all steps, a ramp rate of 2°C/s was used. Cycled droplets were read individually (Bio-Rad QX-200 droplet reader). Each run included technical duplicates and no-template controls. Primer sequences are listed in Supplementary File 1.
RT-qPCR
Total RNA was extracted from cells with RNeasy Plus Mini kit (Qiagen) according to the manufacturer’s instructions and quantified using Qubit RNA BR Assay kit on Qubit 2.0 Fluorometer (Thermo Fisher Scientific). One microgram of total RNA was reverse transcribed using SuperScript IV Reverse Transcriptase (Thermo Fisher Scientific) and Oligo dT primers (Promega). RT-qPCR was performed using Power SYBR Green (Applied Biosystems) on a ViiA 7 Real-Time PCR System (Thermo Fisher Scientific). Actinb, Ppia, and Rplp0 were used for normalization. Primer sequences are available in Supplementary File 1.
Western blotting
Cells were harvested and lysed in RIPA buffer (Sigma) with protease inhibitor cocktail (Thermo Fisher Scientific), sonicated with a series of 30s ON / 30s OFF for 5 min on a Bioruptor (Diagenode), and centrifuged at 16,000 g for 5 min at 4°C. The supernatant was collected and quantified by BCA assay (Thermo Fisher Scientific). Thirty microgram protein extract per sample was mixed with NuPage 4X LDS Sample Buffer and 10X Sample Reducing Agent (Thermo Fisher Scientific) and denatured at 95°C for 5 min. Samples were resolved on a pre-cast SDS-PAGE 4-12% gradient gel (Thermo Fisher Scientific) with 120V electrophoresis for 90 min and blotted onto a nitrocellulose membrane (Millipore). The membrane was blocked with 5% fat-free milk/PBS at RT for 1 h, then incubated overnight at 4°C with appropriate primary antibodies. After three washes with PBS/0.1% Tween20, the membranes were incubated with the cognate fluorescent secondary antibodies and revealed in the LI-COR Odyssey-Fc imaging system. The following antibodies were used in this study: α-DAZL (Abcam #ab34139, 1:500), α-V5 (Abcam #ab206566, 1:1000), α-MuERVL-Gag (HuaBio #ER50102, 1:1000), α-ZSCAN4 (Merck #AB4340, 1:5000), α-p53 (CST #2524; 1:1000), α-TUBULIN (Abcam #7291; 1:10000), α-GAPDH (Abcam #ab9485, 1:10000). The following secondary antibodies were used in this study: IRDye 800CW Donkey α-Rabbit (Licor #926-32213, 1:15000) and IRDye 680RD Donkey α-Mouse (Licor #926-68072, 1:15000).
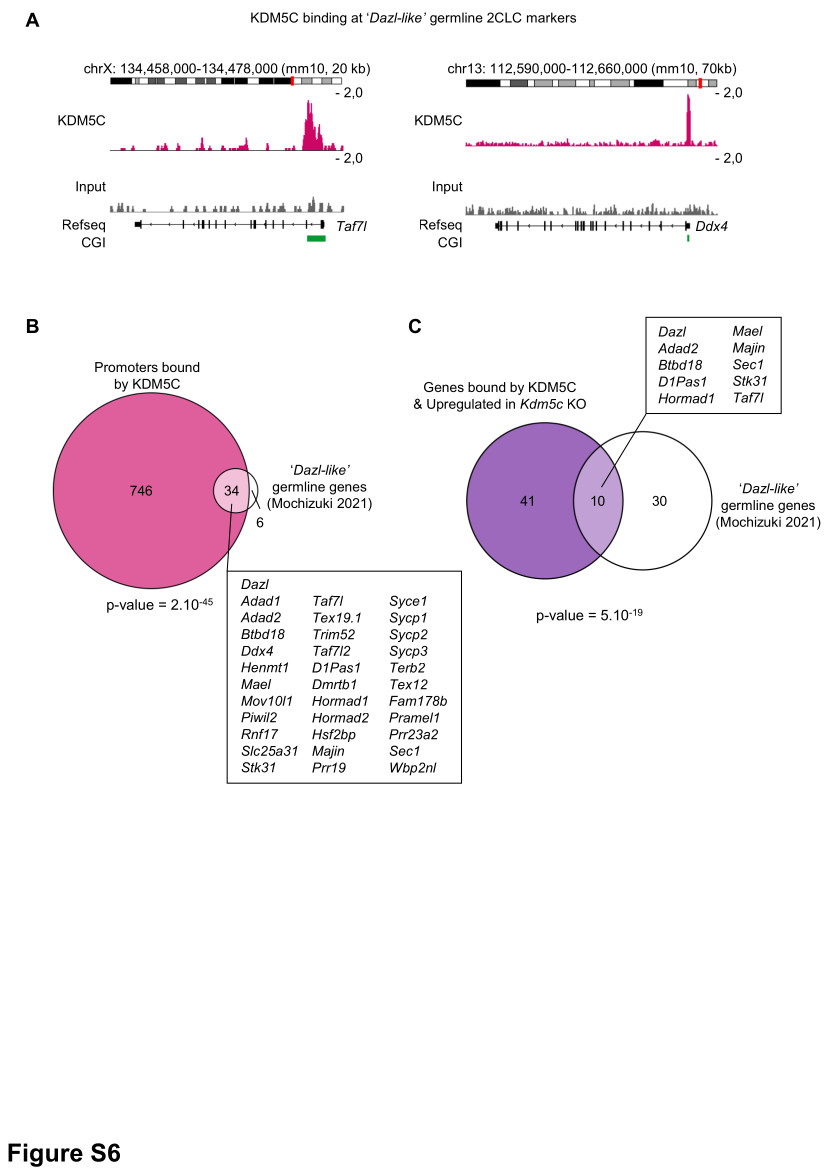
Chromatin Immunoprecipitation (ChIP)
1x10⁷ cells were cross-linked with 1% formaldehyde for 5 min at room temperature. Cross-linking was stopped by adding Glycine (125 mM final), and the cells were washed with PBS. Cells were resuspended in Swelling Buffer (0.5% NP-40, 0.85 mM KCl, 1 mM PMSF, 5 mM PIPES pH 8.0) supplemented with protease inhibitor cocktail (Roche) and incubated for 20 min on ice. After centrifugation, cell nuclei were resuspended in IP Buffer (0.1% SDS, 1% Triton X-100, 3 mM EDTA, 1 mM PMSF, 150 mM NaCl, 25 mM Tris-HCl pH 8.0, 1X protease inhibitor cocktail) and sonicated for 5 min (series of 30s ON / 30s OFF) on a Bioruptor Pico (Diagenode) to generate 200 to 500 bp fragments. Fragmented chromatin (50 µg) was immunoprecipitated in IP buffer with 1 µg of antibody (a-KDM5C, Bethyl Laboratories #A301-034A) overnight at 4°C. Subsequent steps (including incubation with magnetic beads, multiple washes, elution) were performed with the Pierce Magnetic ChIP Kit (Thermo Fisher Scientific), following the manufacturer’s instructions. Reverse cross-linked DNA was purified by ChIP DNA Clean&Concentrator kit (Zymo Research). Libraries were prepared with KAPA HyperPrep kit (Roche), following the manufacturer’s instructions.
ChIP-seq analysis
FASTQ reads were trimmed using Trimmomatic (v0.39) and parameters: ILLUMINACLIP:illumina_adapters.fa:2:30:10 SLIDINGWINDOW:4:20 MINLEN:36. Trimmed reads were aligned using Bowtie2 (v2.4.1) in --local mode. Following alignment, Picard (v2.23.4) CleanSam, SamFormatConverter, SortSam and Markduplicates were used to generate a duplicate-marked bam file. The resulting bam files were converted to bigwig using deeptools (v3.3.0) Bamcoverage and options --ignoreDuplicates –normalizeUsing CPM –minMappingQuality 10 –ignoreForNormalization chrX chrY chrM. Peaks were called using MACS2 with default parameters, and motif enrichment analysis was performed with HOMER. For datasets already published, SRA files were downloaded from NCBI GEO using E-utilities esearch and efetch (v15.9) and converted to FASTQ using SRAtoolkit (v2.8.0). The datasets generated in this study are listed in Supplementary File 3.
Isolation of genomic DNA
Genomic DNA was isolated from cells using overnight 200 μg/ml proteinase K treatment at 55°C followed by 20 μg/ml RNase A treatment at 37°C for 1 h and extracted by standard phenol/chloroform/alcohol method. Alternatively, genomic DNA was isolated from cells using QIAamp DNA Mini kit (Qiagen), following the manufacturer’s instructions. Genomic DNA was resuspended in water and quantified with Qubit dsDNA BR Assay kit on Qubit 2.0 Fluorometer (Thermo Fisher Scientific). DNA integrity was assessed with Genomic DNA ScreenTape on TapeStation system (Agilent) and samples with DNA Integrity Number > 9 were used for subsequent analysis.
DNA methylation analysis: Methylated DNA Immunoprecipitation (MeDIP)
MeDIP was performed using the Auto MeDIP Kit on an automated platform SX-8G IP–Star Compact (Diagenode). Briefly, 2.5 μg of DNA was sheared using a Bioruptor Pico to approximately 500-bp fragments, as assessed with D5000 ScreenTape (Agilent). Cycle conditions were as follows: 15 s ON / 90 s OFF, repeated 6 times. A portion of sheared DNA (10%) was kept as input and the rest of the sheared DNA was immunoprecipitated with α-5-methylcytosine antibody (Diagenode), bound to magnetic beads, and was isolated. qPCR for selected genomic loci was performed and efficiency was calculated as % (me-DNA-IP/total input). Primer sequences are listed in Supplementary File 1.
DNA methylation analysis: Luminometric methylation assay (LUMA)
To assess global CpG methylation, 500 ng of genomic DNA was digested with MspI+EcoRI and HpaII+EcoRI (NEB) in parallel reactions, EcoRI was included as an internal reference. CpG methylation percentage is defined as the HpaII/MspI ratio. Samples were analyzed using PyroMark Q24 Advanced pyrosequencer
DNA methylation analysis: LC-MS/MS
The genomic DNA was extracted as described above with an additional step of digestion with RNase A. One microgram of DNA was treated with 10U DNA Degradase Plus (ZymoResearch) at 37°C for 4 h. After enzyme inactivation at 70°C for 20 min, the solution was filtered with Amicon Ultra-0.5 mL 10 K centrifugal filters (Merck Millipore). The reaction mix retained in the centrifugal filter was processed for LC-MS/MS analysis. Analysis of global levels of 5-mdC were performed on a Q exactive mass spectrometer (Thermo Fisher Scientific). It was equipped with an electrospray ionization source (H-ESI II Probe) coupled with an Ultimate 3000 RS HPLC (Thermo Fisher Scientific). Digested DNA was injected onto a ThermoFisher Hypersil Gold aQ chromatography column (100 mm * 2.1 mm, 1.9 µm particle size) heated at 30°C. The flow rate was set at 0.3 ml/min and run with an isocratic eluent of 1% acetonitrile in water with 0.1% formic acid for 10 minutes. Parent ions were fragmented in positive ion mode with 10% normalized collision energy in parallel-reaction monitoring (PRM) mode. MS2 resolution was 17,500 with an AGC target of 2e5, a maximum injection time of 50 ms, and an isolation window of 1.0 m/z. The inclusion list contained the following masses: dC (228.1) and 5-mdC (242.1). Extracted ion chromatograms of base fragments (±5ppm) were used for detection and quantification (112.0506 Da for dC; 126.0662 Da for 5-mdC). Calibration curves were previously generated using synthetic standards in the ranges of 0.2 to 10 pmol injected for dC and 0.02 to 10 pmol for 5mdC. Results are expressed as a percentage of total dC.
Whole-genome-bisulfite sequencing (WGBS)
Genomic DNA was extracted as described for LC-MS/MS. The library preparation for WGBS was performed with the tPBAT protocol described previously59,60. One hundred nanograms of genomic DNA spiked with 1% (w/w) of unmethylated lambda DNA (Promega) was used for the library preparation. The sequencing was performed by Macrogen Japan Inc. using the HiSeq X Ten system. We assigned 8 lanes for the analysis of 20 samples. The sequenced reads were mapped with BMap and summarized with an in-house pipeline as described previously60, with custom scripts archived using GitHub (https://github.com/FumihitoMiura/Project-2). The basic metrics of the methylome data are provided in Supplementary File 4. DNA methylation levels over CpGs covered by at least 5 sequencing reads were averaged over the following regions of interest: genome-wide 2kb bins, enhancer elements (Ensembl Regulatory features release 81, n=73,796), promoters (NCBI Refseq, TSS +/- 1kb, n=24,371), gene bodies and transposable elements (RepeatMaster, n=5,147,736). PCA plot was generated using Deeptools multiBamSummary with default parameters.
RNA-seq: library preparation for transcriptome sequencing
A total amount of 1 μg total RNA per sample was used as input material for the RNA sample preparations. RNA samples were spiked with ERCC RNA Spike-In Mix (Thermo Fisher Scientific). Sequencing libraries were generated using NEBNext UltraTM RNA Library Prep Kit for Illumina (NEB) following the manufacturer’s recommendations. Briefly, mRNA was purified from total RNA using poly-T oligo-attached magnetic beads. Fragmentation was carried out using divalent cations under elevated temperature in NEBNext First Strand Synthesis Reaction Buffer (5X). First-strand cDNA was synthesized using a random hexamer primer and M-MuLV Reverse Transcriptase (RNase H-). Second strand cDNA synthesis was subsequently performed using DNA Polymerase I and RNase H. In the reaction buffer, dNTPs with dTTP were replaced by dUTP. The remaining overhangs were converted into blunt ends via exonuclease/polymerase activities. After adenylation of 3’ ends of DNA fragments, NEBNext Adaptor with hairpin loop structure was ligated to prepare for hybridization. To select cDNA fragments of preferentially 250-300 bp in length, the library fragments were purified with the AMPure XP system (Beckman Coulter). Then 3 μl USER Enzyme (NEB) was used with size-selected, adaptor-ligated cDNA at 37°C for 15 min followed by 5 min at 95°C before PCR. Then PCR was performed with Phusion High-Fidelity DNA polymerase, Universal PCR primers, and Index (X) Primer. At last, products were purified (AMPure XP system) and library quality was assessed on the Agilent Bioanalyzer 2100 system.
RNA-seq: read alignment
FASTQ reads were trimmed using Trimmomatic (v0.39) and parameters: ILLUMINACLIP:adapters.fa:2:30:10 SLIDINGWINDOW:4:20 MINLEN:36. Read pairs that survived trimming were aligned to the mouse reference genome (build mm10) using STAR (v2.7.5c) and default single-pass parameters. PCR duplicate read alignments were flagged using Picard-tools (2019) MarkDuplicates (v2.23.4). Uniquely aligned, non-PCR-duplicate reads were kept for downstream analysis using Samtools view (v1.10) and parameters: -q 255 -F 1540. Gene expression values were calculated over the mm10 NCBI RefSeq Genes annotation using VisRseq (v0.9.12) and normalized per million aligned reads per transcript length in kilobases (RPKM). Bigwig files were generated using deeptools bamCoverage (v3.3.0) using counts per million (CPM) normalization and visualized in IGV (v2.8.9).
RNA-seq: differential expression and gene-set enrichment analysis
DESeq2 (v1.30.0) was employed using apeglm LFC shrinkage to calculate differential expression. Genes or transposable elements were categorized as significantly differentially expressed if they showed an absolute expression fold-change >=2 and associated adjusted p-value <0.01. Differentially expressed genes are listed in Supplementary File 5. Gene set enrichment analysis was performed using GSEA (v4.1.0) and default parameters (1000 permutations, permutation type = gene_set. Selected significant terms from Hallmark gene sets (n=50 “h.all.v7.4.symbols.gmt”) were displayed. Complete GSEA analysis is available in Supplementary File 6.
RNA-seq: transposable element quantification
RepeatMasker (last updated 2012-02-06) was downloaded from the UCSC Table Browser. To measure the expression of transposable element families, PCR duplicates were removed and all reads, including uniquely mapped and multi-mapped reads, were enumerated using VisRseq. Multi-mapped reads were counted once, and all individual elements were aggregated to calculate family-wide expression in read count for differential expression analysis. Heatmaps were generated using Morpheus (https://software.broadinstitute.org/morpheus).
RNA-sequencing analysis: MERVL/MT2_Mm analysis
MERVL internal sequences and their MT2_Mm LTR promoters were extracted from the RepeatMasker annotation (last updated 2012-02-06). Internal sequences and their LTRs located within 88 bp were merged into a single element using bedtools merge (v2.27.0) to account for an 87 bp insertion of a related ORR1A3 element. Elements were categorized as full-length MERVL elements if they contained both LTR elements and internal sequences and spanned >6000bp. MT2_Mm elements under 500 bp in length were defined as “Solo-LTRs”. All other elements, such as those composed of MERVL internal sequences and only one LTR, were categorized as “other”. Genome-wide mappability scores were calculated using iGEM (v1.315) and parameters: K_MER_SIZE=300 MAX_MISMATCHES=0.04 and the mappability of each MERVL element was calculated using VisRseq. A list of MERVL elements that generate chimeric transcripts was downloaded7 and mapped onto the mm10 genome using UCSC LiftOver. To measure individual transposable element expression, only uniquely aligned, non-PCR duplicate reads were counted. Elements were grouped and sorted by K-medoid clustering on log10-transformed RPKM values using the R package “cluster” and VisRseq.