Selection of trials
Through database searching and screening with preset criteria, a total of 15 trials(1, 3-6, 8-10, 12-18) were selected for inclusion in the meta‑analysis. The search process is described in Figure 1.
Basic characteristics of included studies
The basic characteristics of the 15 included trials are summarized in Table 1. Eight were published in Chinese(3, 5, 9, 10, 14, 16-18), the others in English. A total of 511 and 502 patients were included in the QLB and TAPB groups, respectively. Trial sizes ranged from 50 to 107 patients. Patients underwent various abdominal surgeries, including Cesarean delivery, appendectomy, total abdominal hysterectomy, laparoscopic cholecystectomy, inguinal hernia repair, colorectal open surgery, laparotomy, gastrectomy, and others. Pediatric patients, from 6 months to 14 years old, participated in 2(6, 12) trials. Subcostal(1), posterior(4), and lateral(3, 5, 6, 8-10, 12-18) TAPB approaches were used.
Risk of bias assessment
The assessment of the risk of bias of the 15 RCTs is summarized in Figure 2. Three(1, 6, 16) trials provided unclear detailed descriptions of randomization. Seven(6, 9, 10, 14, 16-18) trials lacked detailed description of allocation concealment. A double-blind method was applied in 8 trials(1, 4, 6, 8, 10, 13, 15, 17). Only 1 trial(6) had no incomplete outcomes (attrition bias). All trials reported all the end points mentioned in their methods sections (reporting bias).
Results of meta-analysis
Meta-analysis of at-rest visual analog scale scores
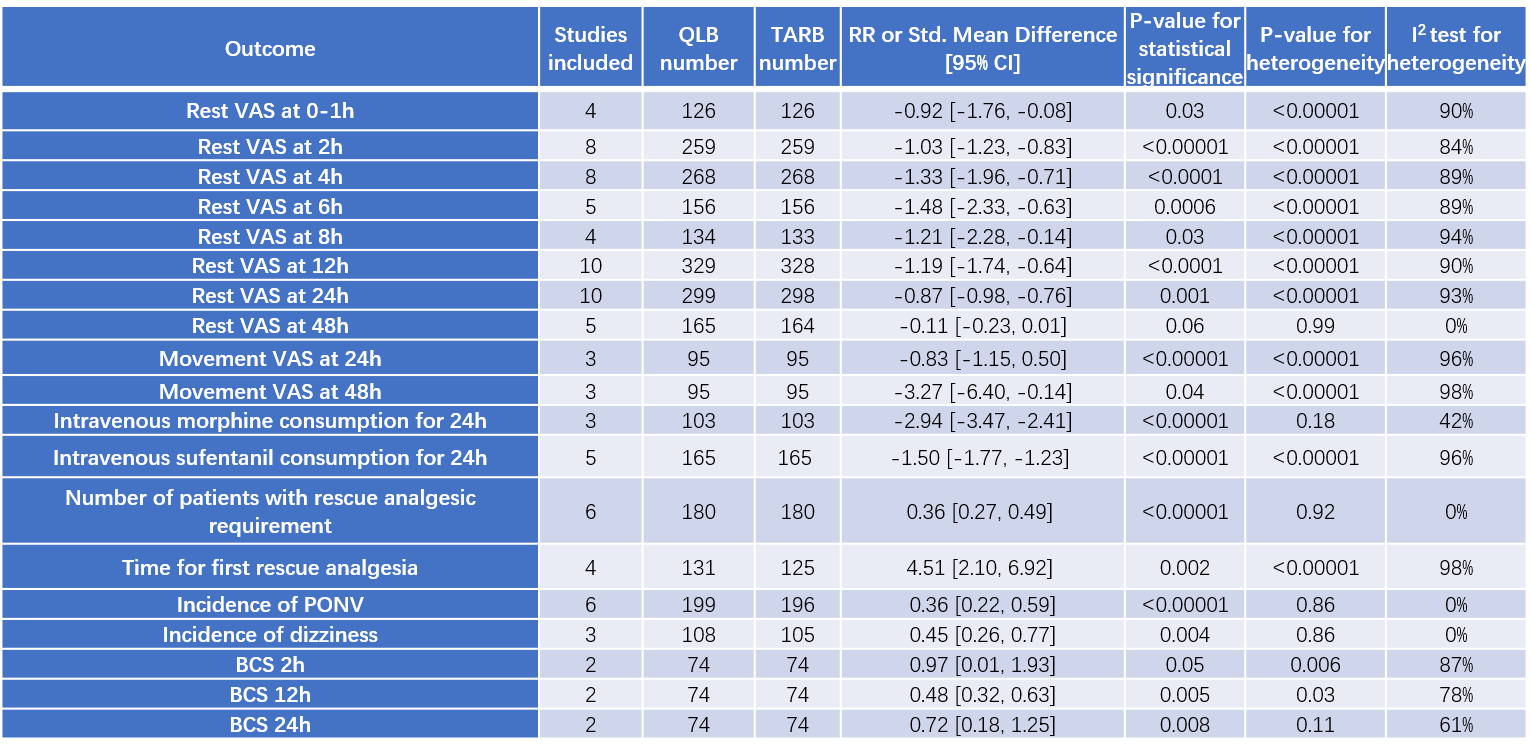
At-rest VAS (visual analog scale) scores were assessed at 0–1 h in 4 trials(5, 13, 15, 16), at 2 h in 8 trials(3-5, 10, 13, 14, 16, 18), at 4 h in 8 trials(3-5, 9, 10, 13, 16, 18), at 6 h in 5 trials(4, 5, 13-15), at 8 h in 4 trials(3, 9, 16, 18), at 12 h in 10 trials(3-5, 9, 10, 13-16, 18), at 24 h in 10 trials(3-5, 9, 10, 13-16, 18), and at 48 h in 5 trials(3, 4, 9, 15, 18). (Table 2, Figures 3–5)
Compared with TAPB, QLB reduced at-rest VAS scores by 9 mm at 0–1 h (95% CI: -1.66, -0.13; P<0.02), by 10 mm at 2 h (95% CI: -1.23, -0.83; P<0.00001), by 13 mm at 4 h (95% CI: -1.96, -0.71; P<0.0001), by 15 mm at 6 h (95% CI: -2.33, -0.63; P=0.0006), by 12 mm at 8 h (95% CI: -2.28, -0.14; P=0.03), by 12 mm at 12 h(95% CI: -1.74, -0.64; P<0.0001), and by 9 mm at 24 h (95% CI: -0.98, -0.76; P=0.001) postoperatively. However, there was no significant difference between QLB and TAPB groups in at-rest VAS scores at 48 h postoperatively (P=0.06). The 2 pediatric trials(6, 12) using FLACC (Face, Legs, Activity, Cry, Consolability) and POAS (Pediatric Objective Pain Scale) scores both showed that pain in the QLB group was lower compared with that in the TAPB group.
Meta-analysis of at-movement visual analog scale scores
Three trials(3, 4, 18), including a total of 190 patients, reported at-movement VAS scores at 24 h and 48 h postoperatively. At-movement VAS scores in the QLB group were lower than those in the TAPB group, both at 24 h (MD=-0.83; 95% CI: -1.15, -0.50; P<0.00001) and 48 h (MD=-3.27; 95% CI: -6.38, -0.16; P=0.04). (Table 2, Figure 6)
Meta-analysis of postoperative analgesic requirements
Intravenous morphine and sufentanil consumption over the first 24 hours postoperatively were reported by 3 trials(5, 8, 13) and 5 trials(3, 9, 15, 17, 18), respectively. Compared with the TAPB group, the QLB group consumed less morphine (MD=-2.94; 95% CI: -3.47, -2.41; P<0.00001) and sufentanil (MD=-1.50; 95% CI: -1.77, -1.23; P<0.00001) during the first postoperative day. The number of patients who required rescue analgesia was lower in the QLB group (RR=0.14; 95% CI: 0.08, 0.25; P<0.00001)(3, 4, 6, 15). Moreover, the time to first rescue analgesic was significantly longer in the QLB group than in the TAPB group(4, 5, 12, 13, 16, 18). (Table 2, Figure 7)
Meta-analysis of side effect incidences
The rate of PONV, recorded by 6 trials(9, 10, 14, 15, 17, 18), was higher in the TAPB group (RR: 0.36; 95% CI: 0.22, 0.59; P<0.00001). The rate of dizziness was also higher in the TAPB group (RR: 0.45; 95% CI: 0.26, 0.77; P=0.004)(9, 10, 17). (Table 2, Figure 8)
Meta-analysis of comfort scores
BCS (Bruggemann comfort scale) scores were reported by only 2 trials(3, 10) at 2 h, 12 h, and 24 h postoperatively. There was no significant difference between the two groups in BCS scores at 2 h (MD=0.97; 95% CI: 0.01, 1.93; P=0.05), while the QLB group showed higher BCS scores at 12 h (MD=0.48; 95% CI: 0.32, 0.63; P=0.005) and 24 h (MD=0.72; 95% CI: 0.18, 1.25; P=0.008). (Table 2, Figure 9) Two trials(15, 18) indicated that patients in the QLB group were more satisfied than those in the TAPB group.