JWA negatively regulates HER2 expression and cell proliferation in breast cancer
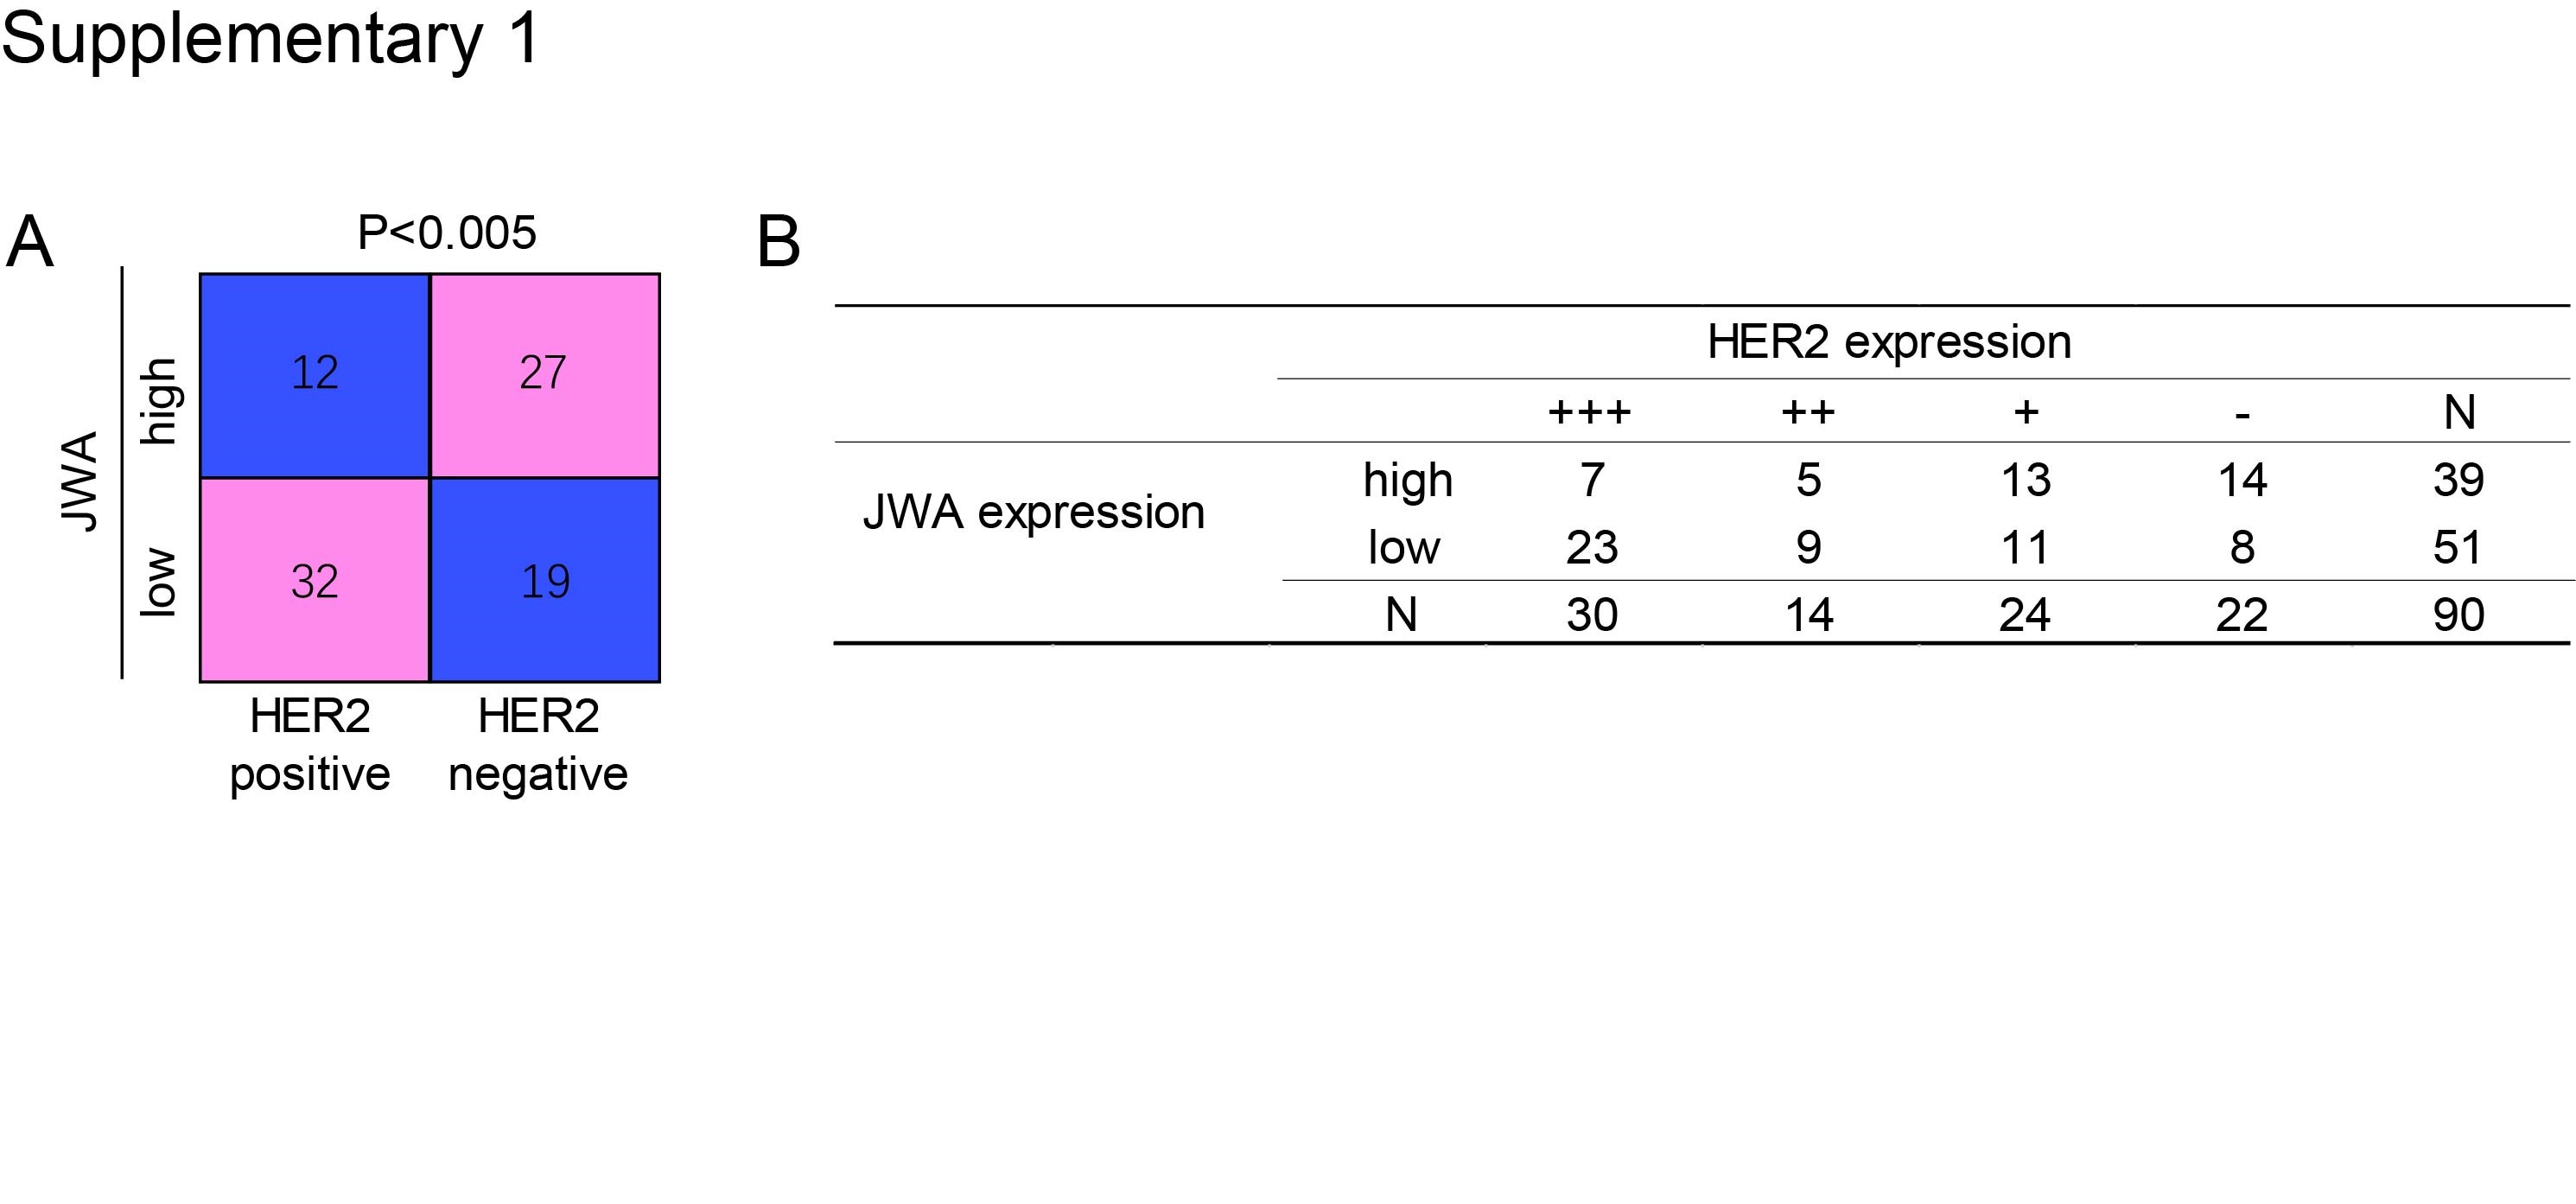
To understand the relationship between expressions of JWA and HER2 and breast cancer, firstly, we interrogated the TCGA database. JWA was significantly down regulated in breast tumors compared to that in normal breast epithelium (n = 1218; Fig. 1A). The overall survival (OS) was longer in cases with higher JWA expression in tumor tissue than those with lower JWA expression; the OS was shorter in cases with higher HER2 expression than those with lower HER2 expression (n = 1402; Fig. 1B-C). To confirm this, we analyzed survival data from GEO database (GSE88770 and GES42568, n = 221). The data also showed that the cases with JWA low and HER2 high expression in tumor tissue had a worst outcome; in contrast, the cases with JWA high and HER2 low expression had a best outcome (log-rank test, * P < 0.05; ** P < 0.01; Fig. 1D). We further verified the expressions of JWA and HER2 in protein level in human breast cancer tissue microarray (TMA). As predicted, significant down regulation of JWA was observed in the samples with HER2 overexpression (Fig. 1E). As shown in Additional file 1: Fig. S1A-B, 32/44 cases showed JWA low expression in HER2 positive ones; in contrast, 27/46 HER2 negative cases showed high JWA expression (n = 90; P < 0.005).
To determine if HER2 expression was regulated by JWA, we constructed both Flag-JWA and si-JWA plasmids and their controls and then transfected these plasmids into human breast cancer BT474 cells, respectively. As shown in Fig. 1F, the cells with Flag-JWA showed down-regulation of HER2, however, an up-regulation of HER2 was observed in cells with si-JWA. Therefore, HER2 expression was down-regulated by JWA in breast cancer cells. To determine if the down-regulation of HER2 by JWA in breast cancer cells was linked to cell proliferation, we completed colony formation assays. An obvious inhibition of proliferation in BT474 cells with Flag-JWA, however an increased proliferation in BT474 cells with si-JWA was determined (P < 0.005; Fig. 1G). Confocal imaging assay showed that expression of HER2 on cell membrane was down regulated by Flag-JWA but up-regulated by si-JWA in BT474 cells (Fig. 1H).
JAC1 down-regulates expression of HER2 and inhibits cell proliferation in breast cancer
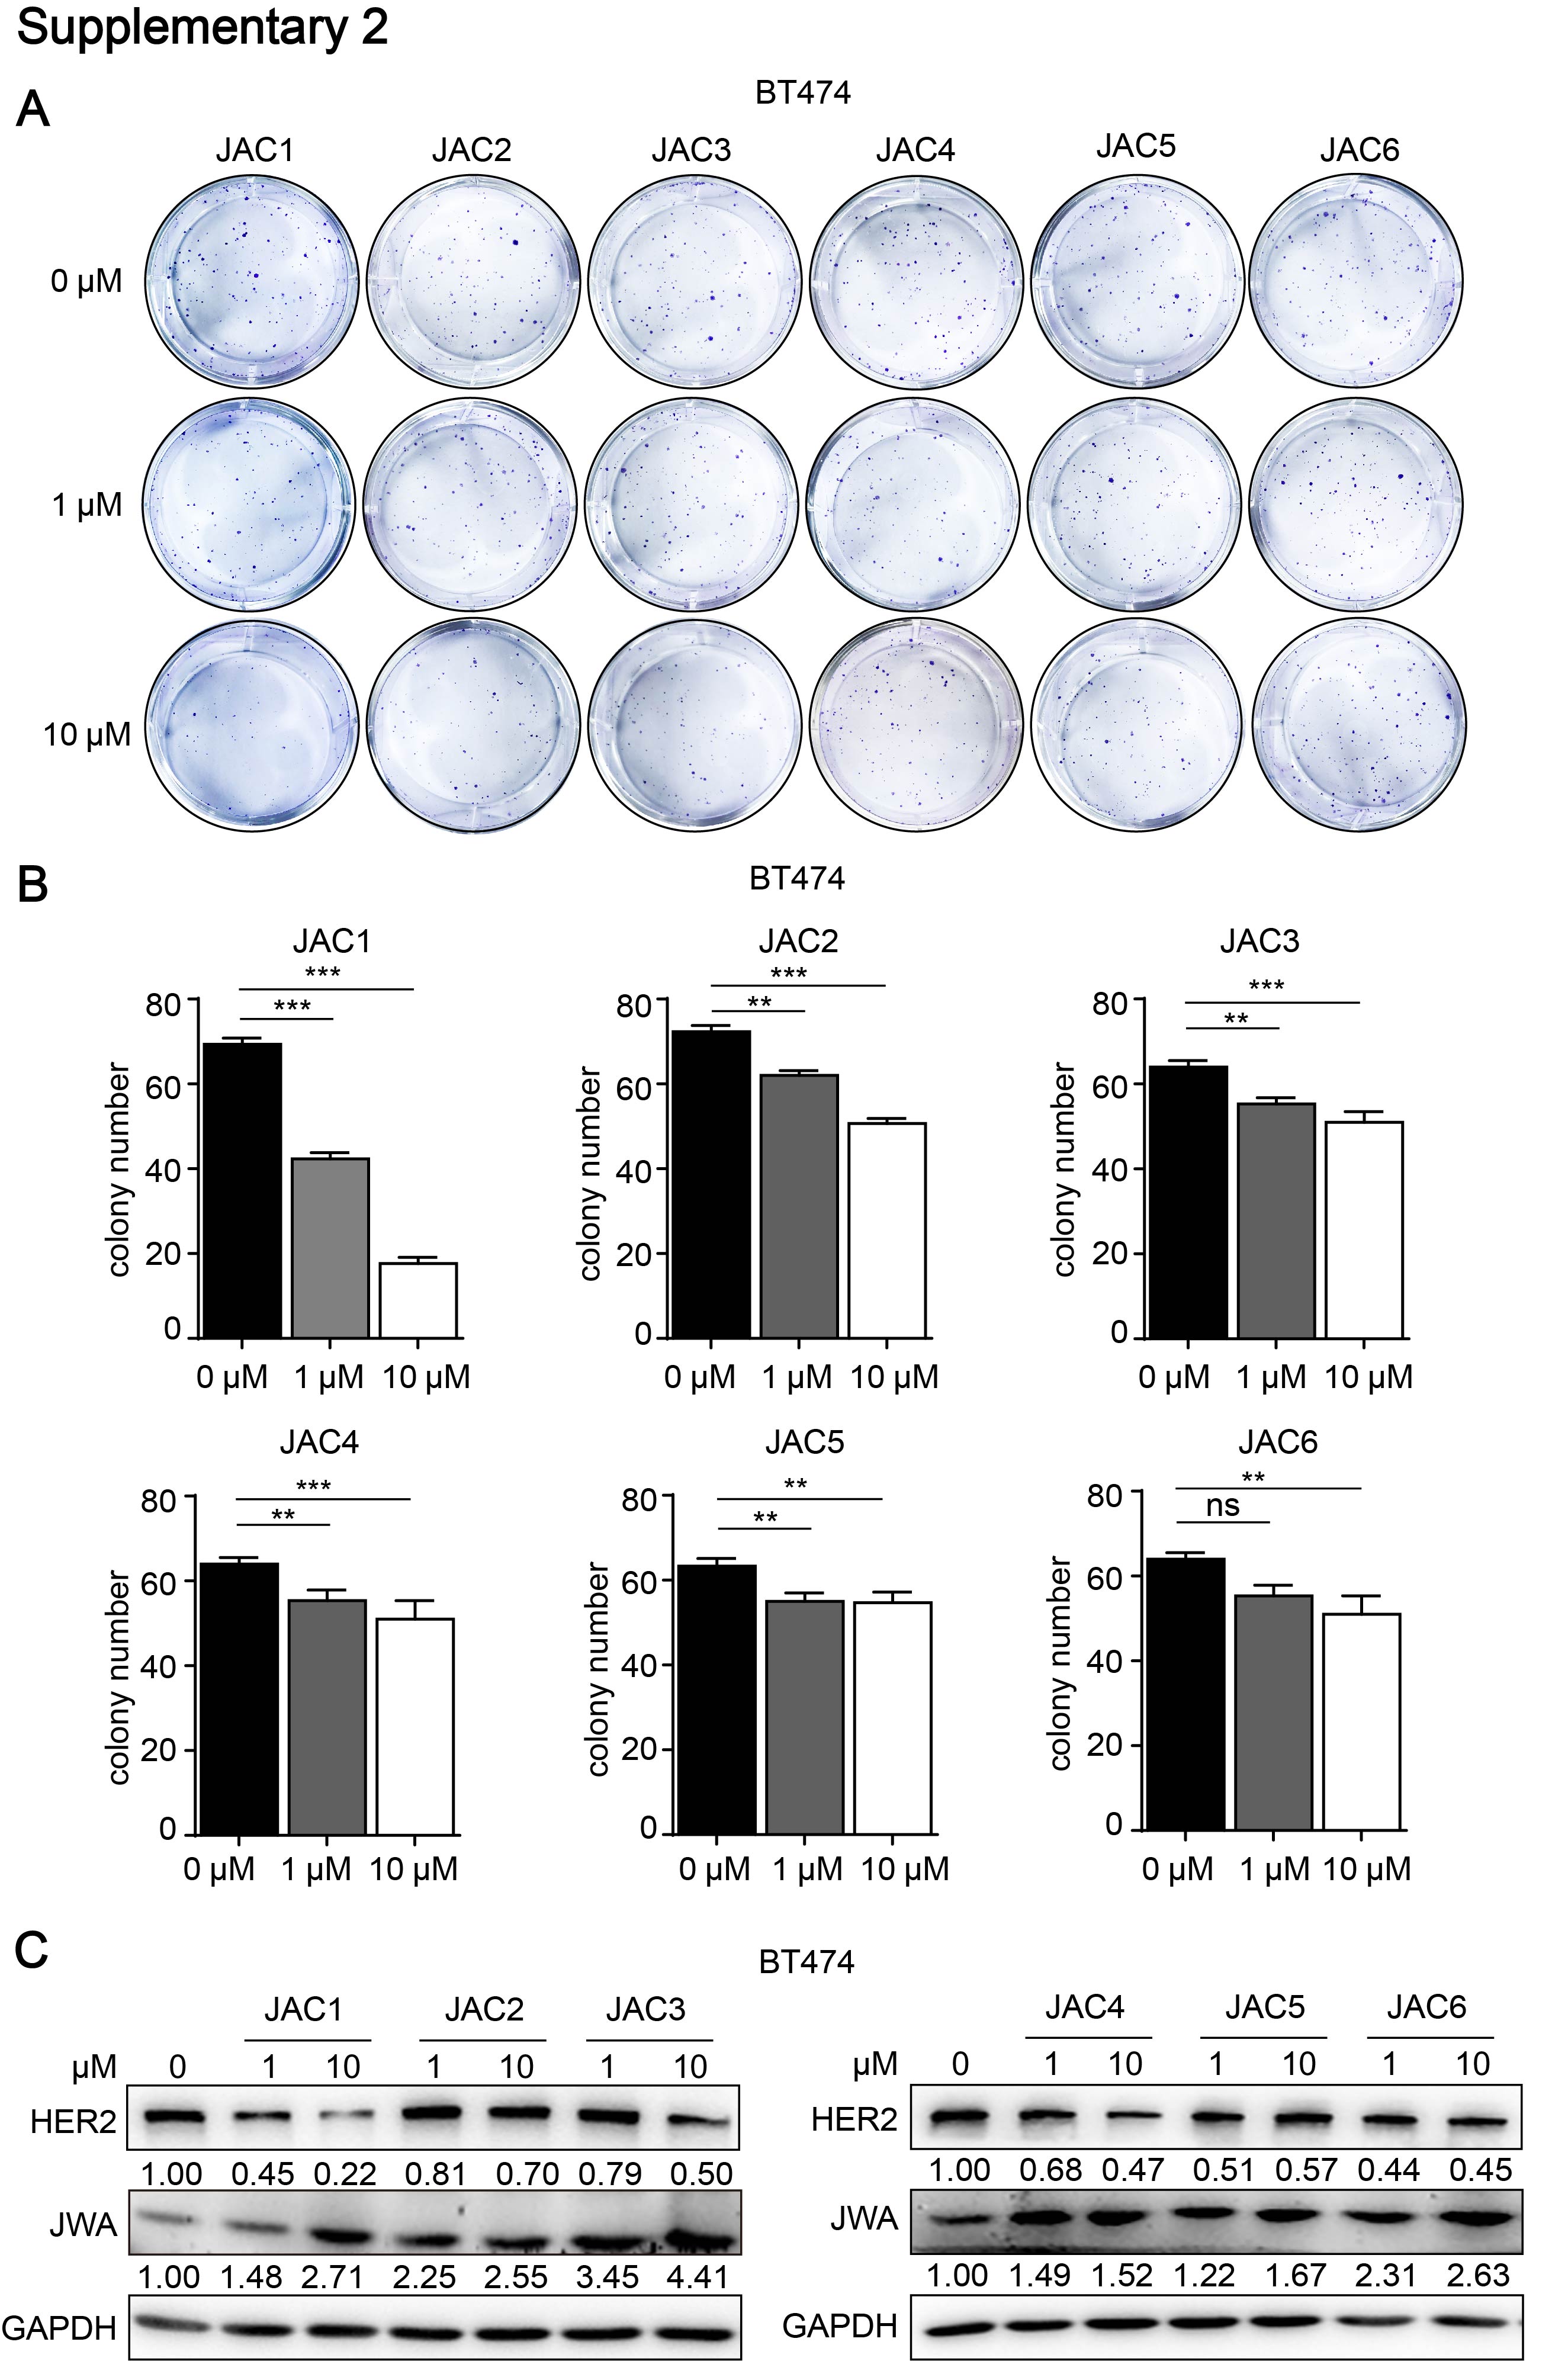
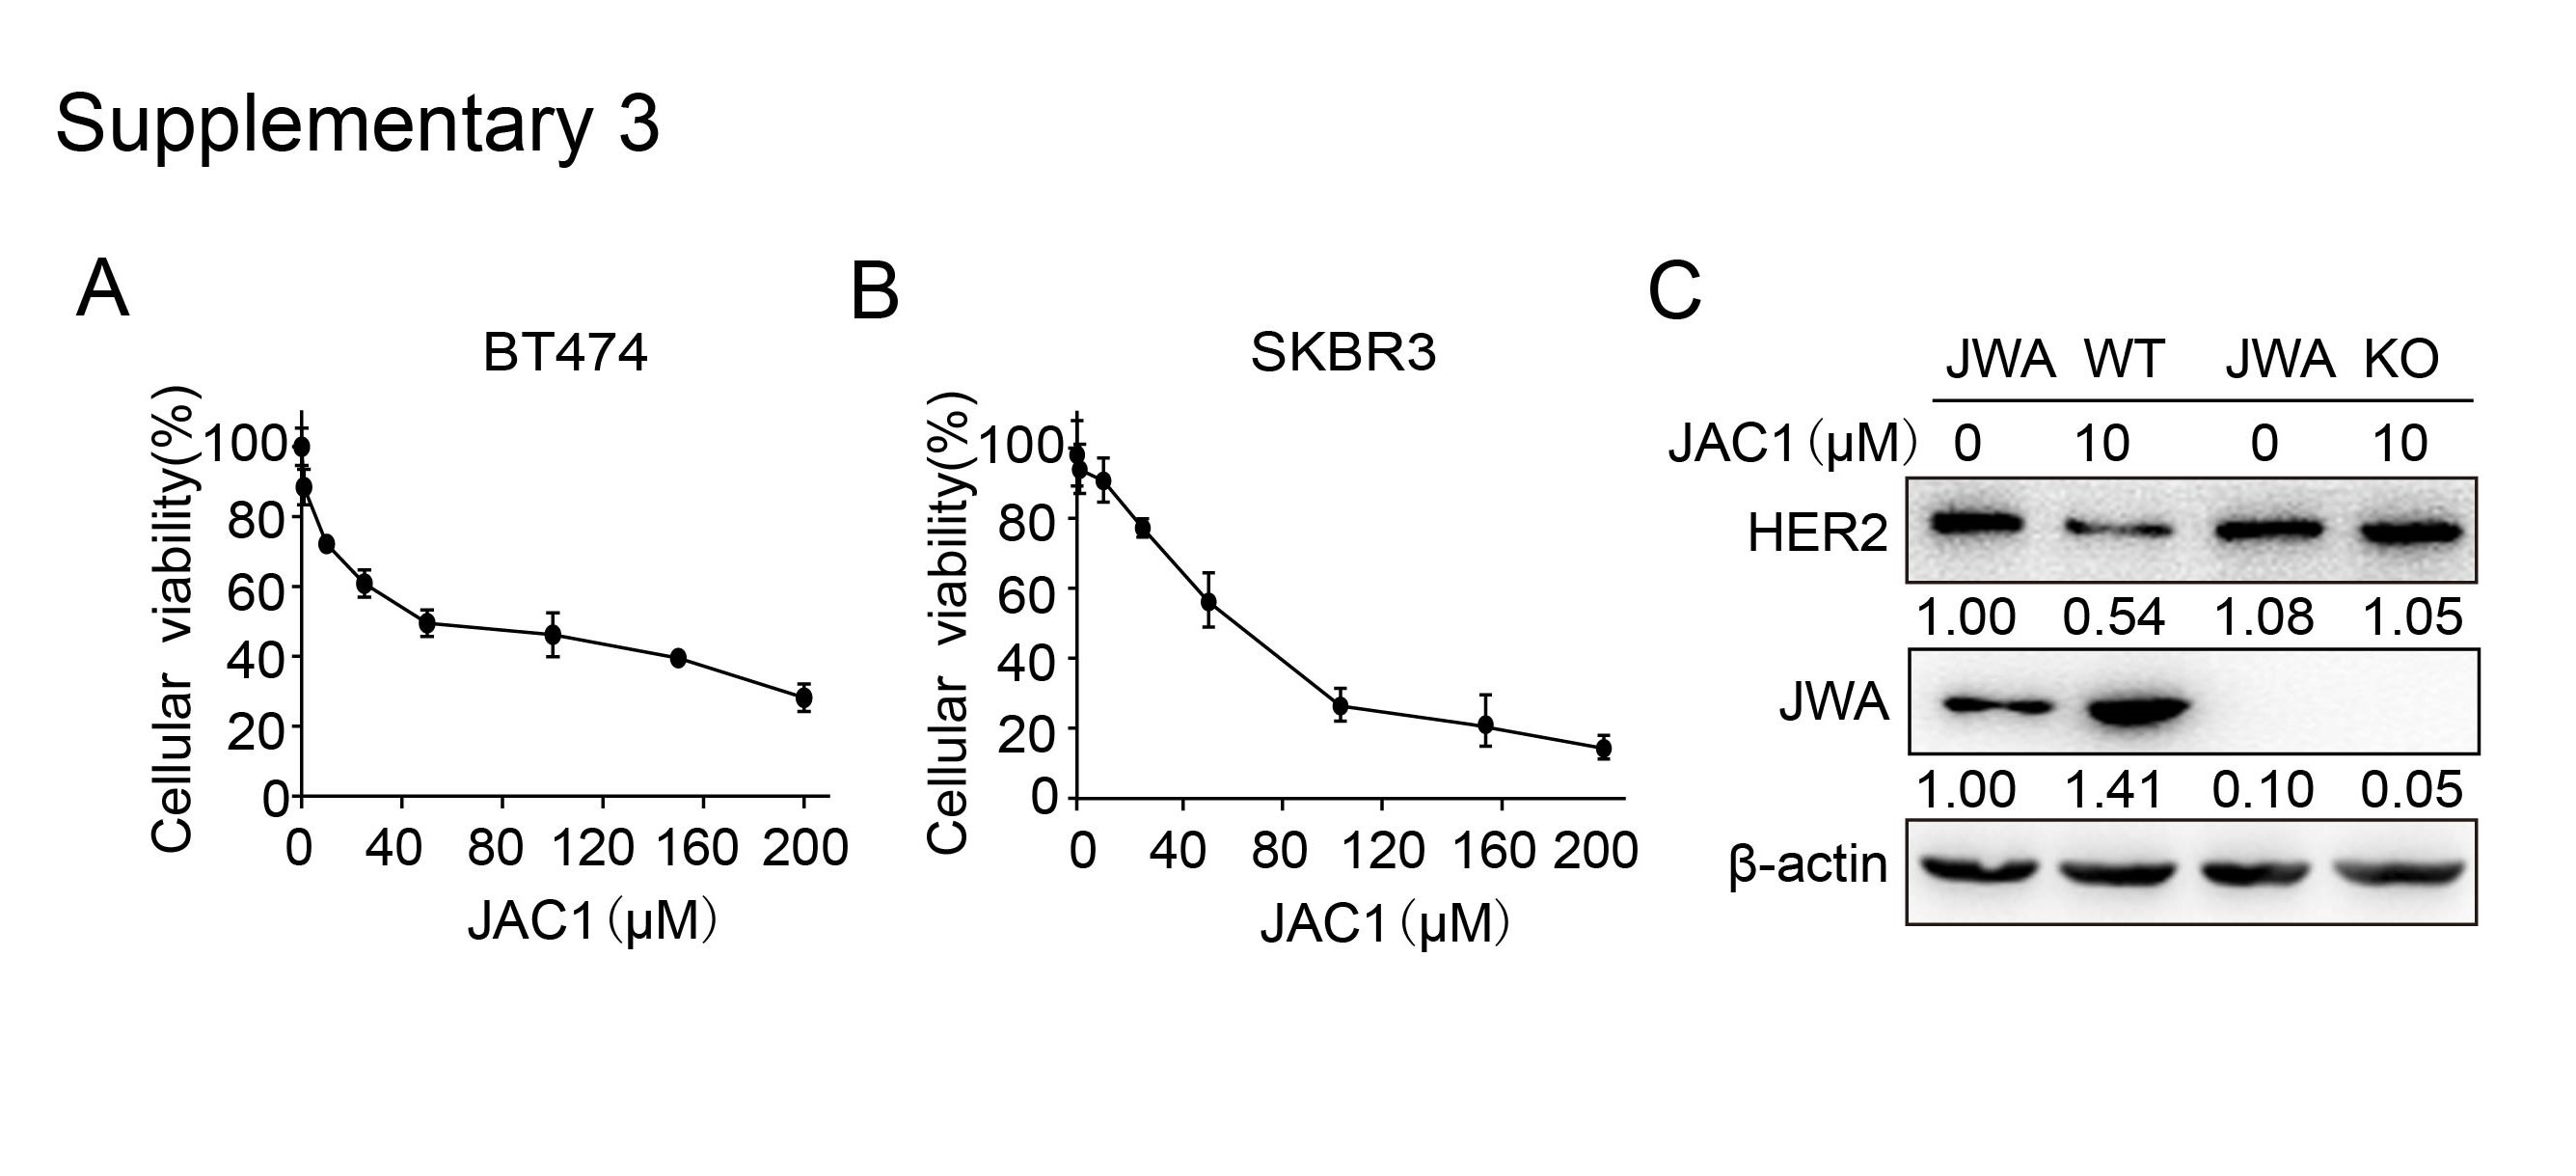
To find the potent agonist of JWA gene in human normal cells, we constructed JWA promoter-containing reporter gene stably transfected HBE cells and completed series high-throughput screening assays from 40,000 compounds in national compound library (Shanghai, China). As shown in Additional file 2: Fig. S2A-B, although all JAC1 ~ JAC6 compounds were indicated responsiveness in screening assays, the colony formation assay showed JAC1 was more effective in inhibiting cell proliferation than the other 5 candidates; Western blot results showed JAC1 was more capable of activating JWA and down-regulating HER2 than other 5 candidates in BT474 cells (Additional file 2: Fig. S2C). The chemical structure formula of JAC1 was shown in Fig. 2A. As shown in Fig. 2B, JAC1 dose-dependently increased JWA however inhibited HER2 expressions at protein levels in both BT474 and SKBR3 cells; the IC50 of JAC1 on breast cancer cells were then determined (Additional file 3: Fig. S3A-B); the IC50 values were 52.28 µM in BT474 and 68.46 µM in SKBR3 cells, respectively.
To confirm if JWA was necessary to the regulation of JAC1 on HER2 in cancer cells, we constructed JWA knockout (KO) BGC823 human gastric cancer cells by CRISPR/CAS9 technique (the details will describe elsewhere); and an off-target assay of JAC1 on HER2 was completed by JWA KO BGC823 cells. As indicated in Additional file 3: Fig. S3C, JAC1 activated JWA but suppressed HER2 expressions significantly in JWA wild type (WT) BGC823 cells; however, JAC1 had no effects on HER2 expression in JWA KO BGC823 cells. Colony formation assay showed that JAC1 dose-dependently inhibited proliferations in both BT474 and SKBR3 cells (Fig. 2C-D). Confocal imagining showed a dose-dependent reduction of HER2 but induction of JWA expression in both BT474 and SKBR3 cells after treatment with 0, 1, 10 µM of JAC1 for 24 h (Fig. 2E).
JAC1 down-regulates expression of HER2 via ubiquitin-proteasome pathway
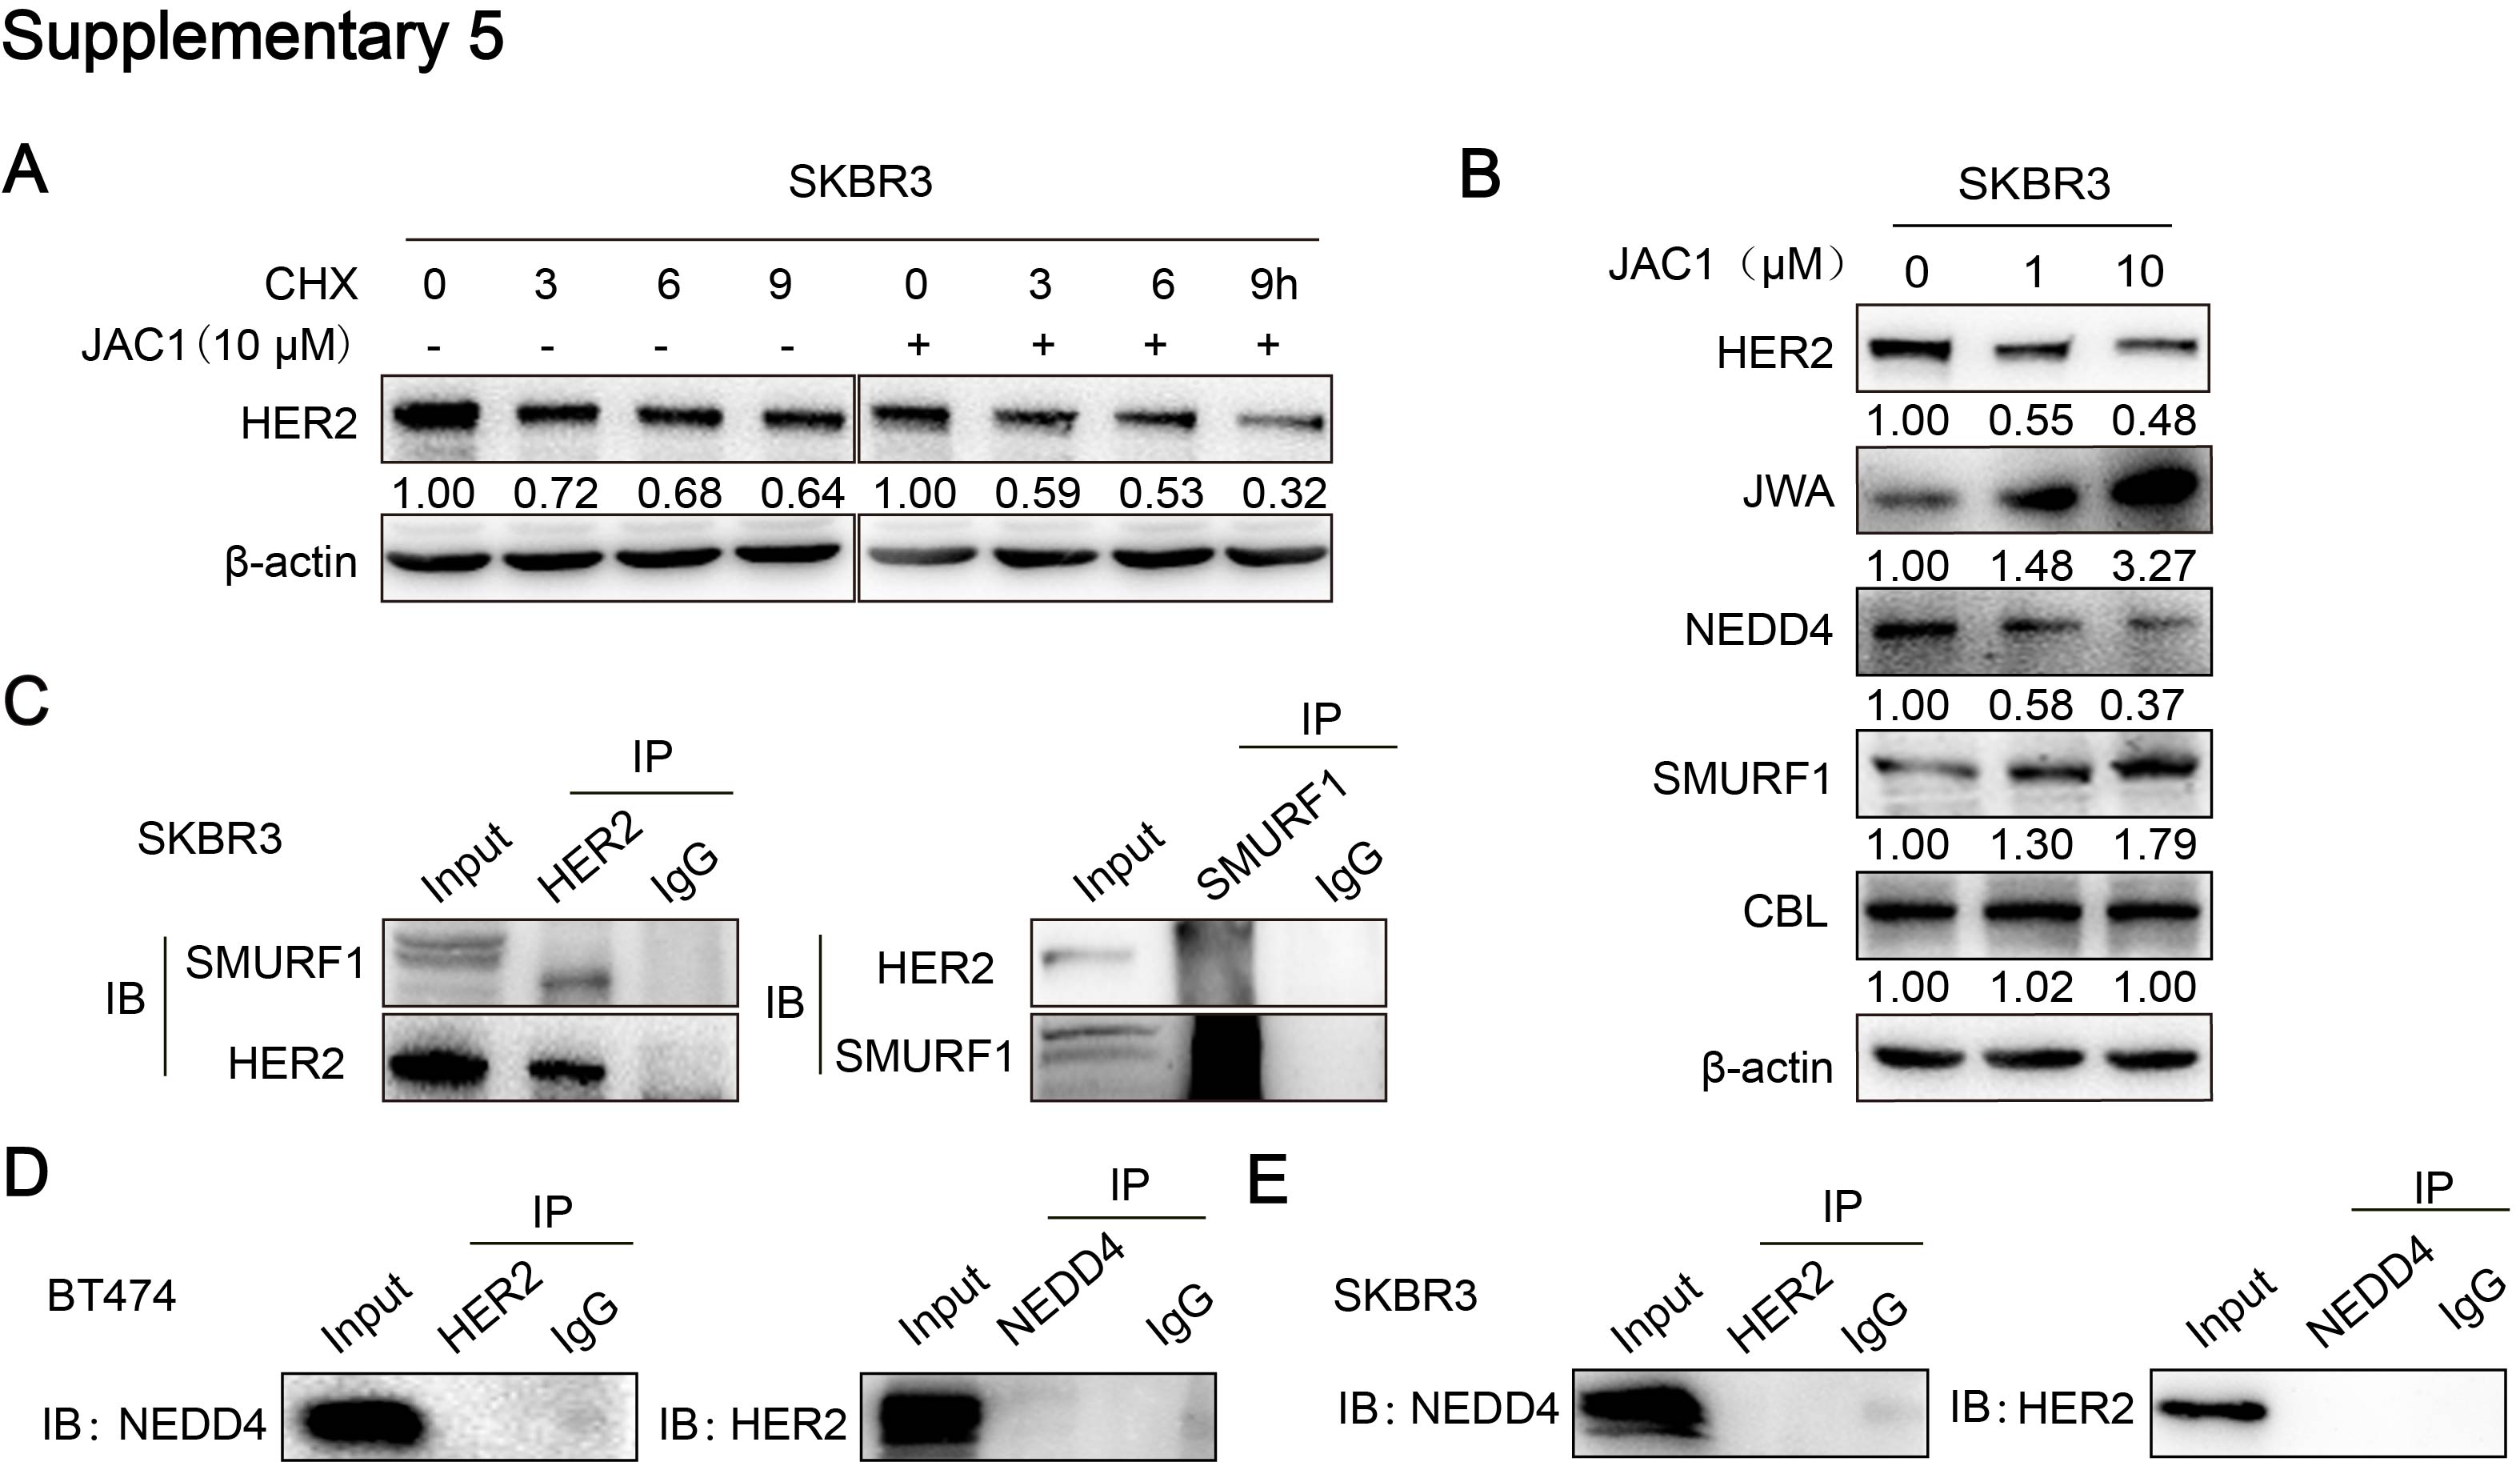
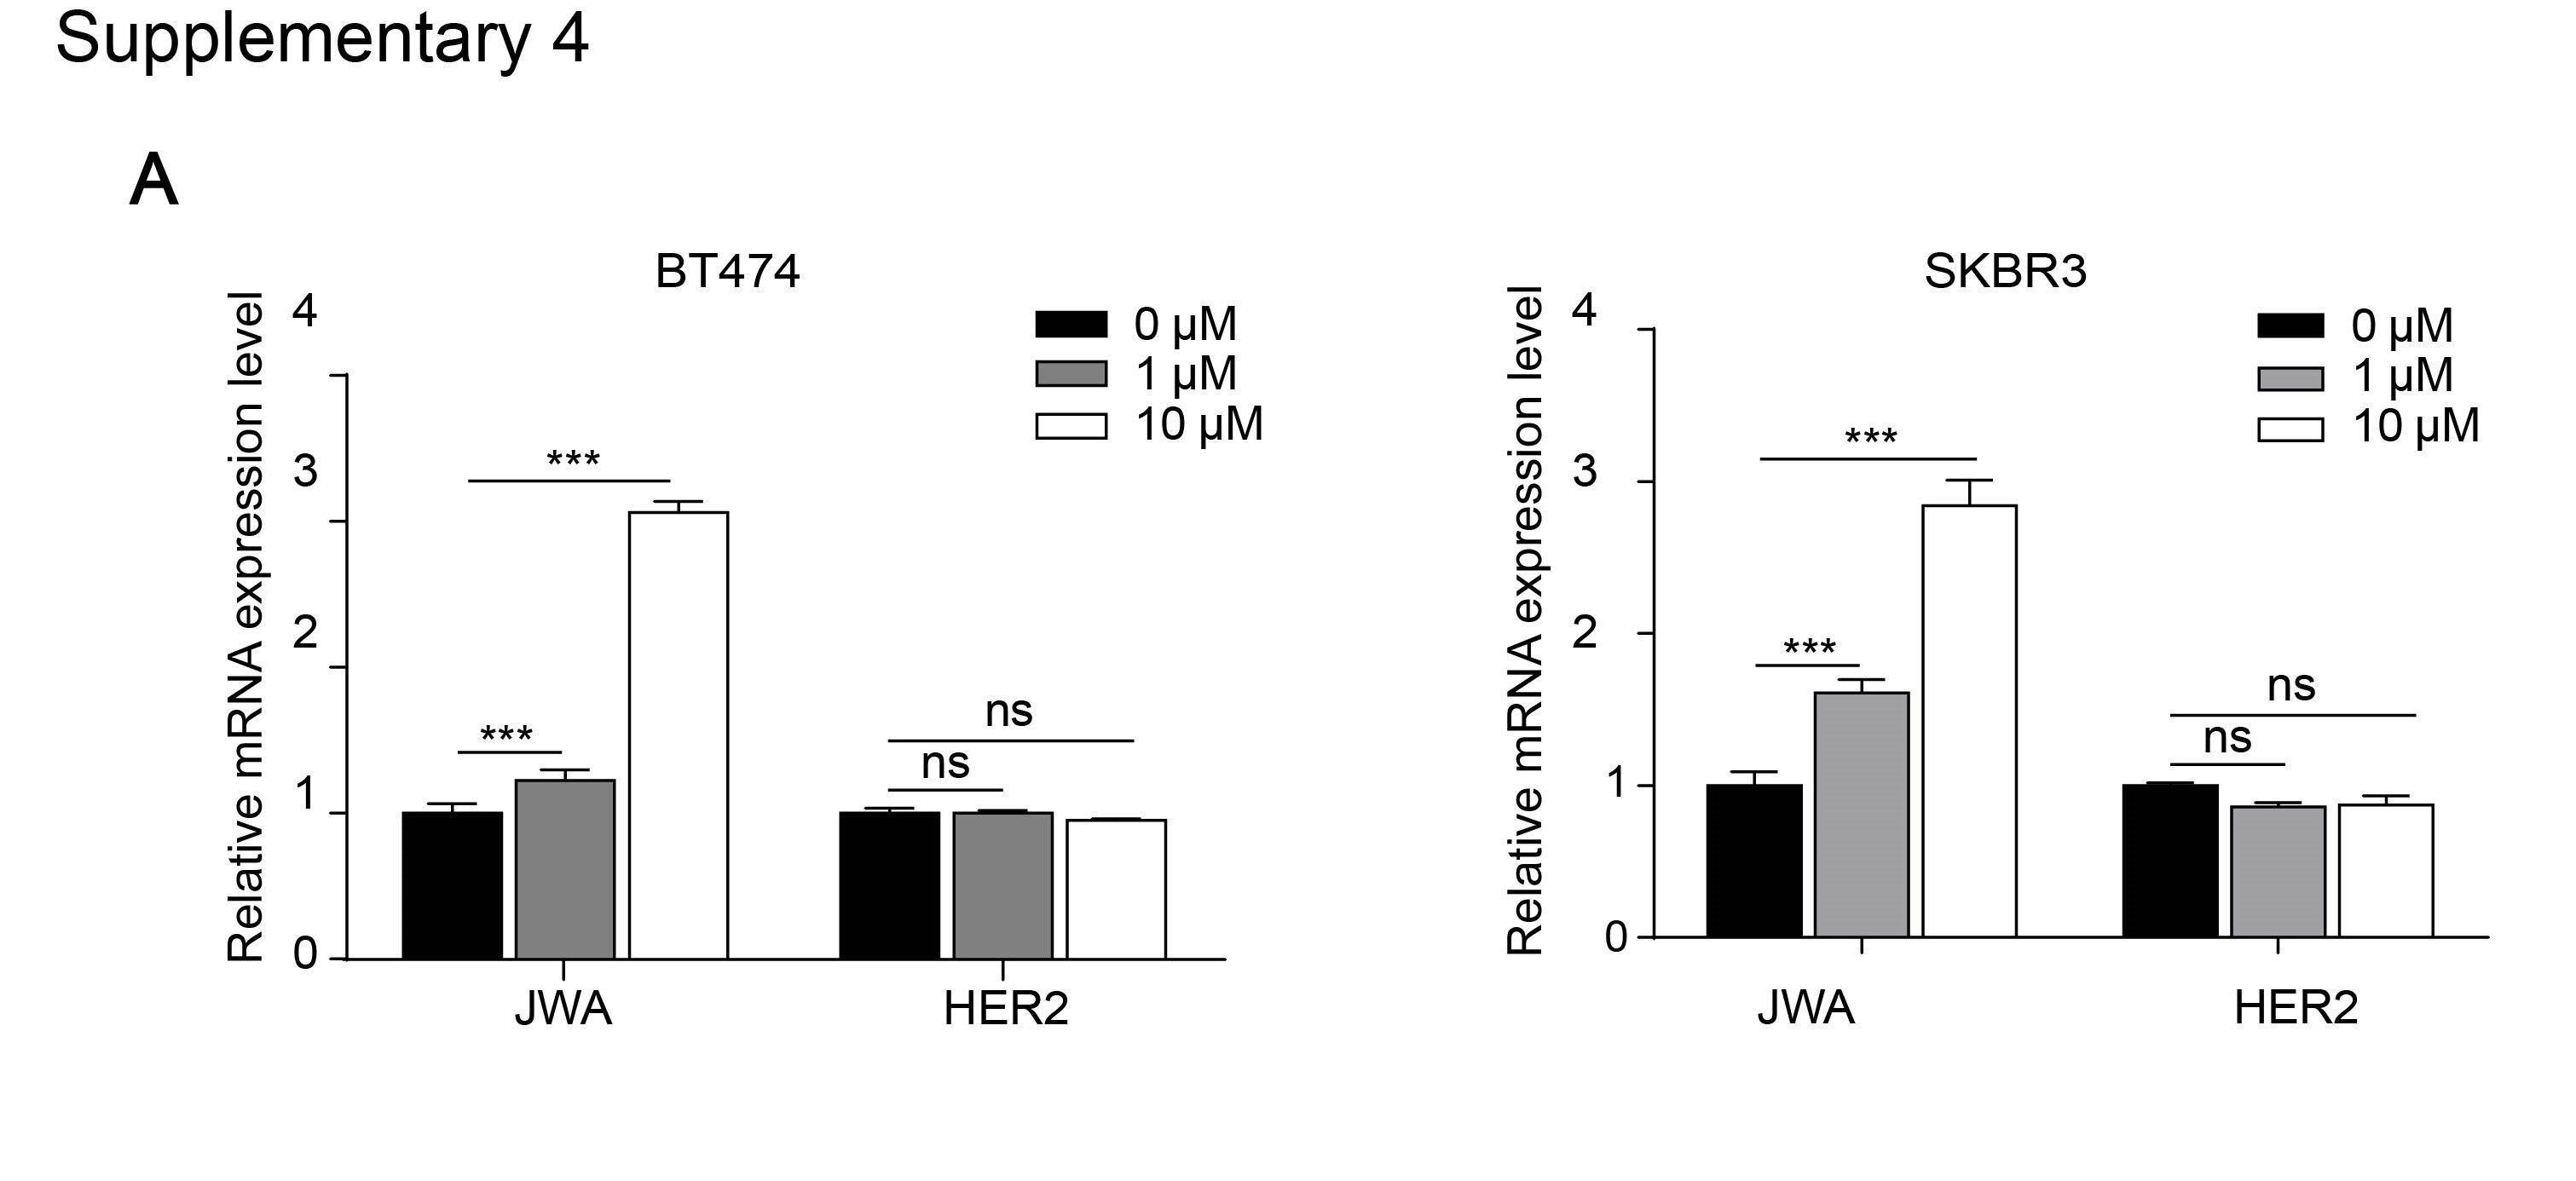
To determine how JWA down-regulates HER2 in breast cancer cells, we first examined HER2 mRNA levels by RT-PCR after JAC1 treatment. The data showed that JAC1 increased JWA but had non-effect on HER2 at mRNA level in both BT474 and SKBR3 cells (Additional file 4: Fig. S4A). At protein level, when CHX was used for blocking protein synthesis, HER2 degradation was obviously accelerated by JAC1 treatment in both BT474 and SKBR3 cells during the indicating time points (Fig. 3A and Additional file 5: Fig. S5A). We further demonstrated that ubiquitinated HER2 was obviously increased in both BT474 and SKBR3 cells after JAC1 exposure (Fig. 3B-C). To find the potential candidate of E3 ubiquitination ligase to HER2, we searched in web tool of UbiBrowser (ubibrowser.ncpsb.org/) [22]. In this network view the central node was the queried substrate ERBB2 (HER2), and the surrounding nodes were the predicted corresponding E3 ubiquitination ligases. The edge width and surrounding node size were positively correlated with the confidence of prediction. The predicted data shown that NEDD4, CBL and SMURF1 may play important roles in ubiquitination degradation of HER2 (Fig. 3D). Among the three candidates, SMURF1 expression was increased but NEDD4 was reduced dose-dependently by JAC1 treatment in both BT474 and SKBR3 cells (Fig. 3E and Additional file 5: Fig. S5B). Similar results were obtained after transfection either with Flag-JWA or si-JWA in SKBR3 cells (Fig. 3F). These data suggest that SMURF1 may be the candidate E3 ubiquitin ligase for HER2. We then completed co-immunoprecipitation experiments to see if SMURF1 can interact with HER2. As we predicted, there was an interaction between HER2 and SMURF1 in BT474 and SKBR3 cells (Fig. 3G and Additional file 5: Fig. S5C). The interactions between HER2 and NEDD4 were also conducted, unfortunately, we obtained a negative result (Additional file 5: Fig.S5D-E).
K716 of HER2 is the ubiquitination target by SMURF1
To identify the potential target amino acids in HER2 by SMURF1 ubiquitination, we searched http://www.phosphosite.org/; as shown in Fig. 4A, there were 10 candidate ubiquitination sites (lysine, k) in HER2 protein amino acid sequence. We then constructed HER2 mutants for all or separate of these 10 amino acids in HER2 sequence and replaced lysine (K) by arginine (R), respectively. Next, wild type or mutant HER2 expression plasmids were transfected into SKBR3 cells respectively, and followed by JAC1 and CHX treatment. As a result, only HER2 (K716R) and HER2 (ALL) (all 10 sites mutant) was resistant to CHX-induced reduction of HER2 (Fig. 4B). To confirm this, HER2 (K716R), HER2 (WT) and HER2 (ALL) mutant were transfected into BT474 cells and followed by treatment with JAC1 and CHX. The results obtained in BT474 cells was similar those in SKBR3 cells, JAC1 only accelerated degradation of HER2 (WT) instead of HER2 (K716R) and HER2 (mutant ALL) (Fig. 4C). Then, the ubiquitination of HA-HER2 was attenuated by MG132 treatment in HER2 (K716R) SKBR3 cells compared to those with HER2 (WT) cells (Fig. 4D). Colony formation numbers was increased in HER2 (WT) and HER2 (K716R) BT474 cells compared to control cells (P < 0.001); JAC1 (10 µM) treatment obviously suppressed cell proliferation in both HER2 (WT) and control BT474 cells, but no effect on HER2 (K716R) BT474 cells (Fig. 4E-F). Thus, the effect of JAC1 on BT474 cell proliferation was dependent on the presence of amino acid K716 in HER2.
JAC1 modulates SMURF1 through JWA-p38-GATA-1-NEDD4 axis
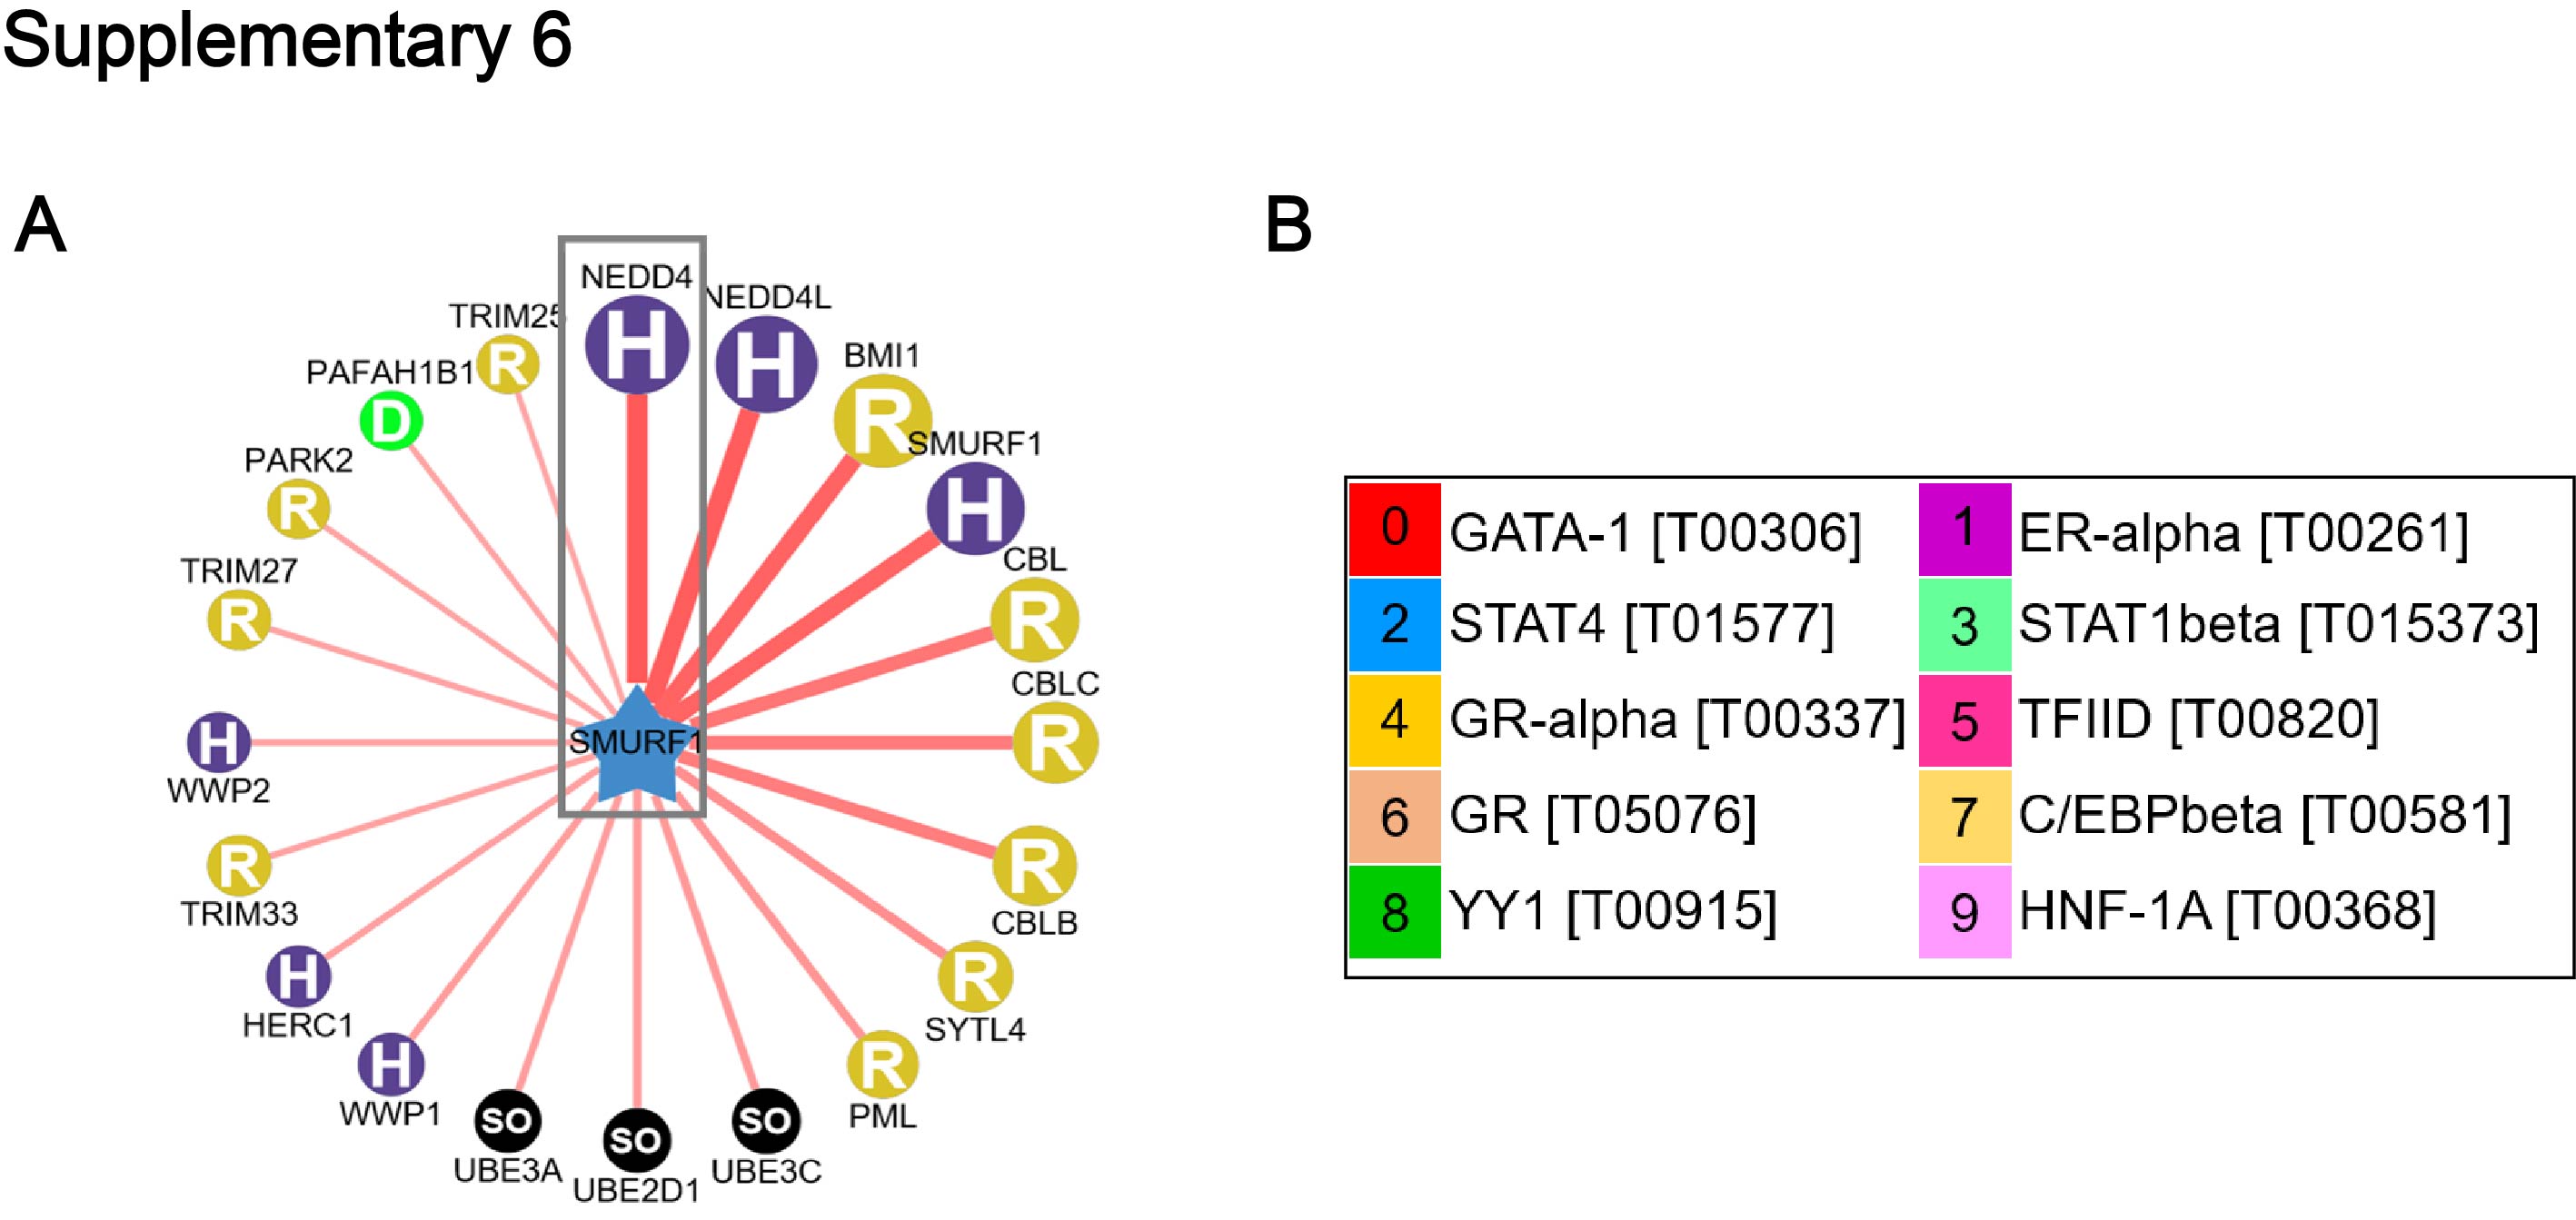
Given JAC1 as potent activator of SMURF1, we desired to identify how JAC1 up-regulates SMURF1? As a web tool predicted result, NEDD4 was the most crucial E3 ubiquitin ligase of SMURF1 (Additional file 6: Fig. S6A) since it was dose-dependently down-regulated by JAC1 treatment (Fig. 3E and Additional file 5: Fig. S5B). The expression patterns of SMURF1 and NEDD4 was quite oppositely after JAC1 exposure. In addition, co-IP experiments manifested that SMURF1 exactly interacted with NEDD4 (Fig. 5A-B).
To elucidate how JAC1 down regulates NEDD4 expression, we determined mRNA levels by RT-PCR. The data showed that JAC1 dose-dependently down-regulated mRNA expression of NEDD4 (Fig. 5C-D). Further, the web tool (ALGGEN-PROMO) prediction indicated that several transcription factors may contribute to the JAC1 mediated NEDD4 down regulation (Additional file 6: Fig. S6B). We already knew there is non-regulation between ER and HER2. We then focused on both GATA-1 and STAT4 and their relationship to NEDD4 in BT474 and SKBR3 cells. Data showed JAC1 treatment induced a dose-dependent increase of JWA, reduction of GATA-1, but no obvious effect on STAT4 (Fig. 5E). Recent studies have revealed that JWA inhibits cell migration by activating MAPK signal pathway [13, 23], and TNF-α represses GATA-1 through activation of p38 MAPK [24]. Here we identified that expression of GATA-1 was negatively regulated by JAC1 mediated activation of p38 MAPK (Fig. 5F). To confirm this, p38 inhibitor SB203580 was used to block the role of JAC1 via p38 on NEDD4. Data showed the expressions of p-p38 induced by JAC1 was mostly prevented by SB203580; similarly, JAC1 inhibited GATA-1 expression was mostly reversed under SB203580 treatment in SKBR3 cells (Fig. 5G). To further confirm if this signaling practically mediated the cell proliferation phenotype of JAC1, we completed colony formation assay. The data showed that JAC1 suppressed proliferation of SKBR3 cells was partly reversed by SB203580 (Fig. 5H-I). Taken together, we have revealed the inhibition of JAC1 to proliferation by suppression of HER2 in breast cancer cells.
JAC1 suppresses tumor growth in BT474 breast cancer cell xenograft mice
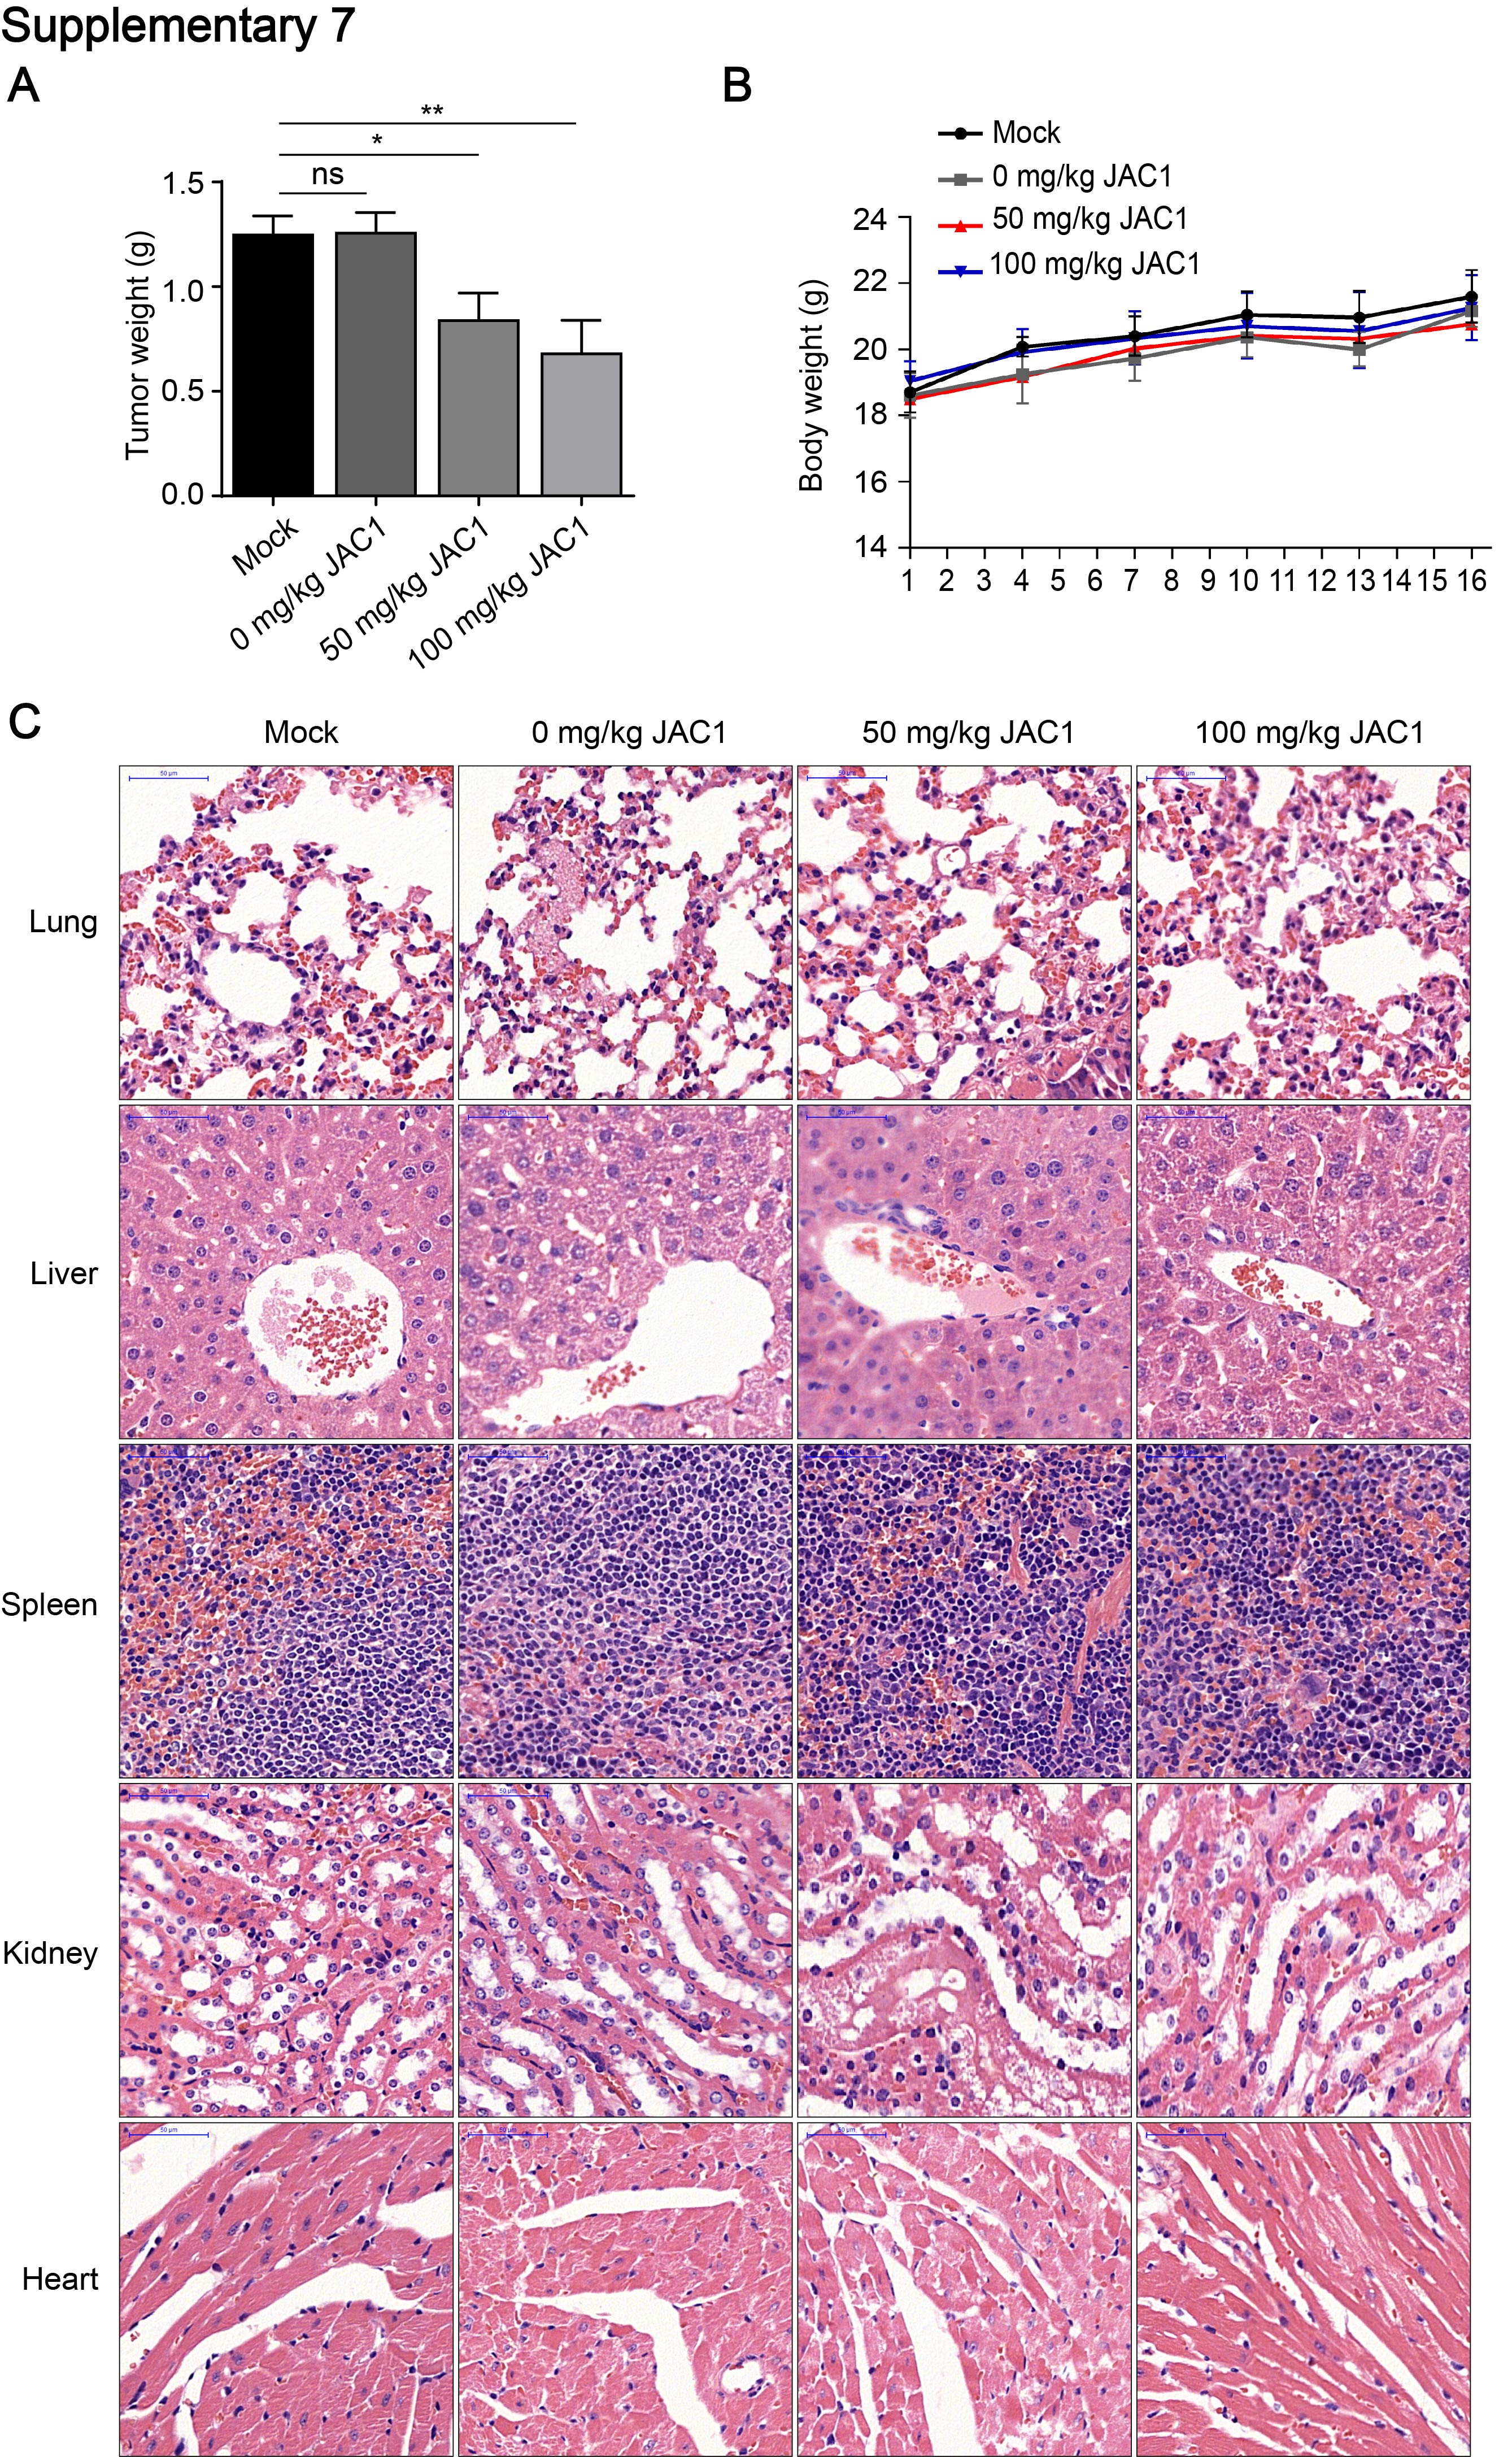
To evaluate the translational significance, an in vivo breast cancer BT474 cell xenograft and JAC1 experimental therapy mouse model was conducted. As shown in Fig. 6A, JAC1 dose-dependently inhibited the growth of xenograft tumor. The similar ratio of tumor weight/body weight was shown in Fig. 6B; the tumor inhibition rate by JAC1 was 31.22% and 46.21% in 50 mg/kg and 100 mg/kg groups, respectively (Fig. 6C); in addition, compared to the mock group, the solvent showed no significant effect on tumor growth (Fig. 6A-C and Additional file 7: Fig. S7A-B). The picture of isolated xenograft tumor mass of each group was shown in Fig. 6D. To confirm whether the action mechanism of JAC1 on xenograft breast cancer was through the signaling pathways identified in vitro models, the related biomarkers were determined in isolated tumor tissues. As shown in Fig. 6E, expressions of HER2 was dose-dependently reduced by JAC1 treatment; importantly, the mechanistic biomarkers including JWA, p-p38, GATA-1, NEDD4 and SMURF1 were indicated corresponding changes in tumor tissues. H&E staining revealed that JAC1 treatment did not shown obvious injuries on organs including lung, liver, spleen, kidney and myocardium (Additional file 7: Fig. S7C). The serum biochemical parameters indicated a favorable improvement including antioxidant (SOD), liver function (ALT/AST), myocardial cells (CKMB/CK) and lipid metabolisms (TG) after JAC1 treatment (Additional file 8: Supplementary Table 1). Taken together, the in vivo results demonstrated that JAC1 inhibits breast tumor growth in a dose-dependent manner; the mechanism of action of JAC1 was consistent between in vivo and in vitro models (Fig. 6F). In conclusion, the agonist of JWA gene JAC1 promoted JWA expression; JWA activated p38 by phosphorylation and suppressed downstream transcription factor GATA-1 and linked E3 ubiquitin ligase NEDD4; the reduced NEDD4 resulted in an overexpression of SMURF1, a specific E3 ubiquitin ligase to HER2 (K716); JAC1 mediated HER2 degradation further suppressed tumor growth in HER2 positive breast cancer. In particularly, JAC1 has a protective effect on major organs and lipid metabolism in mice.
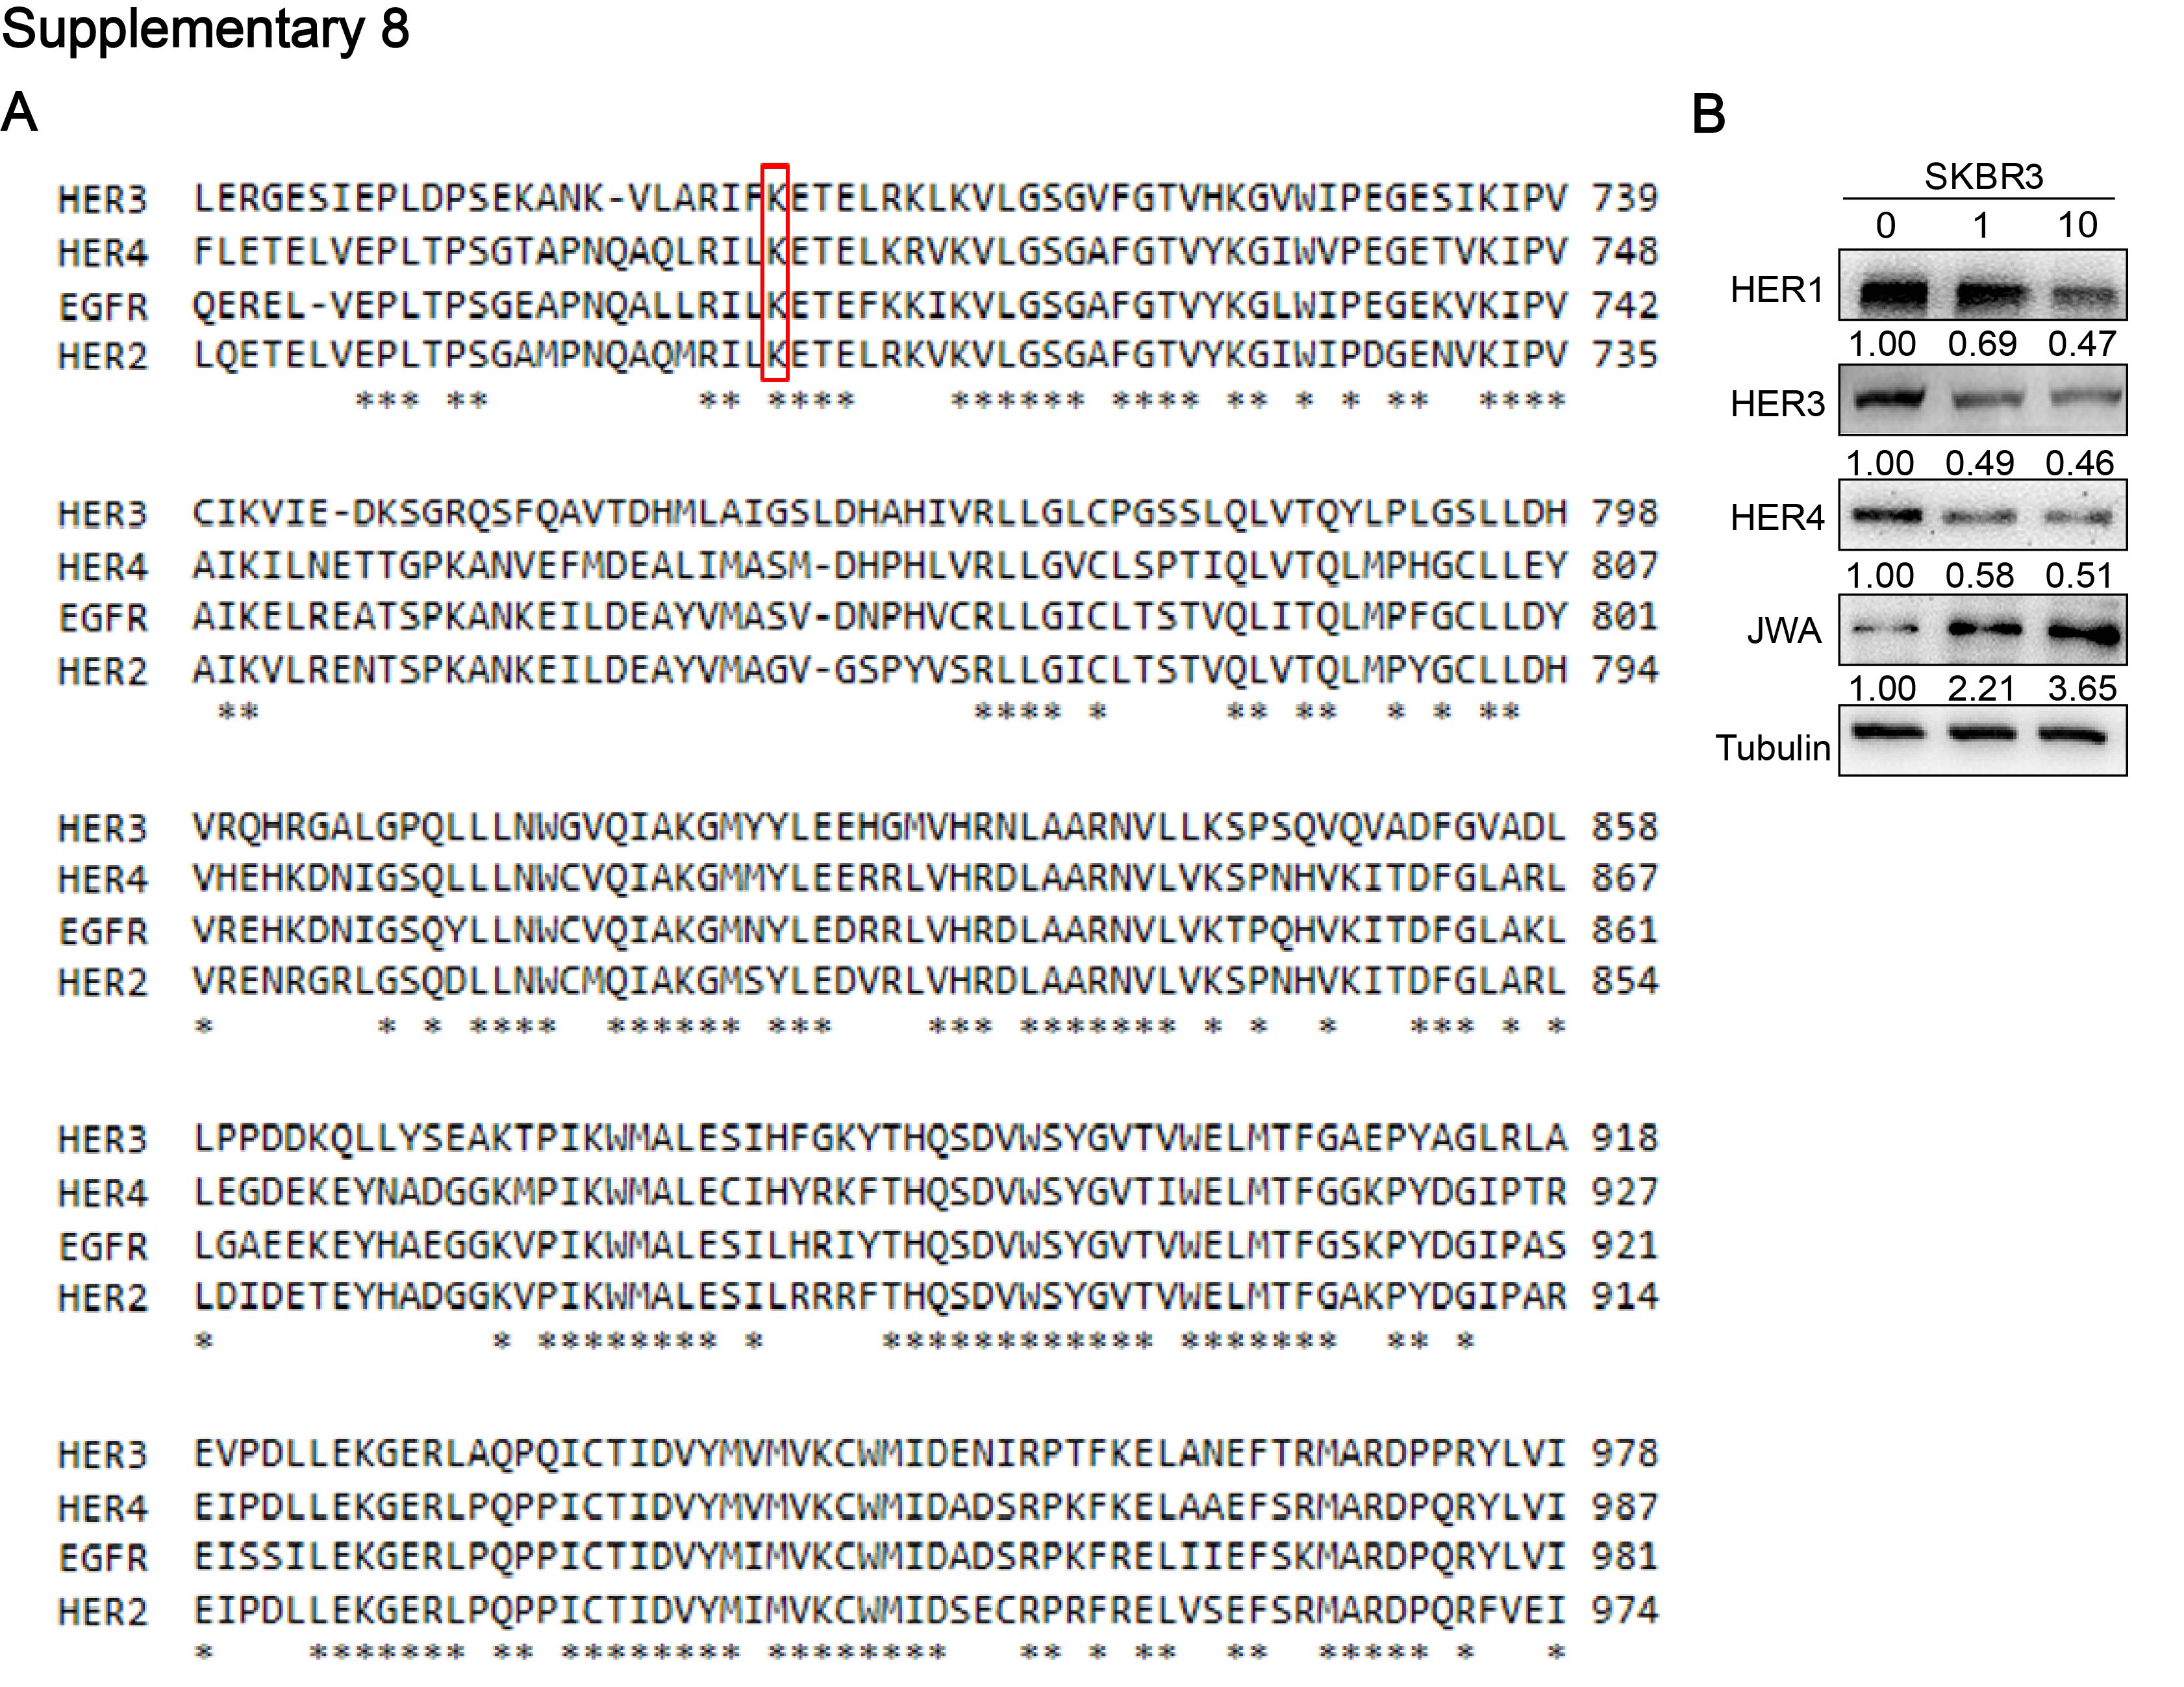
Since HER2 is a member of the EGFR family, we compared the protein amino acid sequences of four members of the EGFR family (HER1 ~ HER4); and found that K716 is a homologous amino acid and presents in four members (Additional file 9: Fig. S8A). In theory, JAC1 may work for all four members. To confirm this, we determined expressions of HER1, HER3 and HER4 in JAC1 treated SKBR3 cells. As we predicted, JAC1 dose-dependently suppressed expressions of all EGFR members (Additional file 9: Fig. S8B).