Identification and analysis of DEGs in datasets.
DEGs between DM samples and controls in each dataset were screened out by GEO2R based on adjusted P-value < 0.05 and ∣logFC∣>1. After obtaining the intersection DEGs of six datasets (GSE142807, GSE1551, GSE5370, GSE39454, GSE48280 and GSE46239) by Venn diagram (Figure1, A-B), we obtained 31 DEGs. And they are all upregulated in the DM samples. Then, we conducted GO and KEGG enrichment analysis for them. GO enrichment analysis was used to explore the DEGs` potential mechanisms from the perspective of molecular function, biological process and cellular component categories. And the results revealed that the NO.1 high-correlated pathway of each module were CXCR chemokine receptor binding; defense response to virus; blood microparticle (only 1 pathway was obtained) respectively (figure1, C). The results of KEGG showed that the top 3 high-correlation pathways are Influenza A, Hepatitis C and Measles (figure1, C). And the circus presented the correlations between the 31 DEGs and the related biological processes at the shared term level (figure1, D).
GSEA analysis.
GSEA was used to analyse enriched KEGG pathways between DM groups and controls in six datasets. And 2 KEGG pathways (cytokine cytokine receptor interaction and cell adhesion molecules cams) that expressed significantly higher in disease groups were exhibited by the figure 2.
Identification and analysis of hub DEGs.
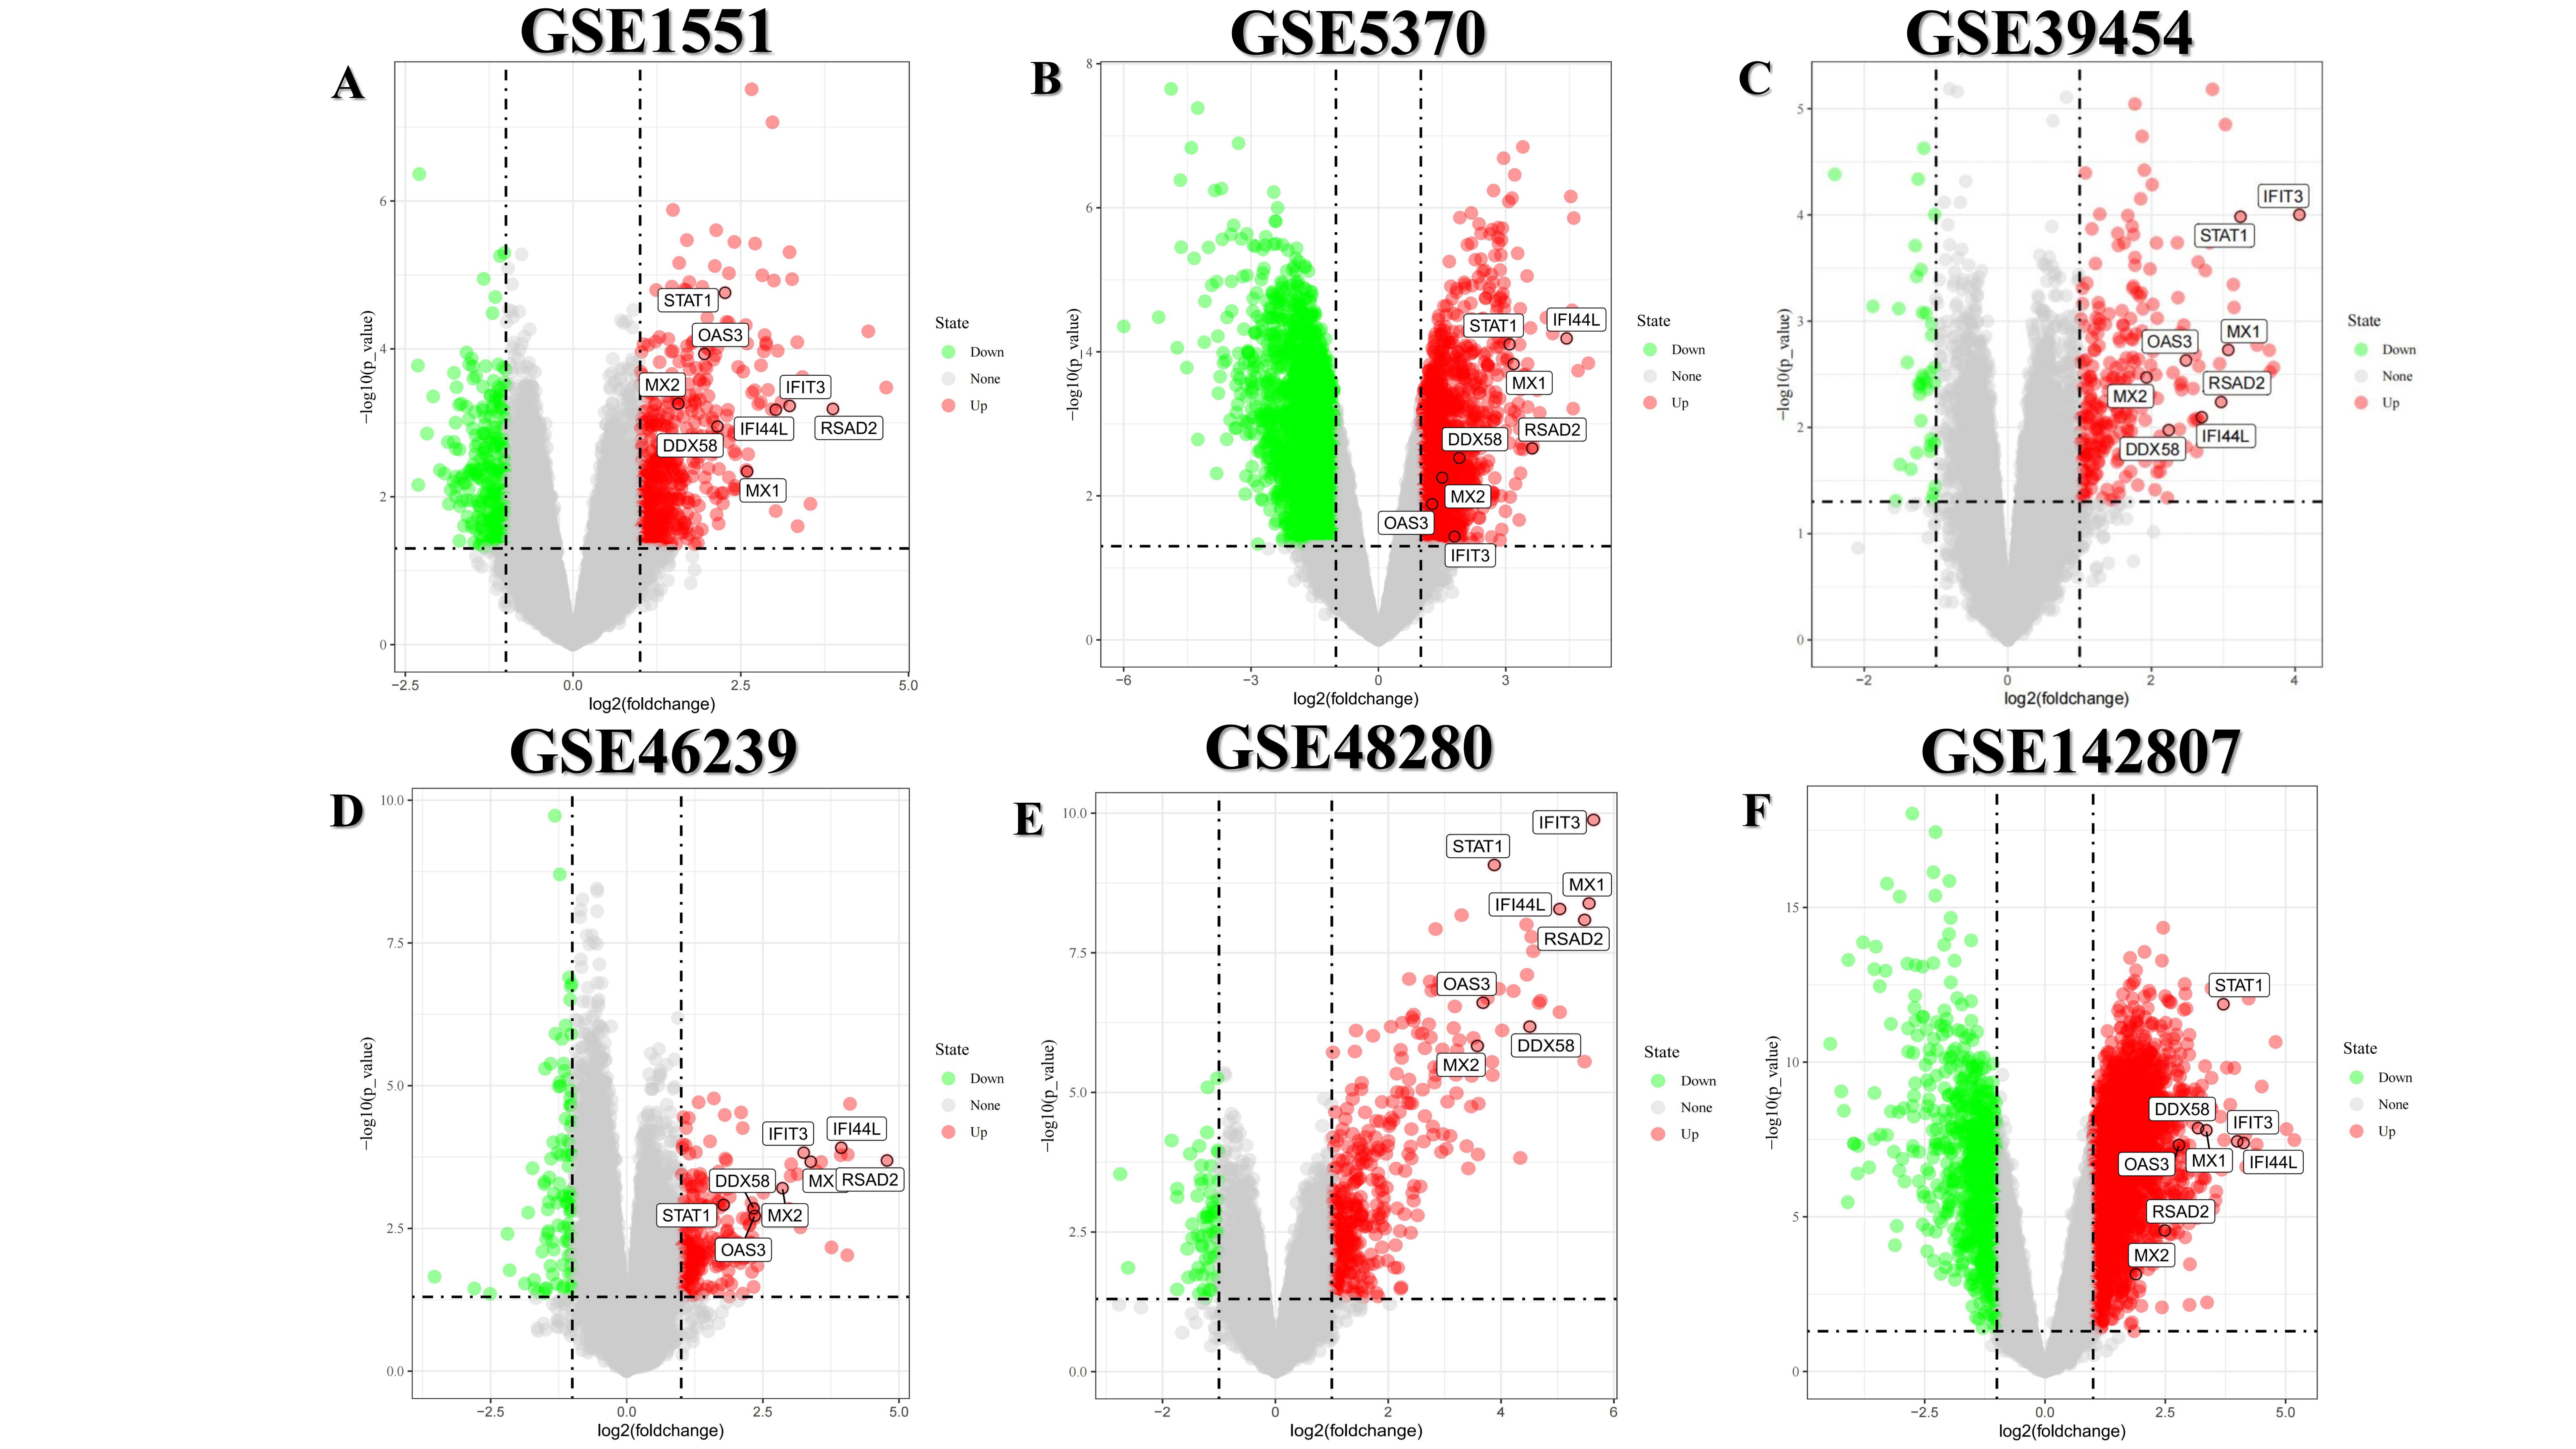
STRING database was used to analyze the 31 DEGs and the analysis results were imported into Cytoscape software. MCODE plugins in Cytoscape was used to build up protein-protein interaction network, aimed at searching for the DEGs with high correlation with each other. Therefore, we obtained two modules, characterized by red and blue (figure3, A). According to the results of ClueGo analysis (figure 3, B-D), it suggested that the top 3 high-correlated pathways were “type Ⅰ interferon signaling way”, “negative regulation of viral genome replication” and “regulation of type Ⅰ interferon production” respectively, implying the immune elements especially type 1 interferon takes up an important position in DM. Subsequently, the Cytohubba of Cytoscape was used to predict hub gene. Shown as the upset Venn map (figure4, A ), we obtained 8 hub genes: IFIT3、OAS3、STAT1、MX2、IFI44L、DDX58、MX1、RSAD2. Their expression levels in six datasets were exhibited by heatmap (figure4, B). GeneMANIA database was utilized to operate co-expression analysis, trying to reveal the 8 hub genes` correlation (figure4, C). To understand the internal related mechanism of the hub genes, we applied GO and KEGG enrichment analysis again. The results (figure4, D-E) indicated the close association between the 8 hub genes and relative immune pathways. The top 3 high correlation pathways in the BP (biological process) are “defense response to virus”, “response to virus” and “type Ⅰ interferon signaling pathway” respectively. The top 3 high correlation pathways in MF (molecular function) are “GTP binding”, “double-stranded RNA binding” and “purine ribonucleoside binding”. Besides, the KEGG`s result turned out that the top 3 high correlation pathways were “Hepatitis”, “Influenza” and “Measles”. We further investigated the difference of 8 hub genes` expression level in each dataset, which was demonstrated by volcano maps. The volcano maps are put in figure S1.
Construction of a ceRNA network
MiRNA and LncRNA play an important role in regulating the protein coding genes. To better understand the internal relation between the expression of hub genes and the regulation of miRNA and LncRNA, we built a mRNA- miRNA- LncRNA ceRNA network by Starbase database and Power BI (https://powerbi. microsoft.com/zh-cn/) (figure5). It turned out that STAT1, DDX58, IFI44L, OAS3 and IFIT3 associated with quit a lot of RNA, which might imply they were crucial regulating genes.
Verification of analysis by weighted gene co-expression network analysis (WGCNA) of GSE1551 and GSE142807
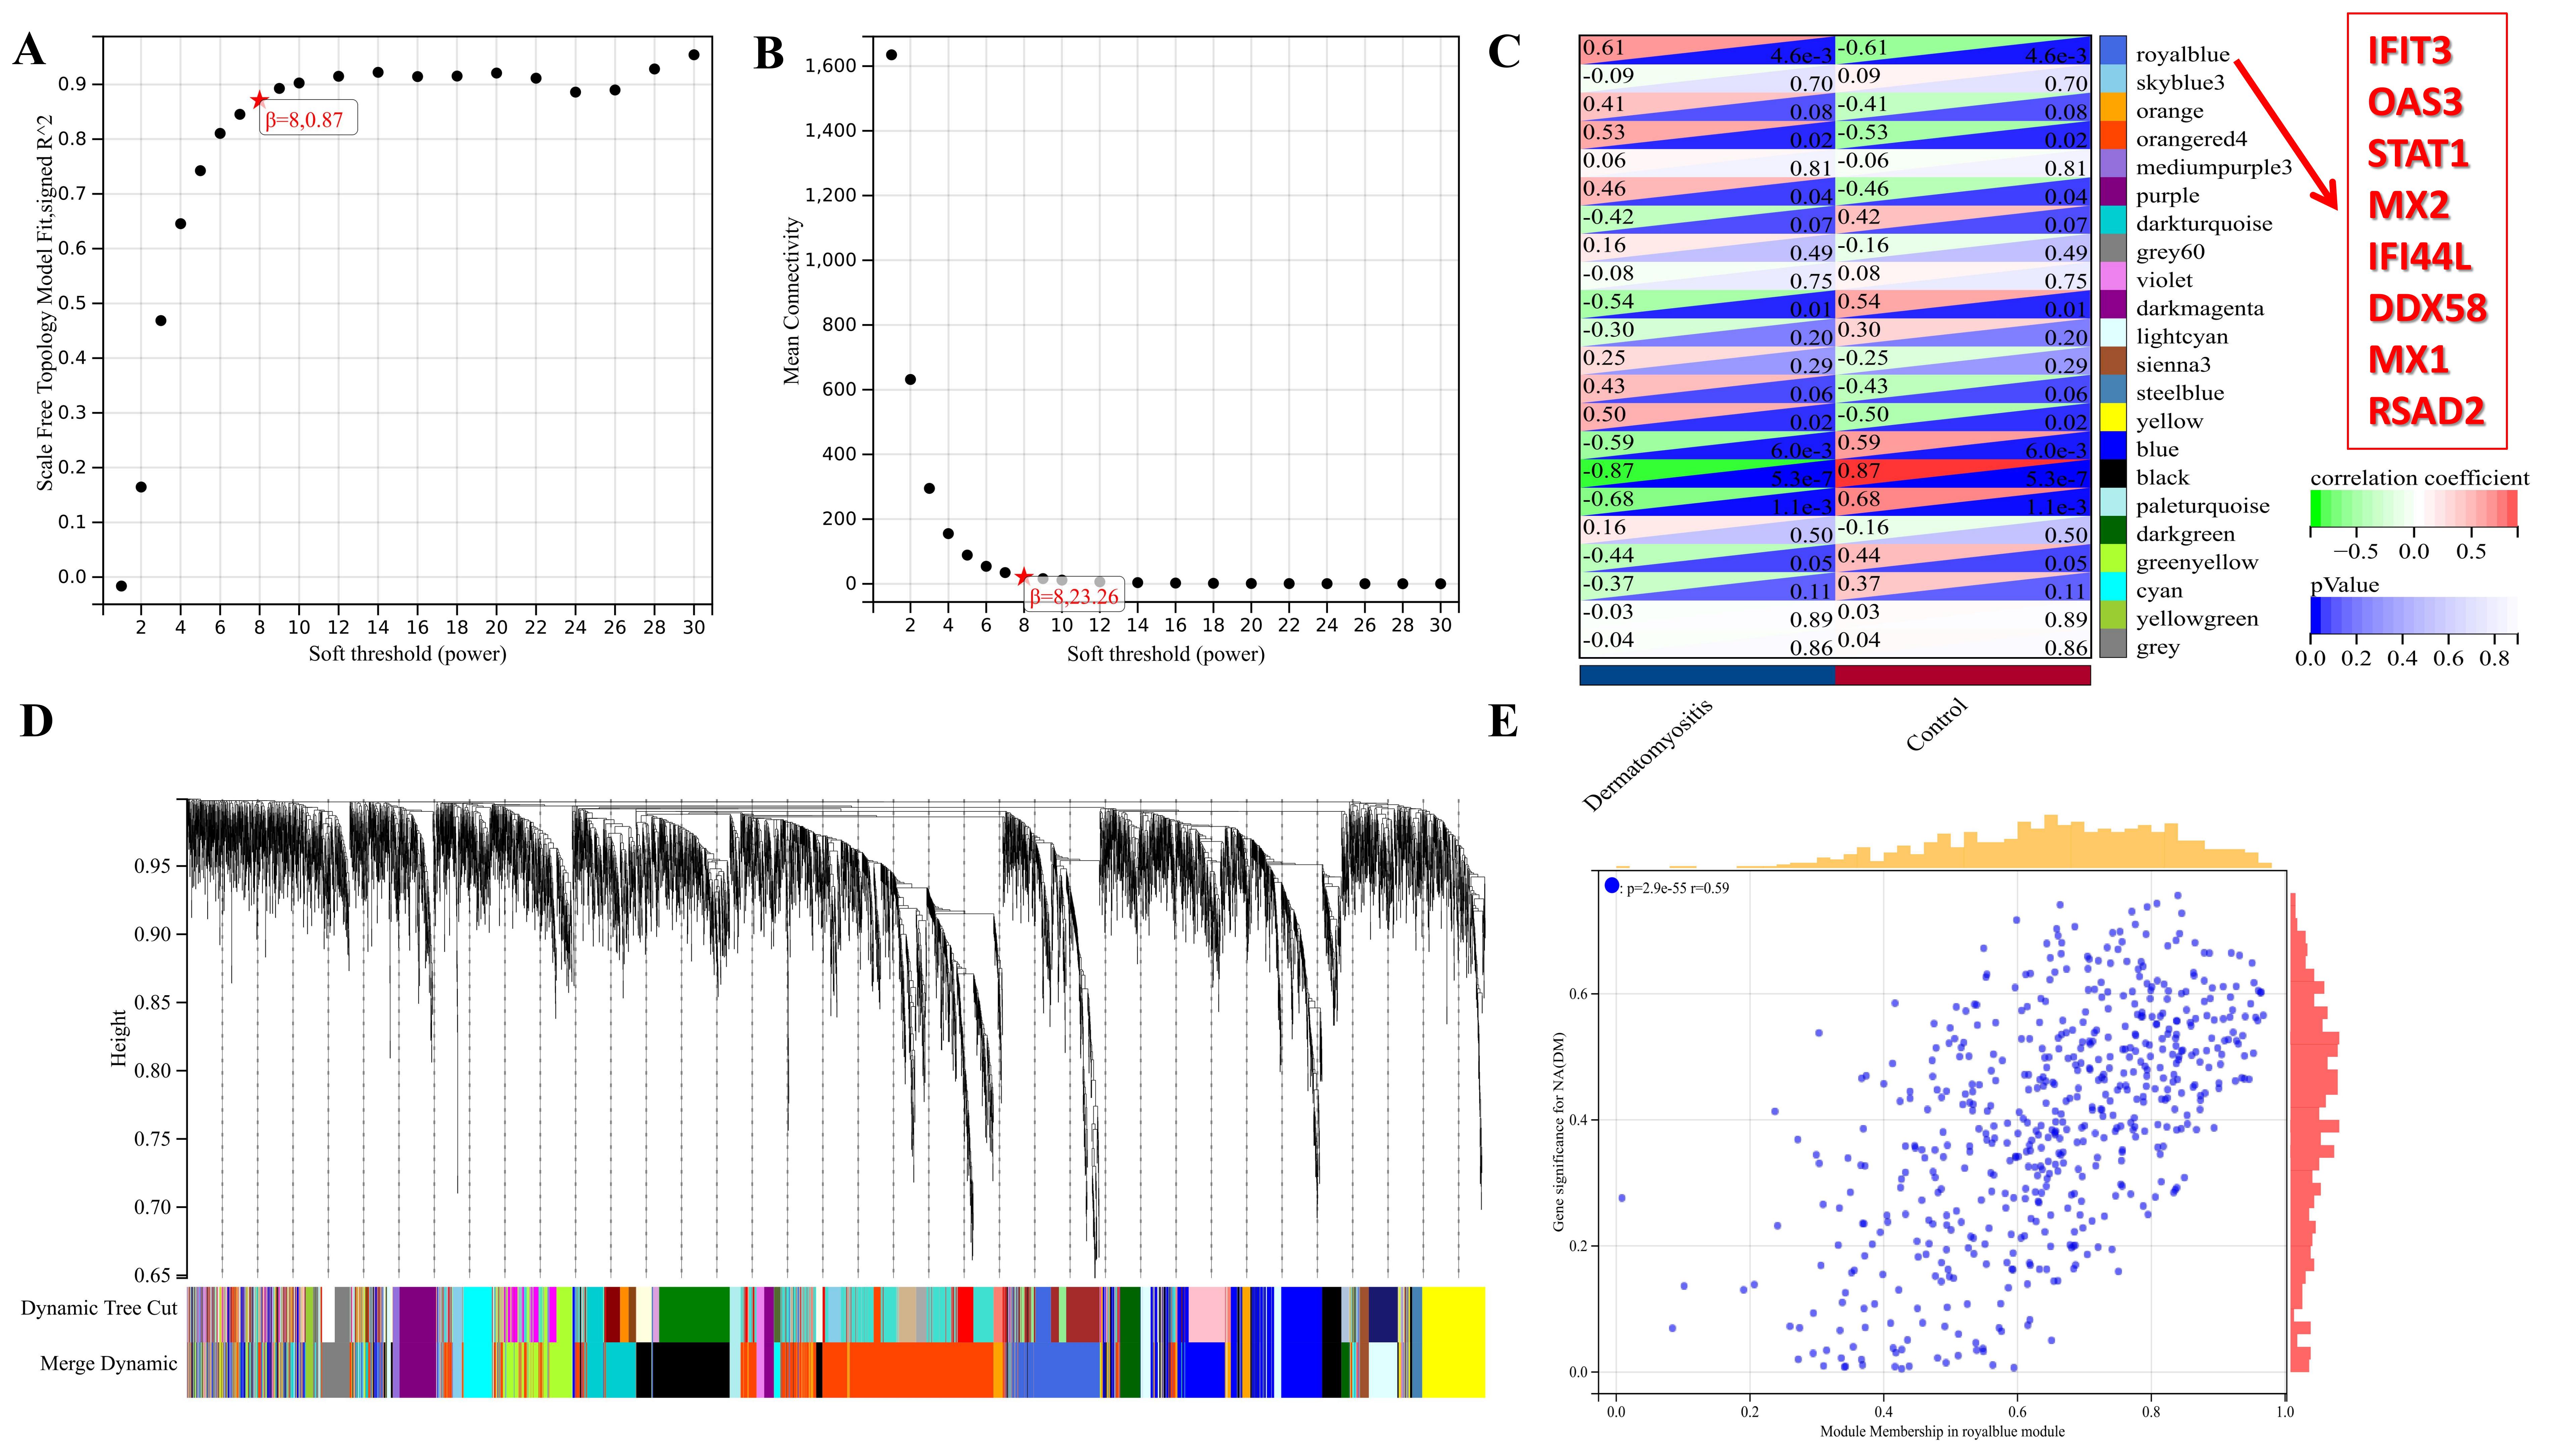
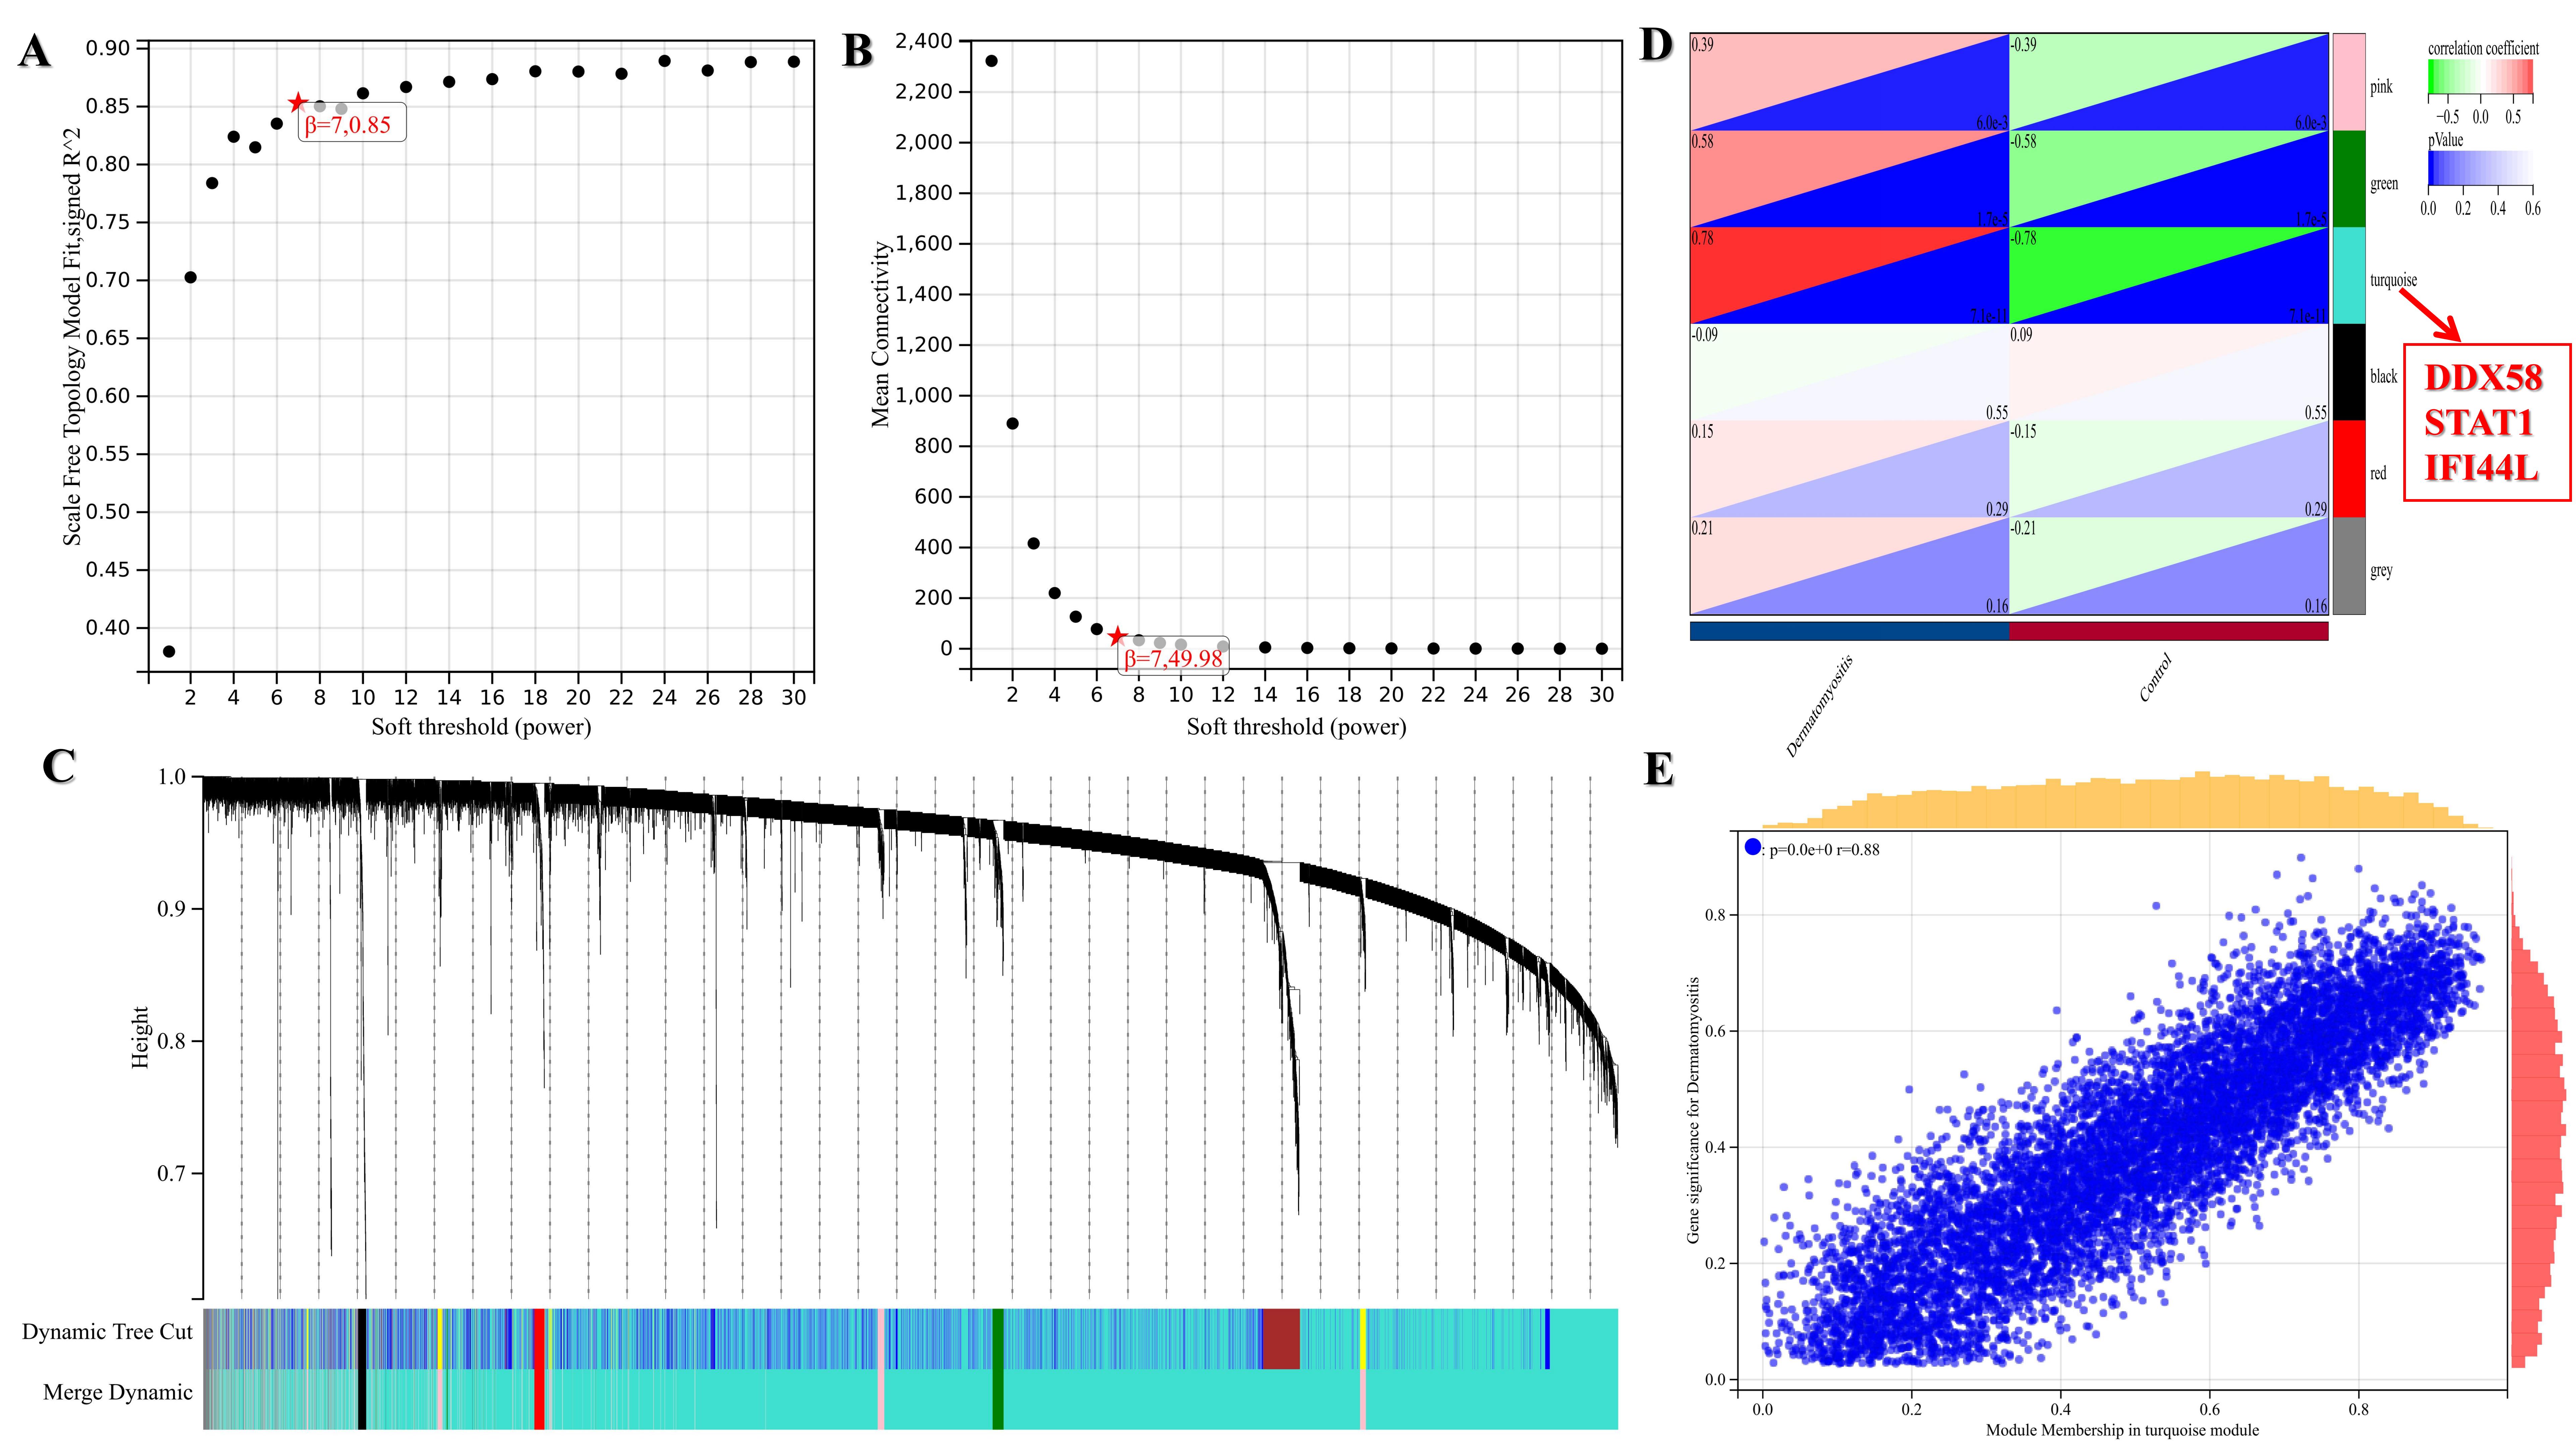
GSE1551 and GSE142807 datasets were selected to operate WGCNA`s verification. 22 modules were identified in GSE1551 (Figure S2, C) and 6 modules were identified in GSE142807 (Figure S3, C). In the eigengene adjacency heatmap, the red module represents the most positive correlation with occurrence of DM and the green module represents the most negative correlation with occurrence of DM. Analysis results of GSE1551 showed that the 8 hub genes all appeared in the “royalblue” module that is positively associated with the occurrence of DM (figure S2, D).According to the analysis results of GSE142807, the gene DDX58, STAT1 and IFI44L all appeared in the “turquoise” module that is positively related to the occurrence of DM (figure S3, D). The analysis results maps of GSE1551 and GSE142807 were put in Figure S2 and Figure S3 respectively. DDX58, STAT1 and IFI44L appeared in both datasets` analysis, which implied that they took up an important position.
Immune cell infiltration
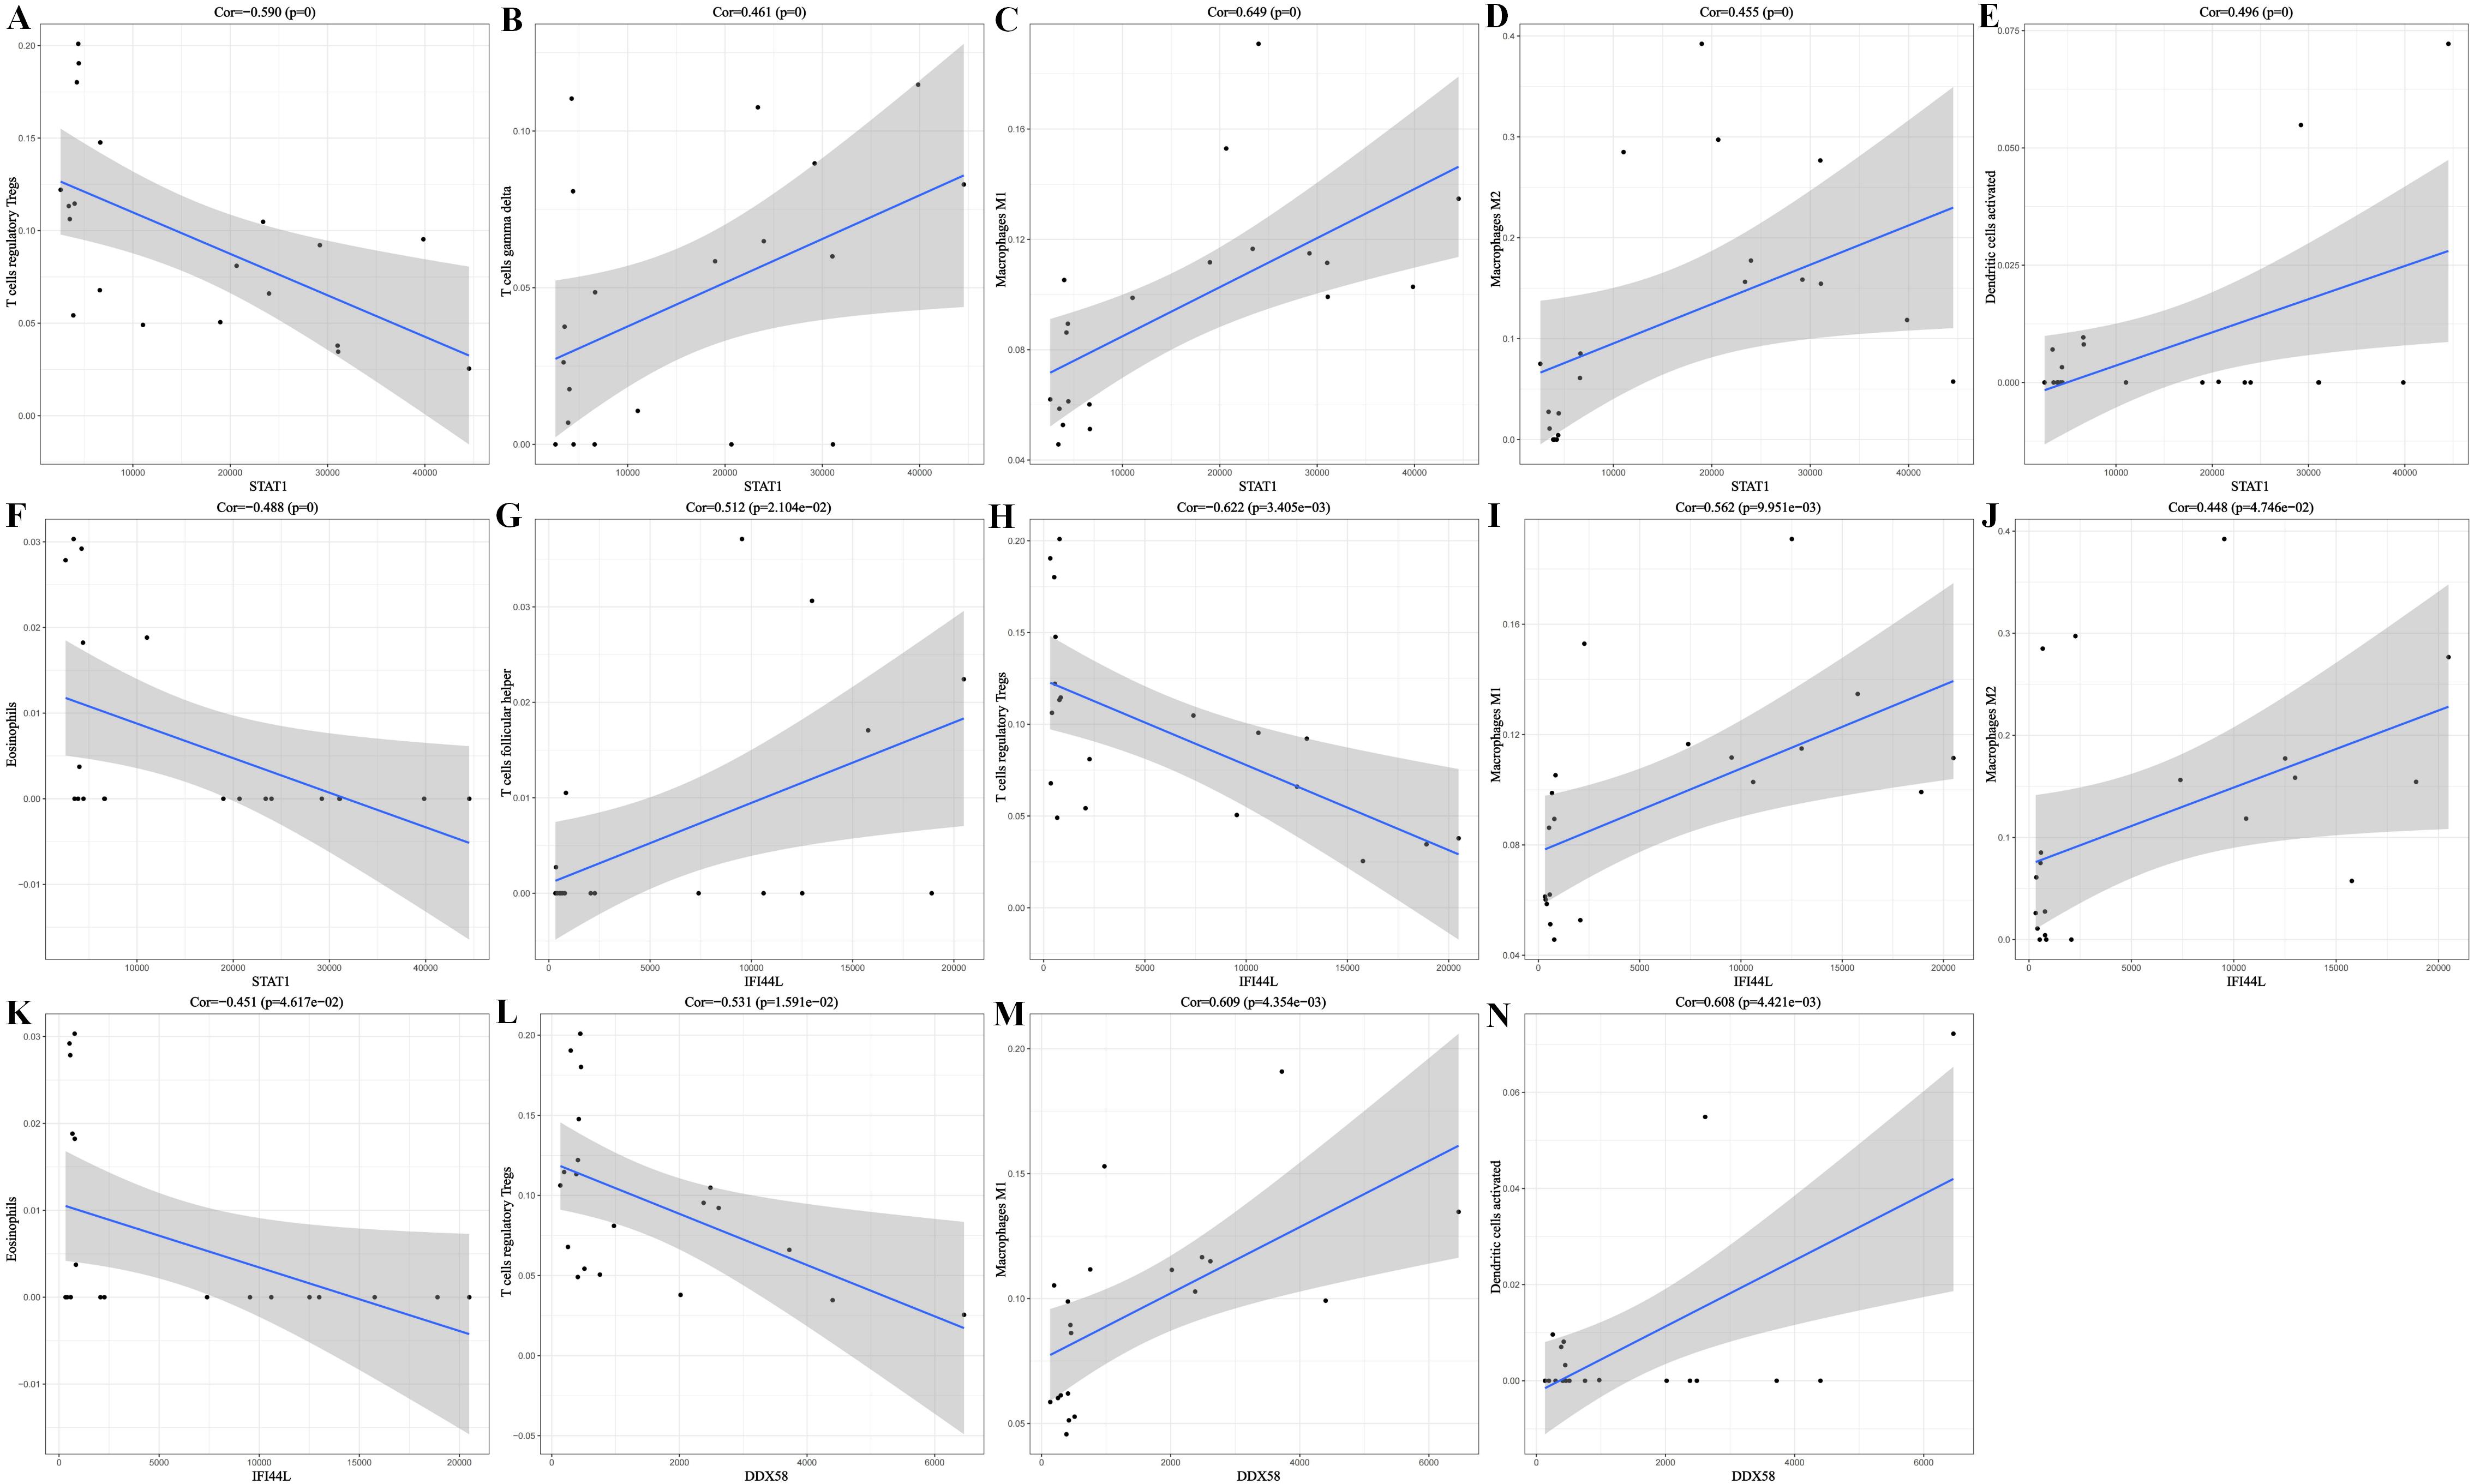
CIBERSORT software was used to operate immune cell infiltration assessment for GSE1551 dataset. According to the analysis result showed by heatmap and box plots (Figure6, A-B), T regulatory cells, Macrophage M0 and eosinophils associated significantly negative with the occurrence and progress of DM. While Macrophage M1 and Macrophage M2 correlated significantly positive with the occurrence and progress of DM. We also conducted Principal Component Analysis (PCA) between controls and DM groups (Figure6, C). The result indicated that DM groups had a different distribution pattern from the normal groups. Besides, each sample of DM distributed close to each other but away from the normal group. Not limited to the correlation between immune cell and DM, we also operated the correlation analysis between 22 types of immune cells, which was showed as picture (figure 6, D). It turned out that Macrophages M1 and Macrophages M2 correlated significantly positive with each other. Besides, B cells naive and B cells memory correlated significantly negative with each other. And Macrophages M0 and Macrophages M2 also correlate significantly negative with each other. Additionally, we further operated immunology analysis of each hub gene (STAT1, IFI44L, DDX58) to realize the correlation between each hub gene and the expression level of different types of immune cell. And the result was put in Figure S4.
Diagnosis significance of hub genes.
Aimed at exploring the clinical significance of three hub genes, the ROC analysis was conducted (Figure7, A-E). The result showed that each gene from the six datasets all had an AUC>0.85, which is indicative of a relatively good ability to predict the occurrence of DM. Besides, the STAT1 in five (except GSE46239) datasets all had an AUC >0.95, indicating that STAT1 had very excellent abilities in clinical predicting. And the AUC of the 3 hub genes` combination model was all equal to 1, indicating that the 3 genes combination model had extremely significant clinical value.
Identification of relative diseases.
The DisGeNET database was applied to identify the diseases associated with the expression of each hub gene. It turned out that Influenza is the disease associating strongest with the 3 hub genes, having the correlation index of 0.33, 0.3 and 0.4 for STAT1, IFI44L and DDX58 respectively. And several cancers (such as liver carcinoma, primary malignant neoplasm, neoplasms and malignant neoplasms) also took up a large part of the predicted diseases, among which the liver carcinoma associated closest with STAT1, having the biggest correlation index of 0.4. Besides, autoimmune diseases and Systemic Lupus Erythematosus also correlated with the 3 genes. The results were showed by the Table 1.
Identification of candidate drugs
We applied DSigDB on Enrichr database to explore the drugs that affect the expression of hub genes. The results revealed the relative drugs of each hub gene based on P value. And we obtained their overlapping drugs, which might affect the DM`s pathogenesis mechanism. We got 5 kinds of overlapping drugs, they are prenylamine HL60 UP, suloctidil HL60 UP, Tetradioxin CTD 00006848, estradiol CTD 00005920 and cyclosporin A CTD 00007121, in an order of increasing P value. And their P values were all smaller than 0.05, indicating their effective statistical significance. The results were demonstrated by the Table 2.