In aquatic environments, metals tend to sink into sedimentary beds, but under different redox conditions they might be released to the water column. Oxic and anoxic microcosm experiments were conducted using an automatic microcosm apparatus to investigate how redox potential (Eh) affects the release of rare earth elements (REEs) in an estuary sediment sample. Results indicated that REEs mobility increases in both oxic and anoxic conditions although the average amount of REEs mobilization was higher in oxic conditions than anoxic conditions. Lu and Sm were the most mobile elements while Ce showed the lowest amount of release. REEs release is influenced by a mix of controlling factors including dissolution of Fe-Mn oxyhydroxides, low pH condition, and increase in dissolved organic carbon (DOC) under anoxic condition. An increase in Eh caused a decreasing pH from 8.08 to 6.80 and increasing DOC from 18.93 to 425 mg/l which resulted in the release of REEs. Enrichment factors (EFs) revealed that Musa estuary is threatened with Ce, Dy, La, Nd, Pr, and Sm. The high ecotoxicology effects of soluble REEs calling for potential environmental risks in Musa estuary.
Research article
Redox-induced Mobilization of Rare Earth Elements in Musa Estuary Sediment, Southwest of Iran
https://doi.org/10.21203/rs.3.rs-164453/v1
This work is licensed under a CC BY 4.0 License
Version 1
posted
You are reading this latest preprint version
Anoxic
Oxic
Redox potential
Contamination
Rare earth elements
Release
Sediment
Rare earth elements (REEs) consist of 15 lanthanides (La-Lu), scandium (Sc), and yttrium (Y) (Prego et al., 2019; Romero-Freire et al., 2019). They are subdivided into two categories based on the ionic radius. Light rare earth elements (LREEs) with a larger ionic radius include La, Ce, Pr, Nd, Sm, and Eu and heavy rare earth elements (HREEs) with smaller ionic radius include Gd, Tb, Dy, Ho, Er, Tm, Yb, and Lu (Consani et al., 2020; Wang et al., 2019). They are used widely in many high-tech industrial processes. As a result, REEs have been discharging and transferring to aquatic ecosystems and food chains in recent years (Mihajlovic and Rinklebe, 2018).
Sediments serve as a major repository of REEs and also represent a potential secondary source for REEs (Trifuoggi et al., 2018). REEs mobility is controlled by environmental factors such as redox potential, pH, temperature, organic matter (OM), Fe, Mn, and Al contents (Edahbi et al., 2018; Mihajlovic et al., 2019). Soluble forms of REEs, unlike their insoluble forms, have shown high toxicity (Romero-Freire et al., 2018; Trifuoggi et al., 2018). Therefore the increasing release of REEs to the environment may have ecotoxicological effects on humans and other organisms.
Several studies around the world have been carried out on the influence of redox potential variation on the release of REEs in soils with different characteristics. For example, Cao et al. (2001) reported that by the decrease in Eh, REEs (La, Ce, Gd, and Y) were released. Similarly, in wetland soils, REEs were released under anoxic conditions (Davranche et al., 2011; Grybos et al., 2007). Mihajlovic et al. (2017) found that an increase in Eh enhanced the release of REEs in floodplain soil. Davranche et al. (2011) and Grybos et al. (2007) observed that dissolved organic matter plays a key role in the release of REEs, while Mihajlovic et al. (2017) reported Fe-Mn oxides are the major source of released REEs. Therefore REEs mobilization differs generally relying on the soil/sediment characteristics and water factors.
Musa estuary (latitude of 30° 15′ to 30° 32′ and longitude of 49° to 49° 20′) is located in the northwest of Persian Gulf (Keshavarzi et al., 2018). Petrochemical plants which are known to be a source of REEs (Kabata Pendias, 2010) are located to the north of this estuary. Marun and Amirkabir olefin units utilize cracking operations for the production of ethylene and propylene. REEs in the surrounding environment stem from zeolite and other catalysts which are widely used in cracking, as a common process, in petrochemical plants. (Kulkarni et al., 2006).
The recovery capacity of the Musa estuary is insignificant (Ravanbakhsh et al., 2020) as low water flushing time (3–5 y) causes the pollutants to have a long residence time in this area (Jaafarzadeh Haghighi Fard et al., 2017). Due to the high accumulation of OM due to the great volume of wastewater discharge and high productivity rate in the water body anoxic conditions may be favored, particularly in deeper zones of the area. On the other hand, part of the sediments are subjected to dissolved oxygen in tidal zones and shallow parts of the area. Also, sediments can be exposed to the atmospheric oxygen, e.g. under dredging and reclamation in the open air which lead oxic condition to be predominant.
Since there are sources of REEs contaminating the Musa estuary sediments and varying redox conditions, it is necessary to study the behavior of REEs in such environmental conditions. Besides, the impact of pre-definite redox conditions on the release of REEs in estuary sediments has not been assessed yet. Thus, this study aimed to investigate the effect of redox potential changes on the (im)mobilization of REEs in sediments in this region and to elucidate the biogeochemical mechanism of REEs release.
2.1 Sampling
The study area and sampling locations are shown in Fig. 1. Surface sediment samples were collected from 12 sampling sites in May 2017, by a Van Veen Grab. Subsamples were taken with a plastic spoon from the uppermost 20 cm in the middle part of the grab. Twelve samples were used to prepare a representative composite sample. The samples were kept in polyethylene bags and maintained at 4 °C and transported to the laboratory in a cool box. Two gallons of petrochemical effluent water were also collected. The containers were first washed with diluted hydrochloric acid and distilled water and then rinsed three times with estuary water before sampling.
2.2 Redox experiments
Water samples filtered using a filter paper (No. 41, Macherey-Nagel, Germany) and a vacuum pump to remove particulate particles, then used in wet-sieving and experiments. The sediment sample was sieved through a 2 mm and characterized for physicochemical properties. Then the samples were wet-sieved through a 63 μm sieve and used in the microcosm experiments. Sieved sediment samples were homogenized by hand mixing.
357 g of wet sediment (44% H2O, 200 g dry weight) and 2000 ml of estuary water were transferred to a glass vessel, sealed with an air-tight lid, and continuously stirred with a magnetic stirrer to achieve homogeneity. A 10:1 ratio (w/w) of water to dry sediment was examined according to Yu and Rinklebe (2011). Also, wet sediment was used in the microcosm experiments because the drying process would change the redox potential (Frémion et al., 2017; Kelderman and Osman, 2007). The vessel was wrapped with aluminum foil to protect algae growth and photo-oxidation (Rinklebe et al., 2016).
Oxic and anoxic experiments were carried out in an automated microcosm (Fig. 2). The system consists of a thermometer, a pH electrode, two platinum (Pt) electrodes coupled with a calomel reference electrode, inlet tubes for N2 gas and air, and an outlet that was submerged in water to prevent atmospheric oxygen diffuse into the microcosm.
In the anoxic experiment, sediments were subjected to a decrease in redox potential (Eh around -150 mV) to simulate natural anoxic conditions under organic matter degradation. To do so, N2 gas was injected into the microcosm. N2 gas was effective in purging oxygen. When the set potential is reached, the meter relay activates an air pump to hamper the redox potential decreasing below the set value. At low redox potentials, the airflow should be lower than approximately one bubble per second.
In the oxic experiment, sediments were subjected to an increase in redox potential (Eh around +200 mV). To achieve this, synthetic air was injected into microcosm to be indicative of the oxic condition under dredging and sanitation measures in practice. The air pump flow was regulated to 0.5-2.0 ml/min for slow oxidation of the suspension. When the suspension reached the proper oxidation level, the meter relay automatically turned off the air pump.
The pre-set Eh windows were maintained for 4 days. Because usually the redox potential became stabilized after 4 days (Miao et al., 2006). Subsequently, an amount of slurry (60 ml) was collected from the microcosm by a syringe at three levels of Eh windows: initial condition (after 1 h stirring the microcosm), -150, and +200 mV. The sediment/water ratio remained constant throughout the experiment.
The suspension was centrifuged for 15 min at 3000 rpm. The supernatant was immediately filtered into brown-glass borosilicate vials and acidified to pH < 2 with phosphoric acid (H3PO4) and kept at -20 °C for determination of dissolved organic carbon (DOC). The solid phase was kept in 15 ml polypropylene cryogenic vials at 4 °C until digestion.
2.3 Chemical analyses
As regards the physical and chemical properties of sediments affect the (im)mobilization of metals, so what contributed to a better comprehensive were measured. The loss on ignition (LOI), cation exchange capacity (CEC), and sediment pH were measured according to ASTM-D7348-08, USEPA-9081, and USEPA-9045D. A laser particle size analyzer (HORIBA, LA950) was used for grain size distribution. Major mineral phases in sediment and chemical components were identified by X-ray diffraction (XRD) and X-ray fluorescence (XRF) analyses (Philips, PW1480 and Philips, PW1800). DOC was measured using a TOC-analyzer (Shimadzu, TOC-V CP).
The pre-dried solid phase (40 °C), digested with aqua regia (HCl/ HNO3, 3:1 v/v). After digestion, the samples were filtered and diluted to a volume of 100 ml. Metals concentration (Fe, Mn, Al, and REEs) was analyzed using inductively coupled plasma mass spectrometry (ICP-MS, ELAN DRC-e, Perkin Elmer).
2.4 Quality assurance/quality control
For reliability of the results, blank samples were used and the digestions and measurements were carried out in triplicate. The relative standard deviation (RSD) between replicates was below 5%. All reagents were of ultra-pure quality (Merck) and all labware used was either new or pre-cleaned and acid-washed before utilization. Geological Sample of sediment standard MAG-1 (marine sediment) was used for quality assurance of the extraction and analysis efficiency. The comparison between the measured concentrations with the certified data is presented in Table 1. The recovery ranged from 88 to 103% depending on the studied element.
|
Element |
|
Certified |
Measured |
Recovery efficiency (%) |
|
Al |
% |
8.66 |
8.47 |
98.00 |
|
Fe |
|
4.58 |
4.47 |
98.00 |
|
Mn |
|
0.08 |
0.07 |
88.00 |
|
Ce |
mg kg-1 |
88.00 |
87.00 |
99.00 |
|
Dy |
|
5.20 |
4.86 |
93.00 |
|
Er |
|
3.00 |
2.84 |
95.00 |
|
Eu |
|
1.55 |
1.51 |
97.00 |
|
Gd |
|
5.80 |
5.89 |
102.00 |
|
La |
|
43.00 |
42.70 |
99.00 |
|
Lu |
|
0.40 |
0.38 |
95.00 |
|
Nd |
|
38.00 |
37.36 |
98.00 |
|
Pr |
|
9.30 |
9.54 |
103.00 |
|
Sm |
|
7.50 |
7.32 |
98.00 |
|
Tb |
|
0.96 |
0.90 |
94.00 |
|
Tm |
|
0.43 |
0.40 |
93.00 |
|
Yb |
|
2.60 |
2.42 |
93.00 |
2.5 Enrichment factor (EF) index
The enrichment factor (EF) was presented by Buat Menard and Chesselet (1979). It is a practical tool in estimating the level of anthropogenic contamination. EF is calculated according to the following equation:

where C is the concentration of REEs, Al was used to normalize the metal concentrations, and the mean earth’s crust was considered as background. The background metal concentrations (Al and REEs) used in this study were those reported by Taylor (1964). Enrichment intensity based on EF is given in Table 2.
|
EF |
Enrichment intensity |
|
< 2 |
Depletion to minimal enrichment |
|
2 - 5 |
Moderate enrichment |
|
5 - 20 |
Significant enrichment |
|
20 - 40 |
Very high enrichment |
|
> 40 |
Extreme enrichment |
3.1 Characterization of the studied sediment
Table 3 summarizes the main physicochemical characteristics in the studied sediment. XRD analyses demonstrated that the sample is principally composed of calcite, quartz, and dolomite, as well as XRF results, showed CaO, SiO2, and Al2O3 were the main compounds in this sediment.
|
Characteristics |
|
Value |
|
Sediment mineralogy (%) |
CaO |
30.9 |
|
SiO2 |
22 |
|
|
Al2O3 |
5.2 |
|
|
Fe2O3 |
4.2 |
|
|
MgO |
4.2 |
|
|
Particle size distribution (%) |
Sand |
0 |
|
Silt |
100 |
|
|
Clay |
0 |
|
|
pH |
|
8.14 |
|
LOI (%) |
|
27 |
|
CEC (meq/100 g dry sediment) |
|
35 |
|
Al (%) |
|
3.19 |
|
Fe (%) |
|
2.07 |
|
Mn (mg kg -1) |
|
377 |
According to grain size analyses the sample classified as silt, showing the dominance of fine texture. The sediment pH (pH of 8.14) was slightly alkaline which might be due to the presence of carbonate shells and the discharge of industrial effluents into the estuary. Percentage LOI was 27% in sediment. The high OM in the sediment is related to the high organic content of bituminous limestone and organisms remains and also may be due to the high level of petrochemical effluents. The CEC in the sediment was 35 meq/100 g. The high CEC can be related to the high organic content and the sediment fine texture (between 2-75 μm in diameter). Total Al, Fe, and Mn contents were 3.19%, 2.07%, and 377 mg kg -1, respectively.
As REEs effectively sorb onto sediment Al/Fe/Mn oxides, organic matter, and clay minerals in neutral/ basic waters (Mandal et al., 2019; Mihajlovic and Rinklebe, 2018) and the sorption capacity is a function of cation exchange capacity (Edahbi et al., 2018) the studied sediment expected to have a high capability for REEs sorption.
3.2 REEs concentration
The ΣREE, ΣLREE, and ΣHREE content in the studied sediment were 340.38 mg kg−1, 317.48 mg kg−1, and 22.90 mg kg−1, respectively. These values were considerably higher than those of the mean world sediments, Ligurian Sea sediment, Ipojuca River sediment, and Thailand Gulf sediment however they were quite similar to that reported for Poyang Lake sediment (Table 4). It can be inferred that REEs content in the sample are quite high and from anthropogenic sources.
|
Ligurian Sea |
Ipojuca River |
Poyang Lake |
Thailand Gulf |
Mean world sediments |
Musa estuary |
|
|
La |
4.95 |
29.86 |
60.90 |
22.00 |
28.30 |
62.00 (18%) |
|
Ce |
12.10 |
59.39 |
101.60 |
45.00 |
58.90 |
151.00 (44%) |
|
Pr |
1.76 |
11.47 |
12.70 |
4.70 |
6.52 |
19.66 (5.8%) |
|
Nd |
8.01 |
21.63 |
45.40 |
18.00 |
24.90 |
71.60 (21%) |
|
Sm |
2.58 |
4.27 |
9.40 |
3.50 |
4.23 |
11.78 (3.5%) |
|
Eu |
0.63 |
0.52 |
1.40 |
0.50 |
0.86 |
1.44 (0.4%) |
|
Gd |
2.92 |
3.03 |
7.80 |
2.60 |
3.61 |
10.17 (3.0%) |
|
Tb |
0.44 |
0.64 |
1.00 |
0.40 |
0.60 |
1.26 (0.4%) |
|
Dy |
2.31 |
0.88 |
5.50 |
2.20 |
3.61 |
6.17 (1.8%) |
|
Er |
0.98 |
0.58 |
3.00 |
1.10 |
2.19 |
2.96 (0.9%) |
|
Tm |
0.13 |
0.02 |
0.60 |
0.20 |
0.31 |
0.36 (0.1%) |
|
Yb |
0.76 |
0.41 |
3.20 |
1.20 |
2.14 |
1.70 (0.5%) |
|
Lu |
0.10 |
0.06 |
0.50 |
0.20 |
0.33 |
0.28 (0.1%) |
|
∑ REE |
37.67 |
132.76 |
253.00 |
101.60 |
136.50 |
340.38 |
|
∑ LREE |
30.03 |
127.14 |
231.40 |
93.70 |
123.71 |
317.48 |
|
∑ HREE |
7.64 |
5.62 |
21.60 |
7.90 |
12.79 |
22.90 |
|
∑ LREE / ∑ HREE |
3.93 |
22.62 |
10.71 |
11.86 |
9.67 |
13.86 |
|
Reference |
(Consani et al., 2020) |
(da Silva et al., 2018) |
(Wang et al., 2019) |
(Kritsananuwat et al., 2015) |
(Taylor and McLennan, 2001) |
Present study |
|
LREE: light rare earth elements, HREE: heavy rare earth elements, REE: total rare earth elements |
||||||
The LREEs content were much higher than that of HREEs in the sample (Table 4). More specifically the LREE/HREE ratio was 13.86. This LREEs enrichment pattern is found to occur in other catchment areas and the mean world sediments. This could be associated with that in the fluvial environments, the enrichment of LREEs has been related to high adsorption on clay minerals, whereas HREEs are reported to form stable soluble complexes (da Silva et al., 2018).
According to Table 4 Ce, Nd, and La were the abundant REEs, accounting for 44%, 21%, and 18% of the total REEs concentration, respectively. Among the HREEs, Gd had the highest concentration. These results are in agreement with those concentrations measured in other areas and the mean world sediments.
3.3 REEs enrichment in sediment by EF index
The enrichment factor (EF) of REEs was used for evaluating the effect of anthropogenic sources. The obtained EF values for various REEs were between minimal enrichment and significant enrichment. The maximum EF value belongs to Nd (EF = 6.59) and the minimum EF value is seen for Lu (EF = 1.44).
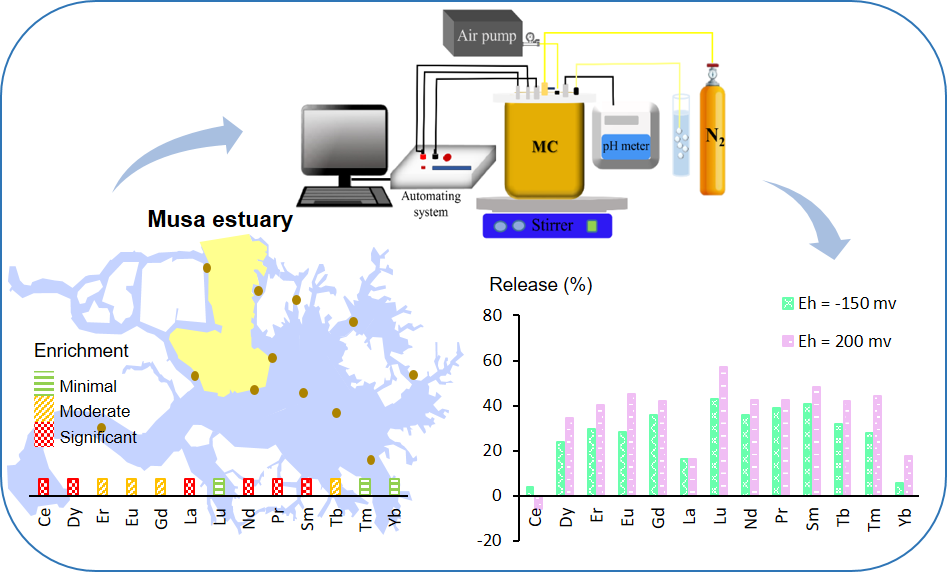
According to Fig. 3, Lu, Tm, and Yb are classified as minimal enrichment with EF values of 1.44, 1.93, and 1.46, respectively which suggests they may be due to crustal materials or natural weathering processes in sediment. Er, Eu, Gd, and Tb exhibit a moderate enrichment. For Ce, Dy, La, Nd, Pr, and Sm the enrichment factor is significant (5 < EF < 20) indicating the effect of anthropogenic sources in the area.
3.4 Dynamics of pH, DOC, and Fe-Mn under pre-set redox conditions
With Eh changes pH fluctuated. During oxic and anoxic incubations, pH decreased from the initial condition (8.08) to 6.66 under the anoxic condition and 6.80 under oxic condition (Fig. 4). The low pH in anoxic conditions might be related to the presence of CO2 and organic acids from microbial activities and decomposing OM (Shaheen et al., 2020, 2018). This probability is approved by the increase of DOC under anoxic/acidic conditions. Oxic condition also causes the reduction of pH, which could be related to the presence of protons (H+) (Mihajlovic et al., 2017; Zhu et al., 2018). Therefore, various mechanisms might have contributed to pH dynamics in the current experiment.
DOC increased from the initial value (18.93 mg/l) to 704.84 mg/l in the anoxic experiment and 425 mg/l in the oxic experiment (Fig. 5). During anoxic conditions, DOC increased which might have several possible explanations. The reductive dissolution of Fe-Mn oxyhydroxides made by anoxic conditions may dissolve organic carbon bound to Fe-Mn oxyhydroxides, production of dissolved organic metabolites during microbial activity, and reductive fermentation and hydrolysis of complex organic matter to DOC (Shaheen et al., 2016; Shaheen and Rinklebe, 2017). A decrease in DOC along with the increase in Eh is commonly observed (e.g., Beckers et al., 2019; Han et al., 2019). However, in this study during oxic experiment, the increase in Eh was accompanied by an increase in DOC value. The observed increase in DOC could be interpreted as being a result of organic matter desorption from solid phases (Grybos et al., 2009, 2007).
The lowest concentrations of Fe and Mn in sediment were measured in the anoxic experiment and they were highest in the oxic experiment (Fig. 6). Consequently, at high Eh the soluble Fe and Mn concentrations decreased, and conversely, at low Eh they increased. An increase in soluble Fe and Mn concentrations with decreases in redox potential suggests that reductive dissolution of Fe and Mn (hydr)oxides have occurred (Leyden et al., 2016). In addition, it might be due to the decrease in pH (Shaheen et al., 2017). High redox status would cause the precipitation of Fe3+, Mn3+, and Mn4+ oxides and a decrease in the concentration of soluble Fe and Mn (Antić-Mladenović et al., 2017a, 2017b).
3.5 Release dynamics of REEs under pre-set redox conditions
REEs released from sediment in both oxic and anoxic experiments expect for Ce in oxic condition (Fig. 7). The release of REEs under oxic conditions can be due to a decline in pH and an increase in DOC. Dissolution of Fe-Mn oxyhydroxides, low pH conditions, and increase in dissolved organic carbon (DOC) under anoxic conditions cause the mobilization of REEs to increase. Ce adsorbed to sediment in oxic condition. This is because the Ce4+ is formed and Ce4+ is removed from the solution to the sediment by scavenging onto sediment compounds (Suja et al., 2017). Similar observations were reported by other researchers (Cao et al., 2001; Davranche et al., 2011; Grybos et al., 2007; Mihajlovic et al., 2017).
The average amount of REEs mobilization in oxic condition was 39.40% and it was 27.86% in anoxic condition. All REEs released to a greater extent in oxic conditions than anoxic conditions except for La, which was released equally in both cases (16.1%). Lu and Sm are the most mobile elements while Ce has the lowest amount of release (Fig. 7). Since HREEs form soluble complexes more easily, they had higher mobility than LREEs (Duncan and Shaw, 2003; Mihajlovic and Rinklebe, 2018).
In practice, REEs release from sediments may be expected whenever these sediments are subjected to oxygen in air, e.g. under dredging operations and sediment reclamation in the open air (such as land farming) or when they are subjected to oxygen-free conditions in the bottom of the aquatic environment due to the accumulation of organic matter.
This study aimed to investigate the impact of pre-definite redox conditions on REEs mobility and dynamics. Results revealed that redox fluctuation significantly affected the mobilization of REEs. The average amount of REEs mobilization in oxic condition was 39.4% and it was 27.9% in anoxic condition. The high potential mobility of REEs would raise environmental risk and health issues in the studied area. This study provides a better realization of biogeochemical processes in Musa estuary for future environmental management in the area. However, future research is required to concentrate on the methods decreasing the mobilization of REEs under dynamic redox conditions in Musa estuary sediments.
CEC: Cation exchange capacity; DOC: Dissolved organic carbon; EF: Enrichment factor; Eh: Redox potential; HREEs: Heavy rare earth elements; LOI: Loss on ignition; LREEs: Light rare earth elements; OM: Organic matter; REEs: Rare earth elements; RSD: Relative standard deviation; XRD: X-ray diffraction; XRF: X-ray fluorescence
Availability of data and material
The datasets supporting the conclusions of this article are currently not available in any public repository. However, data are available from the corresponding author upon reasonable request.
Competing interests
The authors declare that they have no competing interest.
Funding
This work was supported by environmental research laboratory, Iran University of Science and Technology.
Authors' contributions
RM: Conceptualization, Methodology, Investigation, Writing -original draft, Visualization. MS: Conceptualization, Resources, Writing - review & editing, Supervision. AK: Conceptualization, Methodology, Writing - review & editing, Supervision. All authors read and approved the final manuscript.
Authors' information
RM is a researcher at environmental research laboratory, school of civil engineering of Iran University of Science and Technology. MS is a Professor of environmental engineering at school of civil engineering, Iran University of science and technology. AK is a Professor at school of environment, University of Tehran and director of many national projects on urban pollution.
Acknowledgements
We thank Ms. Sedigheh Mohamadi for her great assistance in field work and sampling, some sample preparation and handling and manuscript writing.
- Antić-Mladenović, S., Frohne, T., Kresović, M., Stärk, H.J., Savić, D., Ličina, V., Rinklebe, J., 2017a. Redox-controlled release dynamics of thallium in periodically flooded arable soil. Chemosphere 178, 268–276. https://doi.org/10.1016/j.chemosphere.2017.03.060
- Antić-Mladenović, S., Frohne, T., Kresović, M., Stärk, H.J., Tomić, Z., Ličina, V., Rinklebe, J., 2017b. Biogeochemistry of Ni and Pb in a periodically flooded arable soil: fractionation and redox-induced (im)mobilization. J. Environ. Manage. 186, 141–150. https://doi.org/10.1016/j.jenvman.2016.06.005
- Beckers, F., Mothes, S., Abrigata, J., Zhao, J., Gao, Y., Rinklebe, J., 2019. Mobilization of mercury species under dynamic laboratory redox conditions in a contaminated floodplain soil as affected by biochar and sugar beet factory lime. Sci. Total Environ. 672, 604–617. https://doi.org/10.1016/j.scitotenv.2019.03.401
- Buat Menard, P., Chesselet, R., 1979. Variable influence of the atmospheric flux on the trace metal chemistry of oceanic suspended matter. Earth Planet. Sci. Lett. 42, 399–411. https://doi.org/10.1016/0012-821X(79)90049-9
- Cao, X., Chen, Y., Wang, X., Deng, X., 2001. Effects of redox potential and pH value on the release of rare earth elements from soil. Chemosphere 44, 655–661. https://doi.org/10.1016/S0045-6535(00)00492-6
- Consani, S., Cutroneo, L., Carbone, C., Capello, M., 2020. Baseline of distribution and origin of Rare Earth Elements in marine sediment of the coastal area of the Eastern Gulf of Tigullio (Ligurian Sea, North-West Italy). Mar. Pollut. Bull. 155. https://doi.org/10.1016/j.marpolbul.2020.111145
- da Silva, Yuri Jacques Agra Bezerra, do Nascimento, C.W.A., da Silva, Ygor Jacques Agra Bezerra, Amorim, F.F., Cantalice, J.R.B., Singh, V.P., Collins, A.L., 2018. Bed and suspended sediment-associated rare earth element concentrations and fluxes in a polluted Brazilian river system. Environ. Sci. Pollut. Res. 25, 34426–34437. https://doi.org/10.1007/s11356-018-3357-4
- Davranche, M., Grybos, M., Gruau, G., Pédrot, M., Dia, A., Marsac, R., 2011. Rare earth element patterns: A tool for identifying trace metal sources during wetland soil reduction. Chem. Geol. 284, 127–137. https://doi.org/10.1016/j.chemgeo.2011.02.014
- Duncan, T., Shaw, T.J., 2003. The Mobility of Rare Earth Elements and Redox Sensitive Elements in the Groundwater/Seawater Mixing Zone of a Shallow Coastal Aquifer. Aquat. Geochemistry 9, 233–255. https://doi.org/10.1023/B:AQUA.0000022956.20338.26
- Edahbi, M., Plante, B., Benzaazoua, M., Ward, M., Pelletier, M., 2018. Mobility of rare earth elements in mine drainage: Influence of iron oxides, carbonates, and phosphates. Chemosphere 199, 647–654. https://doi.org/10.1016/j.chemosphere.2018.02.054
- Frémion, F., Mourier, B., Courtin Nomade, A., Lenain, J.F., Annouri, A., Fondanèche, P., Hak, T., Bordas, F., 2017. Key parameters influencing metallic element mobility associated with sediments in a daily-managed reservoir. Sci. Total Environ. 605–606, 666–676. https://doi.org/10.1016/j.scitotenv.2017.06.236
- Grybos, M., Davranche, M., Gruau, G., Petitjean, P., 2007. Is trace metal release in wetland soils controlled by organic matter mobility or Fe-oxyhydroxides reduction? J. Colloid Interface Sci. 314, 490–501. https://doi.org/10.1016/j.jcis.2007.04.062
- Grybos, M., Davranche, M., Gruau, G., Petitjean, P., Pédrot, M., 2009. Increasing pH drives organic matter solubilization from wetland soils under reducing conditions. Geoderma 154, 13–19. https://doi.org/10.1016/j.geoderma.2009.09.001
- Han, Y.S., Park, J.H., Kim, S.J., Jeong, H.Y., Ahn, J.S., 2019. Redox transformation of soil minerals and arsenic in arsenic-contaminated soil under cycling redox conditions. J. Hazard. Mater. 378, 120745. https://doi.org/10.1016/j.jhazmat.2019.120745
- Jaafarzadeh Haghighi Fard, N., Zare Javid, A., Ravanbakhsh, M., Ramezani, Z., Ahmadi, M., Ahmadi Angali, K., Ardeshirzadeh, S., 2017. Determination of nickel and thallium concentration in Cynoglossus arel fish in Musa Estuary, Persian Gulf, Iran. Environ. Sci. Pollut. Res. 24, 2936–2945. https://doi.org/10.1007/s11356-016-8055-5
- Kabata Pendias, A., 2010. Trace elements in soils and plants, 4th ed. CRC Press, Boca Raton. https://doi.org/10.1201/b10158
- Kelderman, P., Osman, A.A., 2007. Effect of redox potential on heavy metal binding forms in polluted canal sediments in Delft (The Netherlands). Water Res. 41, 4251–4261. https://doi.org/10.1016/j.watres.2007.05.058
- Keshavarzi, B., Hassanaghaei, M., Moore, F., Rastegari Mehr, M., Soltanian, S., Lahijanzadeh, A.R., Sorooshian, A., 2018. Heavy metal contamination and health risk assessment in three commercial fish species in the Persian gulf. Mar. Pollut. Bull. 129, 245–252. https://doi.org/10.1016/j.marpolbul.2018.02.032
- Kritsananuwat, R., Sahoo, S.K., Fukushi, M., Chanyotha, S., 2015. Distribution of rare earth elements, thorium and uranium in Gulf of Thailand’s sediments. Environ. Earth Sci. 73, 3361–3374. https://doi.org/10.1007/s12665-014-3624-8
- Kulkarni, P., Chellam, S., Fraser, M.P., 2006. Lanthanum and lanthanides in atmospheric fine particles and their apportionment to refinery and petrochemical operations in Houston, TX. Atmos. Environ. 40, 508–520. https://doi.org/10.1016/j.atmosenv.2005.09.063
- Leyden, E., Cook, F., Hamilton, B., Zammit, B., Barnett, L., Lush, A.M., Stone, D., Mosley, L., 2016. Near shore groundwater acidification during and after a hydrological drought in the Lower Lakes, South Australia. J. Contam. Hydrol. 189, 44–57. https://doi.org/10.1016/j.jconhyd.2016.03.008
- Mandal, S.K., Ray, R., González, A.G., Mavromatis, V., Pokrovsky, O.S., Jana, T.K., 2019. State of rare earth elements in the sediment and their bioaccumulation by mangroves: a case study in pristine islands of Indian Sundarban. Environ. Sci. Pollut. Res. 26, 9146–9160. https://doi.org/10.1007/s11356-019-04222-1
- Miao, S., DeLaune, R.D., Jugsujinda, A., 2006. Influence of sediment redox conditions on release/solubility of metals and nutrients in a Louisiana Mississippi River deltaic plain freshwater Lake. Sci. Total Environ. 371, 334–343. https://doi.org/10.1016/j.scitotenv.2006.07.027
- Mihajlovic, J., Bauriegel, A., Stärk, H.-J., Roßkopf, N., Zeitz, J., Milbert, G., Rinklebe, J., 2019. Rare earth elements in soil profiles of various ecosystems across Germany. Appl. Geochemistry 102, 197–217. https://doi.org/10.1016/j.apgeochem.2019.02.002
- Mihajlovic, J., Rinklebe, J., 2018. Rare earth elements in German soils - A review. Chemosphere 205, 514–523. https://doi.org/10.1016/j.chemosphere.2018.04.059
- Mihajlovic, J., Stärk, H.J., Rinklebe, J., 2017. Rare earth elements and their release dynamics under pre-definite redox conditions in a floodplain soil. Chemosphere 181, 313–319. https://doi.org/10.1016/j.chemosphere.2017.04.036
- Prego, R., Brito, P., Álvarez-Vázquez, M.Á., Caetano, M., 2019. Lanthanides and yttrium in the sediments of the lower Minho River (NW Iberian Peninsula): imprint of tributaries. J. Soils Sediments 19, 2558–2569. https://doi.org/10.1007/s11368-019-02271-0
- Ravanbakhsh, M., Zare Javid, A., Hadi, M., Jaafarzadeh Haghighi Fard, N., 2020. Heavy metals risk assessment in fish species (Johnius Belangerii (C) and Cynoglossus Arel) in Musa Estuary, Persian Gulf. Environ. Res. 188, 109560. https://doi.org/10.1016/j.envres.2020.109560
- Rinklebe, J., Antić Mladenović, S., Frohne, T., Stärk, H.J., Tomić, Z., Ličina, V., 2016. Nickel in a serpentine-enriched fluvisol: redox affected dynamics and binding forms. Geoderma 263, 203–214. https://doi.org/10.1016/j.geoderma.2015.09.004
- Romero-Freire, A., Minguez, L., Pelletier, M., Cayer, A., Caillet, C., Devin, S., Gross, E.M., Guérold, F., Pain-Devin, S., Vignati, D.A.L., Giamberini, L., 2018. Assessment of baseline ecotoxicity of sediments from a prospective mining area enriched in light rare earth elements. Sci. Total Environ. 612, 831–839. https://doi.org/10.1016/j.scitotenv.2017.08.128
- Romero-Freire, Turlin, André-Mayer, Pelletier, Cayer, Giamberini, 2019. Biogeochemical Cycle of Lanthanides in a Light Rare Earth Element-Enriched Geological Area (Quebec, Canada). Minerals 9, 573. https://doi.org/10.3390/min9100573
- Shaheen, S.M., Ali, R.A., Abowaly, M.E., Rabie, A.E.-M.A., El Abbasy, N.E., Rinklebe, J., 2018. Assessing the mobilization of As, Cr, Mo, and Se in Egyptian lacustrine and calcareous soils using sequential extraction and biogeochemical microcosm techniques. J. Geochemical Explor. 191, 28–42. https://doi.org/10.1016/j.gexplo.2018.05.003
- Shaheen, S.M., El-Naggar, A., Antoniadis, V., Moghanm, F.S., Zhang, Z., Tsang, D.C.W., Ok, Y.S., Rinklebe, J., 2020. Release of toxic elements in fishpond sediments under dynamic redox conditions: Assessing the potential environmental risk for a safe management of fisheries systems and degraded waterlogged sediments. J. Environ. Manage. 255. https://doi.org/10.1016/j.jenvman.2019.109778
- Shaheen, S.M., Frohne, T., White, J.R., DeLaune, R.D., Rinklebe, J., 2017. Redox-induced mobilization of copper, selenium, and zinc in deltaic soils originating from Mississippi (U.S.A.) and Nile (Egypt) River Deltas: a better understanding of biogeochemical processes for safe environmental management. J. Environ. Manage. 186, 131–140. https://doi.org/10.1016/j.jenvman.2016.05.032
- Shaheen, S.M., Rinklebe, J., 2017. Sugar beet factory lime affects the mobilization of Cd, Co, Cr, Cu, Mo, Ni, Pb, and Zn under dynamic redox conditions in a contaminated floodplain soil. J. Environ. Manage. 186, 253–260. https://doi.org/10.1016/j.jenvman.2016.07.060
- Shaheen, S.M., Rinklebe, J., Frohne, T., White, J.R., DeLaune, R.D., 2016. Redox effects on release kinetics of arsenic, cadmium, cobalt, and vanadium in Wax Lake Deltaic freshwater marsh soils. Chemosphere 150, 740–748. https://doi.org/10.1016/j.chemosphere.2015.12.043
- Suja, S., Fernandes, L.L., Rao, V.P., 2017. Distribution and fractionation of rare earth elements and Yttrium in suspended and bottom sediments of the Kali estuary, western India. Environ. Earth Sci. 76, 174. https://doi.org/10.1007/s12665-017-6497-9
- Taylor, S.R., 1964. Abundance of chemical elements in the continental crust: a new table. Geochim. Cosmochim. Acta 28, 1273–1285. https://doi.org/10.1016/0016-7037(64)90129-2
- Taylor, S.R., McLennan, S.M., 2001. Chemical composition and element distribution in the earth’s crust. Encycl. Phys. Sci. Technol. https://doi.org/10.1016/b0-12-227410-5/00097-1
- Trifuoggi, M., Donadio, C., Ferrara, L., Stanislao, C., Toscanesi, M., Arienzo, M., 2018. Levels of pollution of rare earth elements in the surface sediments from the Gulf of Pozzuoli (Campania, Italy). Mar. Pollut. Bull. 136, 374–384. https://doi.org/10.1016/j.marpolbul.2018.09.034
- Wang, L., Han, X., Liang, T., Guo, Q., Li, J., Dai, L., Ding, S., 2019. Discrimination of rare earth element geochemistry and co-occurrence in sediment from Poyang Lake, the largest freshwater lake in China. Chemosphere 217, 851–857. https://doi.org/10.1016/j.chemosphere.2018.11.060
- Yu, K., Rinklebe, J., 2011. Advancement in soil microcosm apparatus for biogeochemical research. Ecol. Eng. 37, 2071–2075. https://doi.org/10.1016/j.ecoleng.2011.08.017
- Zhu, W., Song, Y., Adediran, G.A., Jiang, T., Reis, A.T., Pereira, E., Skyllberg, U., Björn, E., 2018. Mercury transformations in resuspended contaminated sediment controlled by redox conditions, chemical speciation and sources of organic matter. Geochim. Cosmochim. Acta 220, 158–179. https://doi.org/10.1016/j.gca.2017.09.045