3.1 Preparation and characterization
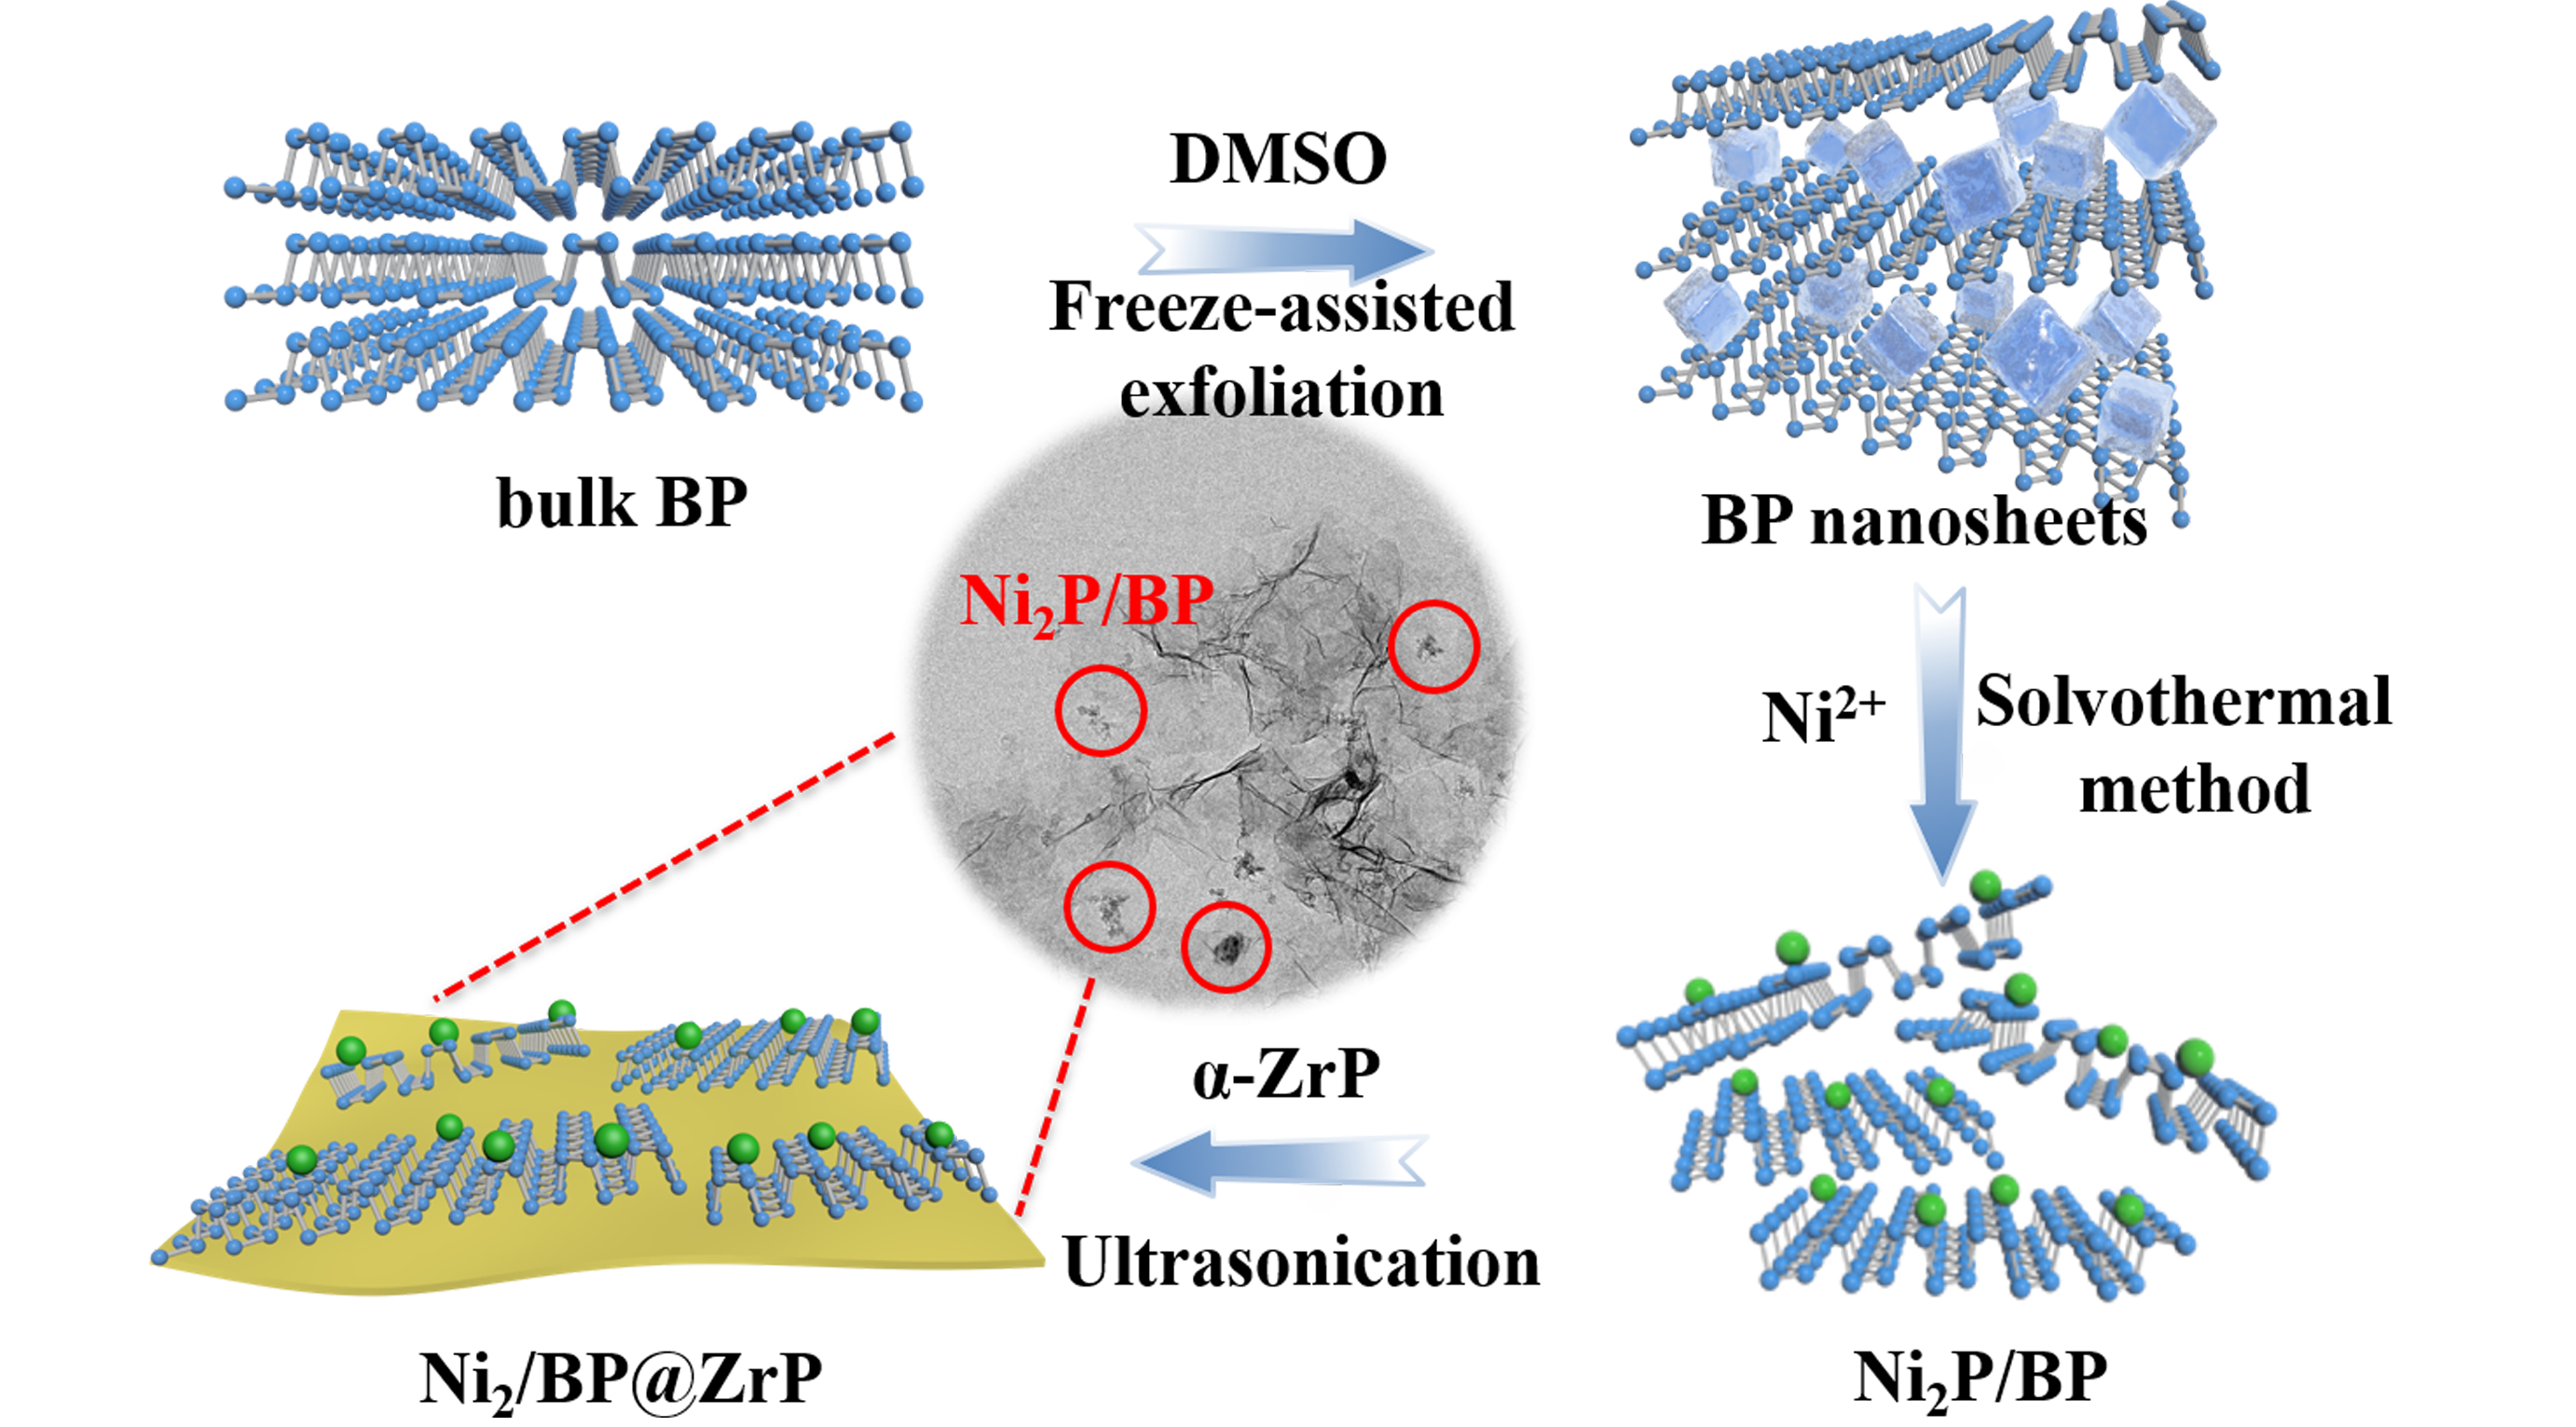
Figure 1 schematically illustrates the freeze-assisted exfoliation of bulk BP and the preparation of a novel Ni2P/BP@ZrP catalyst. In detail, BP nanosheets can be achieved by the freeze-assisted exfoliation method. When BP crystal dispersion containing DMSO solvent was placed in a low temperature environment, the intercalated DMSO liquid would be frozen and turned out to be DMSO ice with enlarged volume, leading to increase in layer space, weakening the interlayer van der Waals forces, and further realizing the exfoliation of the bulk BP by ultrasonication. Compared with other conventional exfoliation methods such as ice-bath sonication and tip-sonication [19,34], this novel exfoliation strategy combining freezing and ultrasonication can not only achieve a high yield of 65% of bulk BP, but also make exfoliation process less time-consuming. In the next step, to anchor the Ni2P nanoparticles onto the BP nanosheets, nickel (II) salt was added into the two-dimensional BP nanosheets suspension in anhydrous DMF and underwent solvothermal reaction, resulting in the Ni2P nanoparticles grown in situ on the exterior surface of BP nanosheets, so Ni2P/BP hybrid materials were produced. Thereafter, to further improve its stability, the Ni2P/BP nanosheets and α-ZrP dispersed in DMF solution were mixed to generate a precipitate, denoted as Ni2P/BP@ZrP.
After exfoliation, the presence of few-layer BP can be confirmed by AFM, the results are depicted in Figure 2. The measured heights of 3.8 and 3.7 nm (Figure 2a and Figure 2b) correspond to few-layer BP nanosheets with about 7 layers. Based on statistical AFM analysis (Figure 2c), the average thickness of BP nanosheets is about 4.59 nm, directly testifying that few-layer BP nanosheets with 7-9 layers can be manufactured by the freeze-assisted exfoliation method. To the best of our knowledge, the surface tension of organic solvent plays an important role in liquid exfoliation process, which determines that the energy to realize exfoliation should be balanced by the strong interaction between solvent and 2D materials [35,36]. According to previous study of BP exfoliation, a series of organic solvent such as NMP, DMF, DMSO, and IPA were employed to test the quality of the exfoliated BP nanosheets to find the suitable solvent. Out of them, DMSO with high surface tension possesses proper surface energy close to that of BP [37,38]. Thus, it can be reasonably predicted that DMSO solvent for BP liquid phase exfoliation will effectively attain more BP nanosheets.
In the BP exfoliation process, it is expectable to expose more lone pair electrons, resulting in BP nanosheets with a higher reduction activity. According to the previous density functional theory study, the energy level of the defect occupation of Ni is -5.98 eV, lower than that of adsorption of Ni2+ on BP surface (-4.24 eV) [39,40]. Therefore, Ni2+ can be easily reduced to Ni atoms at the defects and edges of BP nanosheets, and then probably bond with adjacent P atoms to form Ni2P species.
The XRD pattern in Figure 3a shows that no crystalline impurity reflections for BP crystals were detected, indicating the red phosphorus has been completely converted to BP after mineralization. The characteristic peaks of the bulk BP prepared by mineralization are in accordance with JCPDS card No.73-1358 [41]. XRD pattern of Ni2P/BP indicates that the peaks at 40.76°, 44.65°, and 47.34° are indexed to (111), (021), and (210) planes of hexagonal Ni2P (PDF # 65-3544), respectively [34], which demonstrates that Ni2P nanoparticles can be successfully formed by the solvothermal method. Besides, compared with the (040) plane of bulk BP, the peak intensity of (111) plane became stronger after Ni2P being anchored on BP nanosheets. This phenomenon reveals that van der Waals interaction between the adjacent layers of BP nanosheets has been destroyed, which makes the peak of (040) plane parallel to the layered structure less intense than that of (111) plane, confirming that DMSO ice-assisted exfoliation indeed enlarged the interlayer spacing of BP [42]. At the same time, Ni2P anchored on BP nanosheets could inhibit the restacking of BP nanosheets. For the Ni2P/BP@ZrP composite, the peak intensity of the BP nanosheets is reduced, and no obvious diffraction peaks related to Ni2P are detected, possibly due to the small amount of Ni2P/BP highly dispersed on the ZrP support.
The isotherm of N2 physisorption and pore size distribution of the catalyst are presented in Figure 3b. According to IUPAC classification, the isotherm of Ni2P/BP@ZrP displays the type Ⅳ curve with H3-type hysteresis loop corresponding to the stacking of flake catalysts, which is a characteristic of mesoporous materials. The specific surface area of Ni2P/BP@ZrP nanosheets is 142.6 m2·g−1.
In order to acquire better confirmation on the presence of few-layer BP, Raman spectroscopy was also conducted (Figure S3). The peaks observed at 361, 438, and 466cm−1 can be attributed to , , and modes of the bulk BP, respectively, which are identically consisted with the previous literature [43]. Compared to bulk BP, the three characteristic peaks of the BP nanosheets at about 360.7, 436.7, and 464.4cm−1, corresponding to , and modes, respectively, all exhibit noticeable blue-shift, meaning that the thickness of the bulk BP has been obviously reduced and the few-layer BP has been produced after freeze-assisted exfoliation [44]. These results are in good agreement with those of AFM mentioned above. After Ni2P was anchored on the BP nanosheets, the three peaks related to the vibration modes of Ni2P/BP@ZrP shift to lower wavenumber due to vibration inhibition, which is consistent with the previous research [23]. The insets in Figure S3 show the color change of BP nanosheets dispersion before and after Ni2P growth in-situ on the surface of BP nanosheets.
The morphology of crystal BP and Ni2P/BP@ZrP catalyst was characterized by SEM and TEM. Figure 4a clearly displays the layered structure of bulk BP. As shown in Figure 4b, the irregular nanosheets are randomly stacked together to expose more catalyst active sites. The TEM image (Figure S4) illustrates that the bulk BP has been successfully exfoliated into thin nanosheets with a lateral size of 50 nm to 200 nm, indicating the feasibility of preparing BP nanosheets from bulk BP crystals by a freeze-assisted exfoliation method. Besides, it can be observed that the surface of BP nanosheets exhibits several creases and the sheet edges, and tends to scroll and fold slightly due to the very thin layer. The pristine α-ZrP has been exfoliated into nanosheets with lateral dimension of 400-800 nm (Figure S5). Furthermore, the AFM topographic image of α-ZrP nanosheets shows the thickness is about 3.1 nm (Figure S6), which is consistent with 4 layers of α-ZrP nanosheets. Figure S7 clearly exhibits that the Ni2P nanoparticles are uniformly distributed on the surface of BP nanosheets, which is attributed to the anchoring effect of BP. Afterwards, Ni2P/BP nanosheets are attached on the surface of α-ZrP nanoflakes and the combination of these different nanosheets endows the material with wrinkled structure (Figure 4c). In the HRTEM image of Figure 4e, the homogeneously dispersed Ni2P nanoparticles show a characteristic lattice space of 0.224 nm that corresponds to (111) plane of Ni2P, which is distinguished from the 0.26 nm matching to the (040) plane of BP nanosheets (Figure S4). In addition, the elements’ distributions of the prepared catalyst determined by an EDX mapping analysis are shown in Figure 4f, as expected, the species of P, Zr and Ni are homogeneously dispersed in the Ni2P/BP@ZrP composite.
The XPS spectra of the as-prepared BP, Ni2P/BP, α-ZrP, and Ni2P/BP@ZrP samples are shown in Figure 5 (the binding energies of samples are summarized in Table S1). For Ni 2p, the characteristic peaks show up at 852.9, 856.7, and 861.9 eV for Ni 2p3/2 energy levels, which can be ascribed to Niδ+ (0 < δ < 2) in Ni2P/BP, oxidized Ni species, and the satellite of Ni 2p3/2 peak, respectively. Similarly, the other three peaks are also observed at 870.1, 874.7, and 880.6 eV for the Ni 2p1/2 energy levels, corresponding to Niδ+, oxidized Ni species, and the satellite peaks of Ni 2p1/2, respectively [45]. The peak located at 852.9 eV is very close to the metallic binding energy of Ni (852.8 eV) [46], illustrating an existence of nickel with a partial positive charge, Niδ+, in Ni2P/BP [15]. Upon introduction of Ni2P/BP to α-ZrP, because of the electron transfer from Ni in Ni2P/BP to α-ZrP, the binding energies of Ni 2p3/2 and Ni 2p1/2 are all shifted to higher binding energy regions by about 0.3 eV and 0.5 eV, respectively. For the P 2p region in Figure 5b, the doublets at 129.9 eV and 130.8 eV can be assigned to P 2p3/2 and P 2p1/2 in BP nanosheets [47]. Compared to the BP nanosheets, the characteristic peaks of P 2p in Ni2P/BP are shifted to lower binding energy regions by 0.7 eV, suggesting that the related P species in Ni2P own more negative charges [15]. The decrease in binding energy means the enhanced electron screening effect owing to the increase of the electron concentration, suggesting that an intimate interaction exists between Niδ+ and BP nanosheets [48,19]. After Ni2P was anchored on BP nanosheets, the peak at 133.8 eV corresponding to the oxidized phosphorus became more pronounced, indicating that degradation of BP nanosheets inevitably occurred in the multi-step preparation process. For the Zr 3d spectra of α-ZrP shown in Figure 5c, the peaks at 183.1 eV and 185.5 eV can be attributed to Zr 3d5/2 and Zr 3d3/2, respectively. It is worth mentioning that the Zr 3d peaks for Ni2P/BP@ZrP shifted to lower binding energy regions compared with that of pure α-ZrP, indicating the strong interaction between Ni2P/BP and α-ZrP. Meanwhile, Zr4+ as a Lewis acid center in α-ZrP is favorable to accept electrons from BP, which is in accordance with the offset direction of binding energy.
3.2 Catalytic activity evaluation
The HDS performances of the catalysts were evaluated in a batch autoclave reactor. In order to test the effect of Ni:P atomic ratio on the catalyst activity, a series of Ni2P/BP@ZrP-(x:y) catalysts were tested using DBT as a model reactant. Figure 6a illustrates the effects of the molar ratio of Ni/P on HDS activity of DBT under the constant condition of 260 ℃ and 4 MPa of H2 pressure. It can be concluded that the DBT conversion rate substantially increases with the reaction time, and its highest value of 85.6% is obtained when Ni to P ratio is 1:2 after reaction for 6 h. However, as time goes by, the reaction conversion rate increases slowly, which is likely due to the decline in DBT concentration. The incorporation of a moderate amount of Ni may contribute to the formation of the NiPxSy phase, which serves as the real active sites for HDS reaction. Besides, the excess BP would increase the electron density around Ni atoms. The high electron density on the metal atom could improve HDS activity by facilitating the dissociation of H2 and the adsorption of DBT [12]. Moreover, it can be presumed that when the Ni/P molar ratio of the catalyst is less than 1:2, the fewer the nickel source incorporated into the BP nanosheeets, the lower the activity of the catalytic site. While for the Ni/P molar ratio of 1:1, the overloading nickel source would easily lead to the agglomeration of Ni2P nanoparticles on the support, causing a decrease in the catalyst activity. The decreasing order of HDS activities of the four catalysts is Ni2P/BP@ZrP-(1:2) > Ni2P/BP@ZrP-(1:1) > Ni2P/BP@ZrP-(1:3) > Ni2P/BP@ZrP-(1:4), i.e., the best molar ratio of Ni/P is 1:2 for the HDS reaction of DBT.
To investigate the variation of the catalyst activity with temperature, using Ni2P/BP@ZrP-(1:2) catalyst, the HDS reaction of DBT was conducted at 220 ℃, 240 ℃, 260 ℃, 280 ℃, and 300 ℃, respectively, and the results were demonstrated in Figure 6b. It can be seen that the DBT conversion increases gradually with the reaction temperature, and has reached the highest value of 87.4% after reaction at 260 ℃ for 6 h, then changes slowly probably due to the consumption of the reactant concentration. It is worth noting that the DBT conversion rate at 280 ℃ is a little lower than that at 260 ℃. It can be deduced that, a high temperature, especially above 280 ℃, can cause the partial agglomeration of a little bit larger Ni2P particles during the reaction and an unfavourability to the adsorption and activation of hydrogen on the catalyst surface as well.
For comparison, the traditional NiMo/Al2O3 catalyst was considered as a reference, and Ni2P/BP@ZrP-(1:2) catalyst showed a higher DBT conversion of 87.4% in contrast to NiMo/Al2O3 catalyst whose DBT conversion was only 65.6% under the same condition (260 ℃, 4 MPa). The higher activity of Ni2P/BP@ZrP catalyst can be attributed to Ni2P anchored on BP nanosheets surface, which not only facilitates the formation of uniform dispersed Ni2P active phase, but also improves the decoration degree of Ni species on BP surface and avoids agglomeration of Ni2P nanoparticles.
Stability and reusability are essential for industrial catalysts, hence, they were test under the condition of reaction temperature of 260 ℃, H2 pressure of 4 MPa and reaction time of 6 h for each batch cycle. The results shown in Figure 6c suggest the catalyst remains a relatively satisfactory activity with the addition of fresh model fuel after each cycle, and then the catalytic activity decreases slightly after 6 cycles for a total reaction time of 36 h, indicating that the catalyst has practical stability.