2.1 Collection and identification of the fungus
This objective was conducted in Kenya during the period from 2021 to 2022. The smut-infected plants were identified at the Sugarcane Research Institute in Kisumu, Kenya. Visible sori were cut from the infected sugarcane plants and bagged to prevent any spread to healthy plants. The spores were maintained at the molecular biology laboratory (Pan African University). These spores were rinsed 3 times with distilled water and cultured in potato dextrose agar (PDA). The plates were incubated in darkness at 28oC (Cui et al., 2020; Singh et al., 2005). To purify the cultures, single colonies were transferred onto new plates and incubated in darkness at 28oC (Que et al., 2014).
The fungal genomic deoxyribonucleic acid (DNA) was extracted from mycelia using a Zymo Fungal/Bacterial Genomic DNA Extraction Kit (Inqaba Biotech, South Africa), following the instructions of the manufacturer. The quality and concentration of DNA were analysed by 1% agarose gel electrophoresis and a nanodrop spectrophotometer. To verify the identity of the fungus, the DNA that was extracted from the samples was amplified on conventional PCR using the bE4 (5’- CGCTCTGGTTCATCAACG − 3’) and bE8 (5’- TGCTGTCGATGGAAGGTGT − 3’) primers that are specific for S. scitamineum(Izadi and Moosawi-jorf, 2007; Zhang et al., 2015).
Conventional PCR amplification was carried out in a 25𝜇L volume containing 1µl of 0.1ng/µl gDNA, 12.5𝜇L of 2x OneTaq master mix, 0.5𝜇L of each of the upstream and downstream primers and 10.5𝜇L of water. The PCR amplification was performed following a thermal cycling programme of 95oC for 5min; 35 cycles of 95oC for 30s, 52oC for 30s, and 68oC for 40s; and a final extension at 72oC for 5min. The PCR amplicons were checked for quality in a 1% agarose gel electrophoresis and then documented.
2.2 Plant sourcing and extract preparation
The Carissa spinarum leaves were sourced from the Jomo Kenyatta University of Agriculture and Technology’s (JKUAT) botanical garden, in Kenya.
The leaf crude extract preparation was done by cleaning the leaves with sterile water, drying them and cutting them into small pieces using a blender. Then 50g of the leaf sample was heated at 80oC in 250ml of sterile water in a 500ml Erlenmeyer flask for 30 minutes. The crude leaf extract was then filtered using Whatman No. 1 and stored at 4oC (Velu et al., 2017).
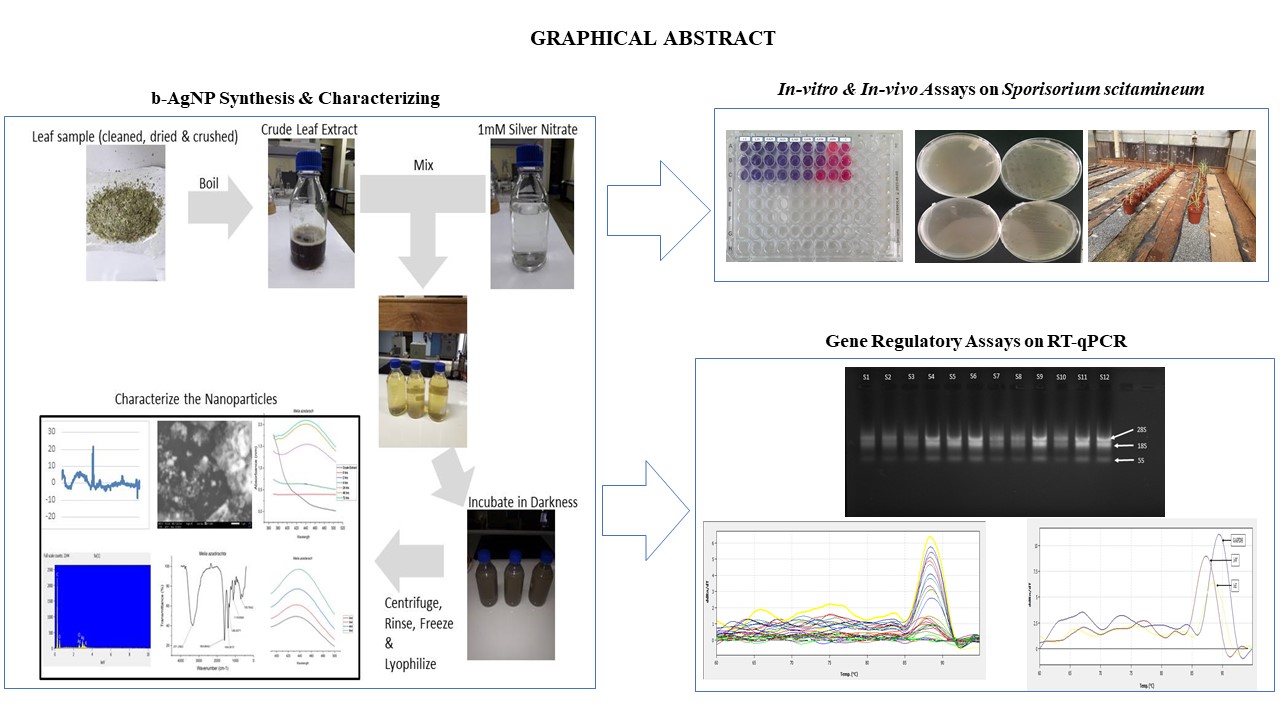
2.3 Biosynthesis of silver nanoparticles using Carissa spinarum
To synthesize the b-AgNPs, 1mM of silver nitrate was formulated by adding 0.167g of silver nitrate into 1L of distilled water. The mixture of the silver nitrate and the plant’s crude extract was made at an optimised ratio of 100ml: 3ml and kept in darkness (for 24 hours) to prevent photo-reduction of the silver, at 28oC in a 150rpm shaking incubator. The intensity of the colour which is indicative of nanoparticle formation was recorded between 200 to 800nm on a UV-Vis spectrophotometer using the Flight Deck, Jenway Model 6800 Spectrophotometer (Velu et al., 2017).
2.4 Optimizing the nanoparticles
The b-AgNPs were optimised under different reaction conditions which included leaf extract reaction volume (2, 3, 4, 5, 6, 7, 8, and 9 ml) and the duration of incubation of the AgNPs in darkness which was varied at 0, 2, 4, 12, 24, 48 and 72 hours (Houllou et al., 2019). While optimizing each parameter, the other parameter was kept constant.
The b-AgNPs were isolated from the optimized mixture by centrifugation at 12 000 rpm for 20 minutes. The pellet was then purified using distilled water and washed twice to ensure better separation of free entities from the AgNPs. The b-AgNPs were kept at -20oC for 24 hours, moved to -80oC to be kept for 48 hours, and then they were lyophilized and used for further characterization (Velu et al., 2017).
2.5 Characterization of the b-AgNPs
UV-Vis Spectra Analysis
The sample (1ml) of the suspension was collected periodically to monitor the completion of bio-reduction of Ag + in an aqueous solution. The UV-Vis spectrum of the solution was measured between wavelengths 200 and 800nm using the Jenway Model 6800 Spectrophotometer Flight Deck with a resolution of 1nm (Sanchooli et al., 2018).
FTIR Analysis: The nanoparticle characterization included ascertaining the active biomolecules responsible for the reduction; capping and stabilising by FTIR Spectrometer model 8400, Shimadzu. For the FTIR analysis, the dried b-AgNPs were added to FTIR-grade potassium bromide (KBr) in 1: 100 ratios and observed in the range of 4000 to 400 cm− 1.
TEM Analysis
The analysis to determine the morphology, size and shape of the nanoparticles was done using the JEM-2100 Electron Microscopy. The TEM sample grid with a continuous silicon oxide film was prepared, as well as the glassware and apparatus. The sample grid was then derivatized by exposing the silicon oxide to 10µl of aminopropyldimethylethoxysilane solution. The b-AgNPs were then citrate-stabilized for them to have a negative charge to attract to the positively charged TEM surface grid (Bonevich and Haller, 2010).
2.6 Antifungal activity of the b-AgNPs
The antifungal activity of the synthesized AgNPs was assayed using the disc diffusion assay method. The S. scitamineum was cultured in PDA media and the treatments were replicated 3 times. The plates were incubated in darkness at 28oC for 48 hours. Varying concentrations of silver nanoparticles (0.62, 1.25, 2.5, 5, and 10mg/ml) were dissolved in distilled water and placed on the surface of inoculated agar plates. The positive control was the standard fungicide nystatin and the negative control was distilled water. The antifungal activity was measured by the diameter of the inhibition zone (mm).
2.7 Minimum inhibitory concentration (MIC) of the b-AgNPs
This assay aimed to determine the least amount of the b-AgNPs that inhibited the growth of the fungi completely. The fungus was cultured on nutrient media broth and 200µl was transferred into different wells on a 96 well plate. Then 200µl of serially diluted b-AgNPs (0.0097, 0.0195, 0.039, 0.078, 0.165, 0.3125, 0.625, 1.25, 2.5, 5, 10 and 20mg/ml) was added onto the wells and incubated for 24 hours. The negative control was the fungus without the b-AgNPs but water and the positive control was the b-AgNPs without the fungus. After the 24-hour incubation, 10µl of resazurin was added and incubated in darkness for 2 hours, to determine the metabolic state of the fungi in the wells by colour changes. The lowest b-AgNP concentration without any colour change (indicating metabolic activity) was recorded as the minimum inhibitory concentration (Sanchooli et al., 2018).
2.8 Minimum Fungal Concentration
From the MIC assays, the wells with the least concentration that had no colour change (recorded MIC) and the subsequent well (slight colour change) were then cultured on PDA to observe the least AgNP concentration that will inhibit fungal growth.
2.9 Antifungal activity of the b-AgNPs in-vivo
The efficacy of the b-AgNPs to control the pathogen in-vivo was evaluated by measuring the pathogen biomass (copy number) using qPCR. Healthy seed cane of the smut-susceptible variety CO421 was obtained from the Sugarcane Research Institute (SRI) in Kisumu, Kenya, and grown in the greenhouse.
The S. scitamineum teliospores that were provided by the SRI were cultured on PDA at 28oC for 5 days. The mycelium was then transferred to a yeast extract liquid medium and incubated at 28oC while shaking at 150rpm for 2 days before it was used for inoculation. The inoculum suspension was calibrated using phosphate-buffered saline (PBS) solution to match the McFarland turbidity standard. This standard was made by mixing 1% Barium Chloride (0.05ml) and 1% Sulphuric acid (9.95ml) to produce a 0.5 McFarland standard which is equivalent to 1.5x10⁸ colony forming units (CFU). The fungal cells were then harvested by centrifuging at 4000rpm for 5 minutes. The cells were rinsed with distilled water twice before resuspending them on 1ml distilled water. Inoculation was done 3 weeks after germination following the injure and paste method (Olweny et al., 2008). The negative control was inoculated with distilled water (Sun et al., 2019; Yan et al., 2016). The success of inoculation was confirmed by conventional PCR using the bE4 and bE8 primers.
After 2 weeks, post-inoculation, the plants were treated with the b-AgNPs (78µg/ml and 39µg/ml), and DNA extraction was done at 3 weeks after inoculation. To treat the infected plants, the plants were completely cut off at a height of 5cm to mimic harvesting before the treatments were applied. The treatments included; plants that were treated with water (positive control), plants that were treated with 78µg/ml of b-AgNPs (MIC), plants that were treated with 39µg/ml of b-AgNPs (1/2 MIC) and healthy plants as a negative control.
The fungal genomic DNA was extracted using a Zymo Plant Genomic DNA Extraction Kit (Inqaba Biotech, South Africa) following the manufacturer’s instructions. The quality and concentration of DNA were analysed by 1% agarose gel electrophoresis and by using a nanodrop spectrophotometer.
For the qPCR quantification (SYBR Green), pure fungal DNA was diluted in tenfold serial dilution (10− 1, 10− 2, 10− 3, 10− 4 and 10− 5) with a known starting DNA concentration to generate the regression line that was used to interpolate the Ct values of the DNA from the treatments (Nalayeni et al., 2021).
The qPCR amplification was done using the bE mating-type gene-specific primers (F-CCAACGACGAAAGCGCGACG and R-GACTCTCTGCGAGCGGGCAT) and the qPCR cycle conditions were: 95oC for 5 minutes, 95oC for 30 seconds and 60oC for 30 seconds.
2.10 Gene expression analysis of the bE and bW genes in S. scitamineum
The fungus was cultured in nutrient broth media for 48 hours. The culture was then transferred (2ml) into tubes and was mixed with an equal amount of b-AgNPs. The 3 treatments were; fungi treated with 58.5µg/ml of b-AgNPs (75%MIC), fungi treated with 39µg/ml of b-AgNPs (50%MIC), and fungi treated with water as a positive control. Total RNA was extracted from these samples at 3, 6, 9 and 12 hours (Peters et al., 2020). The samples were twelve in total.
The RNA was extracted using a Zymo Quick-RNA MiniPrep Kit (Inqaba Biotech, South Africa) following the manufacturer’s instructions. The quality and concentration of RNA were analysed by 1% agarose gel electrophoresis and by using a nanodrop spectrophotometer.
The extracted RNA was converted to cDNA using the FIREScript cDNA Synthesis Kit (Solis BioDyne) following the manufacturer’s instructions. Upon conversion of the RNA to cDNA, the samples were amplified on conventional PCR using the ITSa primer to confirm the success of conversion.
The RT-qPCR quantification (SYBR Green) treatments included the fungi with b-AgNP treatments (0.059mg/ml and 0.039mg/ml) and cDNA from fungi treated with distilled water as a positive control. The qPCR cycle conditions were: 95oC for 12 minutes, 95oC for 15 seconds and 60oC for 20 seconds.
The primers that were used for the RT-qPCR were designed based on the bE gene (JQ290342.1), bW gene (MZ773250.1) and the GAPDH gene (DQ352817.1) as a housekeeping gene. To design the primers, the FASTA sequences of the genes were downloaded using the NCBI BLAST for nucleotides and inputted into the Primer3 software to design the primers. The Primer3 software produced several primers along with their amplicon sizes and positions on the gene (Table 1). The produced primers were then tested on the primer manipulation suite to check if the primer statistics pass to be used for PCR (Thornton and Basu, 2011). The relative expression levels of the target genes were calculated using the Delta Ct method. The house-keeping gene GAPDH was used as a reference gene to calculate the relative expression and to determine the ratio of expression of the target genes.
Table 1
The list of primers that were designed and optimized for the relative RT-qPCR assays
|
Gene ID
|
Primer
|
Forward primer
|
Product size
|
Position
|
|
JQ290342
|
bE - F
|
TGGATCAGATATGGCGTCAA
|
179bp
|
237–415
|
|
bE- R
|
GCTCTCTGCTTAGCCCTCCT
|
|
MZ773250
|
bW - F
|
GCTTTCACTCCTTGGAGCAC
|
172bp
|
1042–1213
|
|
bW - R
|
TTCCGATGGTGAGATTAGGC
|
|
KJ194461
|
ITSa - F
|
TGAGGGTTTTGCCATTTACC
|
150bp
|
456–605
|
|
ITSa - R
|
GCTTCTTGCTCATCCTCACC
|
|
DQ352817
|
GAPDHa - F
|
TTTCCGTCGTTGACCTTACC
|
166bp
|
692–857
|
|
GAPDHa - R
|
AAGATGGACGAGTGCGAGTT
|
2.11 Data Analysis
For the antifungal activity of the b-AgNPs statistical analysis will be performed using a one-way analysis of variance, which was used to compare the differences among samples using their inhibition zones. P values ≤ 0.05 will be considered significant and all antifungal assays will be performed with 3 replications (Sanchooli et al., 2018). The MIC and MFC analysis were evaluated qualitatively.