Patients characteristics according to disease severity.
We performed a retrospective study including 119 patients presenting with COVID-19. We divided our cohort into two categories, according to the clinical classification of the WHO interim guidance. None-severe patients were designated as "Mild-Moderate" (n = 83); while patients in critical or severe conditions were designated as "Severe-Critical" (n = 36). As shown in Table 1, compared with non-severe cases, severe COVID-19 patients were significantly older (mean age, 66 vs 44 years; P-value < 0.001), predominantly male (80.6% vs 44.6%; P-value < 0.001), and characterized by higher rates of clinical symptoms than non-severe cases including asthenia (55.6% vs 2.4%; P-value < 0.001), fever (68.8% vs 36.1%; P-value = 0.002) and dyspnea (66.7% vs 18.1%; P-value < 0.001). They also exhibited higher proportion of comorbidities including diabetes (27.8% vs 8.4%; P-value = 0.006) and cardiovascular diseases (30.6% vs 3.6%; P-value < 0.001). The average time between the onset of symptoms and hospitalization was about 5 days.
Table 1
Characteristics of the study population according to their disease severity.
| Clinical Variables | Mild-Moderate (n = 83) | Severe-Critical (n = 36) | p Value |
| Age, mean (SD), y | 44 (16) | 66 (11) | 0.003 |
| Male, No. (%) | 37 (44,6) | 29 (80,6) | 0.000 |
| Clinical symptoms, No. (%) | | | |
| Asthenia | 2 (2,4) | 20 (55,6) | 0.000 |
| Fever | 30 (36,1) | 22 (68,8) | 0.002 |
| Headache | 13 (15,7) | 5 (15,6) | 0.996 |
| Gough | 34 (41) | 17 (53,1) | 0.239 |
| Dyspnea | 15 (18,1) | 22 (66,7) | 0.000 |
| Vomiting | 16 (19,5) | 6 (18,2) | 0,87 |
| Diarrhea | 17 (20,5) | 10 (31,2) | 0,22 |
| Ageusia | 16 (19,5) | 5 (15,6) | 0.63 |
| Past Medical History, No. (%) | | | |
| Asthma | 5 (6) | 5 (13,9) | 0.155 |
| Cardiacdisease | 3 (3,6) | 11 (30,6) | 0.000 |
| Diabetes | 7 (8,4) | 10 (27,8) | 0.006 |
| Renalfailure | 0 | 2 (5,6) | 0.03 |
| Autoimmunedisease | 3 (3,6) | 3 (8,3) | 0.28 |
| Smoking | 4 (4,8) | 2 (5,6) | 0.866 |
| Complications | | | |
| ARDS | 0 | 13 (40,6) | 0.000 |
| Arterial hypertension | 0 | 7 (23,3) | 0.000 |
| Hemodialysis | 0 | 8 (24,2) | 0.000 |
| Mortality | 0 | 13 (39,4) | 0.000 |
Immune Blood Cell Involvement In Covid-19
The immune system could be a good predictor of disease progression. We decided to study the dynamic of white immune cells in two groups of Covid-19 patients (severe "Severe-Critical" and non-severe "Mild-Moderate").We found that upon patients admission, there was no statistically significant differences in total white blood cell (WBC) counts between patients presenting with severe and non-severe disease (Fig. 1A). However, when we assessed the WBC numbers as a function of the disease evolution, we found that in the “non-severe” patients, the number of WBC remained constant during the first ten days of hospitalization (Fig. 1B).With no statistically significant differences. On the other hand, WBC counts increased significantly in the “severe and critical” group of patients (p = 0,001) (Fig. 1B). We then decided to evaluate the evolution, over time, of each cell type separately.
Our study revealed a statistically significant difference in neutrophil and lymphocyte counts during hospitalization in patients presenting with severe disease compared to non-severe disease patients (Fig. 1C and D). The lymphocyte count appeared statistically lower in the severe group. However, the lymphocyte count remained stable during the first ten days of hospitalization in both groups (with no statistically significant differences). On the other hand, the neutrophil profile seemed closely similar to that observed in WBC (Fig. 1B and D). Indeed, we detected a statistically significant increase for patients with severe disease (p = 0.017) relative to non-severe disease; and the neutrophil count makes it possible to significantly distinguish the two groups (severe "S.C" and non-severe "M.M")(Fig. 1D).With regard to the monocytes, we observed a statistically significant increase in the severe group, during hospitalization (p = 0.02). Monocytes count did not make it possible to distinguish disease severity (Fig. 1E).
In contrast, eosinophils count increased significantly during hospitalization in the mild-moderate and severe-critical groups (p = 0,000 for M.M and p = 0,021 for S.C). The magnitude of the increase was greater in the mild group (Fig. 1F). Neutrophils variation was similar to that observed for all WBCs, suggesting that the observed WBC profile was probably due to the evolution of the neutrophils count. Consistently, further analysis showed a strong correlation between variation of white blood cells and variation of neutrophils count (r = 0,87 and p < 0,000)(Fig. 2). Altogether, these observations strongly suggested that neutrophils were the main subpopulation, which was responsible for the WBC increase in COVID-19 patients presenting with severe-critical disease.
High neutrophils rate significantly associated with disease severity and with inflammatory biomarkers level.
Subsequently, we compared the neutrophils profile in patients who required ICU care at any point during their hospitalization (ICU) with patients who did not require ICU care throughout their hospitalization (non-ICU). Initial neutrophils count in the two groups was similar, but from day5, the number of neutrophils was dynamic and able to differentiate the ICU from the non-ICU group. The neutrophils count was significantly elevated in patients requiring ICU-department care compared to non-ICU patients (p = 0,000) and it increased significantly during hospitalization (p = 0,016)(Fig. 3A). Further quantification revealed that the changes in neutrophils count over the time course (Delta-neutrophil: defined as changes in neutrophils count obtained between day 0 and day 5 of admission) was significantly different between ICU and Non-ICU patients (p = 0,0021)(Fig. 3B). Both CRP and procalcitonin showed strong positive associations with changes seen in neutrophils count(r = 0.44, p < 0.001 and r = 0.60, p = 0.003, respectively; Figs. 3C and D).
Neutrophils Count At Day 5 Appeared To Be An Excellent Predictive Of Complications During Hospitalization
We tested the prognostic utility of neutrophils count in determining the need for advanced respiratory support for COVID-19 patients, using receiver operating characteristic (ROC) curve analyses involving patients with Mild-Moderate versus Severe-Critical disease. In particular, we first compared predictive values of disease severity for CRP, PCT and neutrophils. Interestingly, CRP, PCT, neutrophils count (at day 0), neutrophils count (at day 5) and delta-neutrophils (day 0 to day 5) were all predictive of a need of advanced respiratory support. However, the area under the curve (AUC) for CRP was higher than for the other features (Fig. 4A and 4E). For the prediction of Intubation and ARDS, the AUC of neutrophils at day 5 was 0,951 and 0,974 compared to 0,899 and 0,929 for CRP respectively (Fig. 4B, C and E). For the hemodialysis prediction, the AUC of neutrophils at day5 was in close similarity to that of CRP (0,894 for neutrophils at day 5 compared to 0,899 for CRP) (Fig. 4D and E).
Neutrophils count was associated with mortality in hospitalized COVID-19 patients. Patients were stratified into two groups, those with normal (≤ 7500/mm3) and those with high neutrophils count (> 7500/mm3). Kaplan-Meier curves for all patients were performed to study association of neutrophils count at day 5 with COVID-19 mortality. A result showed that rise in neutrophils was statistically associated with COVID-19 mortality (Fig. 5A). Then we assessed predictive values of neutrophils count (PNN) at admission, that of change in neutrophils from day 0 to day 5 (Delta-PNN) and that of neutrophils count at day 5 (PNN-day5) for all COVID-19patients. All three were predictive of mortality, though the area under the curve (AUC (95% CI)) for PNN-day5 was greater than for the other parameters. The AUC for neutrophils at day 5 was 0,951(0,903–0,999) compared to 0,881(0,723–1) and 0,834(0,733–0,934) for Delta-PNN and neutrophils at admission respectively (Fig. 5B). Subsequently, we split the Severe-Critical patients into two groups (death and non-death). Interestingly, we found that patients with normal neutrophils count survived, and on the other hand, those with a gradual increase in neutrophils count exceeding the normality threshold, died (Fig. 5C). The survival curve of patients with severe disease revealed that the neutrophils count on day 5 was a statistically significant risk, which was associated with mortality in severe COVID-19 patients (Fig. 5D). These results showed that in patients with severe disease, two subgroups can be distinguished based on the number of neutrophils. Surviving patients, characterized with normal neutrophils count during the first 10 days of hospitalization, and non-survivors, characterized by an abnormal increase in the neutrophils number (> 7700/mm3) from day 5.
With the aim of extending this observation to all patients, we studied the variation of neutrophils according to the disease severity and the mortality in all patients. The results showed that in patients with mild disease (MM) and survivor patients with severe disease, there was no statistically significant difference in neutrophils count variation (Delta-PNN) (Fig. 5E) and that on day 5. Neutrophils count of these two groups of patients was normal (Fig. 5F). In contrast, patients who did not survive exhibited significantly elevated neutrophils count on day 5 relative to the control (Fig. 5F). These results suggested that dynamic trends of neutrophils in patients with COVID-19 and their rates on day 5 were predictive of mortality and this was independent of clinical classification.
To confirm these results, we carried out logistic regression analysis with enter or forward selection method to identify risk factors for mortality and ARDS. In this analysis, there were 79 COVID-19 patients with neutrophils level at day 5 and the survival status. The binary logistic regression was performed on the neutrophils (PNN) rate, neutrophils rate at day 5 (PNN-day5), neutrophil-to-lymphocyte ratio (NLR), C reactive protein (CRP), procalcitonin (PCT), creatinine, hemoglobin (HB) and age. For selecting relevant classification predictors, we used forward stepwise algorithm based on the wald test. The algorithm identified that neutrophils rate at day 5 was the risk factor that best predicted mortality among COVID-19 patients (Table 2).
Table 2
Regression analysis of mortality risk factors for COVID-19 patients
| | Mortality |
| OR (95% CI) | P value |
| Neutrophil at day 5 | 1,001(1,00–1,001) | 0,020 |
| Neutrophil | 0,999 (0,998–1,001) | 0,360 |
| NLR | 0,998 (0,992–1,004) | 0,525 |
| CRP | 1,010 (0,985–1,036) | 0,432 |
| PCT | 4,655 (0,044–367,372) | 0,519 |
| HB | 1,707 (0,650–4,481) | 0,278 |
| Creatinine | 0,958 (0,671–1,366) | 0,811 |
| Age | 1,021 (0,944–1,104) | 0,609 |
| Data are represented as pooled of logistic regression. |
| Abbr: NLR, neutrophil-to-lymphocyte ratio; CRP, C-reactive protein; PCT, procalcitonin; HB, hemoglobin; OR, Odds ratio; CI, confidence interval. |
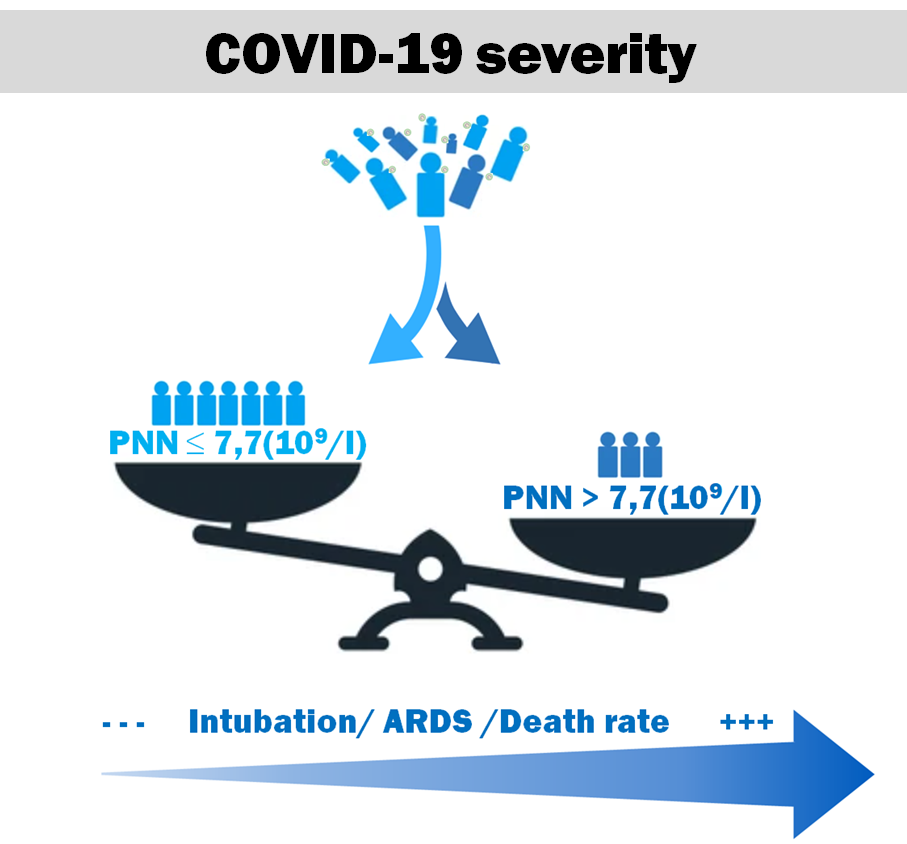
Thus, the used algorithm, sorted out neutrophils at day 5 as the first variable for predicting mortality, then either the CRP or the PCT. We also performed binary logistic regression with PNN-day5, which were stratified as an explanatory/predictor variable. We distinguished two cases as dependent variables, either “death” or “ARDS”. In both cases, we found that PNN-day5 > 7,7 × 10⁹/L discriminated well the two mortality classes “yes/no” and the two ARDS groups “yes/no” for COVID-19 patients (Table 3). The pooled logistic regression model for each case was:
$$Logit \left(P\right(mortality=1/PNNday5\left) \right)= -\text{2,72} + \text{3,57} \times {ind}_{PNN-day5>7.7(109\backslash L)}$$
$$Logit \left(P\right(ARDS=1/PNNday5\left) \right)= -\text{2,46} + \text{3,85} \times {ind}_{PNN-day5>7.7(109\backslash L)}$$
Knowing that:
$${ind}_{PNN-day5>7.7\times 109\backslash L}=\left\{\begin{array}{c}1 if PNN-day5>7.7(109\backslash L) \\ 0 else\end{array}\right.$$
Table 3
Pooled regression analysis of mortality and ARDS risk factors for PNN-day5.
| Variable | Parameter | B | SE | P | OR (95% CI) |
| Mortality | PNN-day5 | 3.572 | 0.862 | 0.000 | 35.583 (6.573–192.644) |
| ARDS | PNN-day5 | 3.854 | 0.918 | 0.000 | 47.200 (7.814–285.092) |
| Data are represented as pooled of logistic regression. |
| Abbr: PNN-day5, Neutrophil at day 5; ARDS, acute respiratory distress syndrome; B, regression coefficient; SE, standard error; OR, Odds ratio; CI, confidence interval. |
Neutrophils rate at day 5 was found to be an independent predictor factor of mortality and ARDS. Neutrophils rate at day 5 could therefore help clinicians identifying poor prognosis COVID-19 patients and provide them with suitable care.
Furthermore, we investigated the relationship between IL-6 levels and neutrophils rise. Interestingly, IL-6 levels showed a positive correlation with neutrophils count on day 5 (r = 0,447, p = 0,000) (Fig. 5G). Then we compared neutrophils count in patients with high or low initial IL-6 levels. We found that levels of neutrophils at day 5, were statistically more elevated in patients with high initial IL-6 levels than patients with low IL-6 levels (Fig. 5H). Our study suggested that the increased neutrophils rates might be associated to a previous increase in IL-6 levels in COVID-19 patients.