The current study aimed to develop the best prediction model for NUE, NL and DMI_a of individual dairy cattle in China. Different pre-processing methods of MIR spectra, machine learning algorithms, predicting equations, and validations (within-herd and external) were investigated. The results indicated that the best prediction model was different for each trait. Reasonable performance metrics were obtained for within-herd validation, while only NUE could be predicted with a relatively high accuracy in the external validation. The results of different diet groups in T2 indicated that diet composition may have considerable impacts on the predictive ability. Additionally, variables that significantly contribute to the prediction were assessed for each trait, which can be helpful for the interpretation of prediction results.
Individual nitrogen use efficiency
The average value of individual NUE in this research (Fig. 1, Table 3) is comparable with that in previous studies [5, 29], which reported ranges from 15 to 40%, but lower in studies that investigated cows in early lactation, in which individual NUE ranged from 34.4–36.9% [11, 12]. This variation may be due to the coverage of a relatively long period (about 300 DIM) for individual NUE in the present study, as well as differences in animals, diets, rearing conditions, and the lactation stage. Grelet et al. [11] observed that more efficient animals have greater negative energy balance in early lactation. Cows mobilize fat tissue and lose weight when the energy balance is negative. The additional protein from tissue mobilization may have resulted, therefore, in a higher NUE in early lactation. Additionally, the variation of NUE in different lactation stages may be explained by the dilution effect of protein requirements for maintenance as a result of the high MY in early lactation. With an increasing stage of lactation, the efficiency decreases, as an increasing fraction of protein (N) is allocated to maintenance and gestation, instead of to milk production [30].
It should be noted that the methodology used to calculate NUE in this study neglected changes in body weight (e.g., fat reserves, fetus, and supporting tissues) and the associated increase or decrease in body N, because these changes are relatively small compared to the N output via milk production. The NUE in this study is expected to be slightly lower than the true NUE considering all N flows in the animal.
Within-herd validation and important variables
The current study developed reasonable prediction models for daily NUE, NL and DMI of individual cows by comparing different prediction algorithms and pre-processing methods for MIR data. Furthermore, the important scores of input variables for different prediction models were evaluated. The performance metrics of the best models for NUE and NL (Tables 4 to 6) were comparable with those in the study of Grelet et al. [11], who reported R2 ranging from 0.59 to 0.68, RE ranging from 0.14 to 0.23, and RPD ranging from 1.57 to 2.07. Lahart et al. [23] included both MIR spectra and near-infrared spectra to predict the DMI of individual cows in grazing system and reported R2s ranging from 0.60 to 0.81 in cross-validation. The best R2 of DMI_a in the present study ranged from 0.60 to 0.63 in the within-herd validation (Table 4), which was comparable to the results of Lahart et al. [23]. In addition, the prediction accuracy for NL was relatively low compared to that for NUE in our study. This was observed in previous research [11, 12] as well. This may be due to the different nature of NUE and NL. NUE was calculated as the ratio of N output in milk to N intake, while NL was subtracting N output in milk from N intake. The prediction accuracy of N output (obtained from protein yield) in milk is substantially higher than the prediction accuracy of NL or N intake because the MIR profile is capturing N-bounds in the milk, but the prediction of NL or N intake is likely to be indirect and therefore the prediction accuracy is lower. Furthermore, the prediction accuracy of NL is lower than of NUE, because NUE is a ratio, and a ratio has more possibilities to remain stable when both numerator and denominator change. The detailed analysis of MSPE (Table 5) showed that most of the model error was random error, which indicated the established models were unbiased and can capture most of the variability in the input data [24, 31].
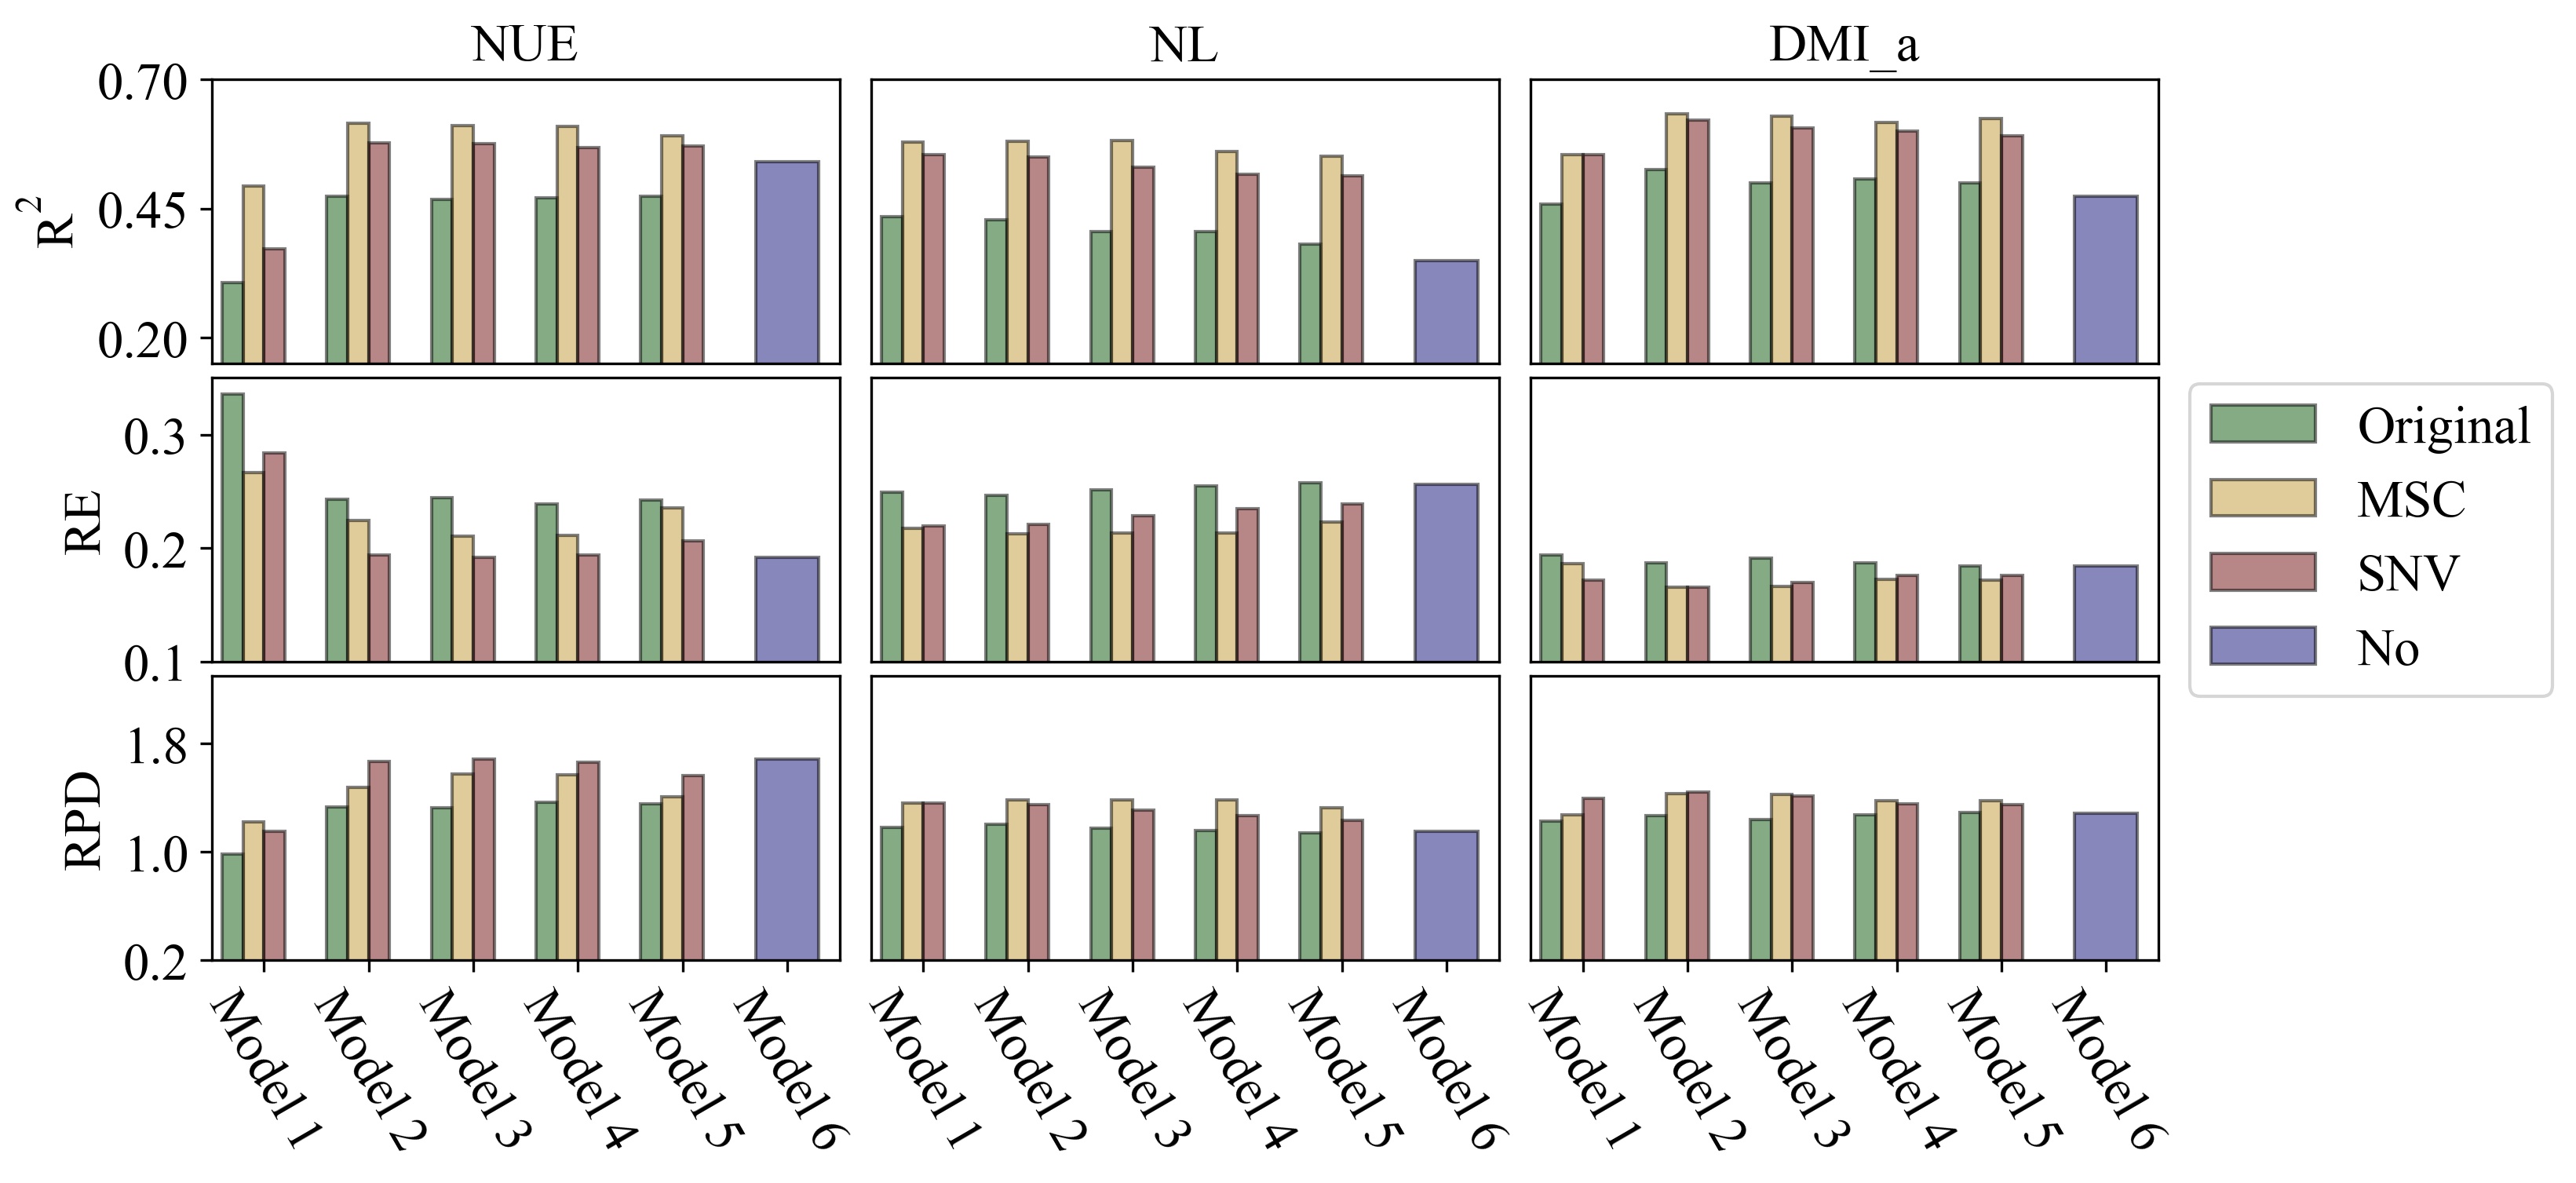
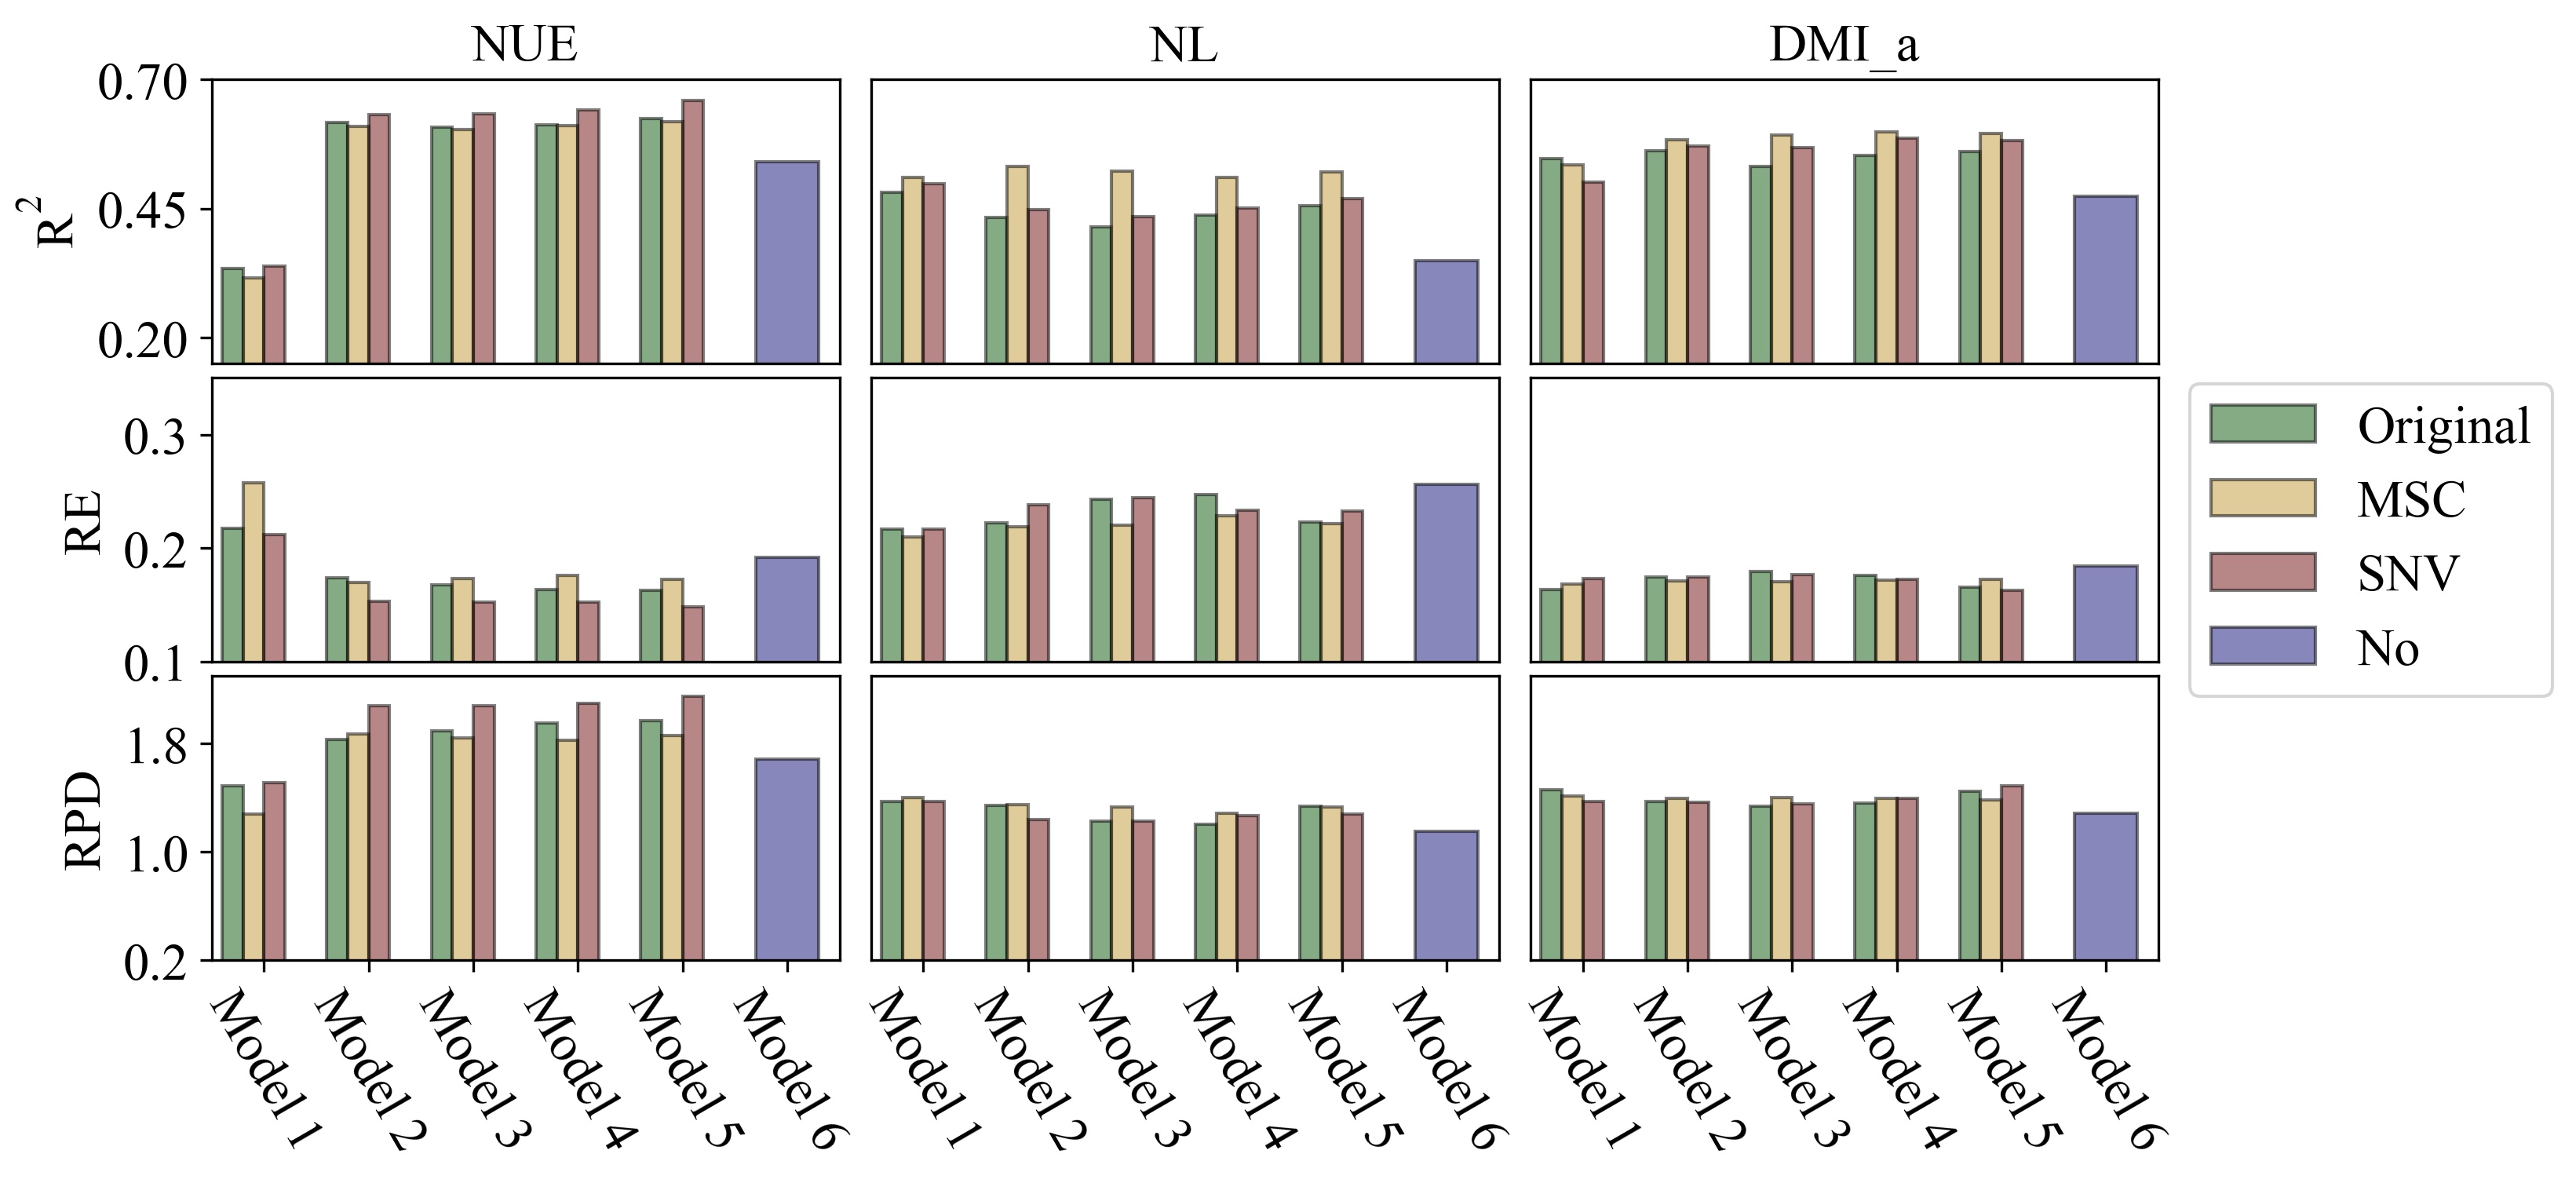
In this study, adding MIR spectra in the best models increased the R2 and RPD by 10 to 30%, as well as reduced the RE by 0.03 to 0.10 compared to model 6 (Fig. 2). Meanwhile, this improvement was more obvious when MIR spectra were pre-processed in within-herd validation. These results indicate that MIR includes additional information for better prediction of NUE, NL and DMI. Pre-processed MIR spectra were better than raw MIR spectra for developing accurate prediction models in within-herd validation (Table 4).
Milk yield and several MIR wavenumbers were featured variables for predicting N related traits. MY was highly correlated with N output (phenotypic correlation = 0.96), and thus contributed substantially to the models. The high-score wave range of MIR at 973.54 to 988.46 cm− 1 (Fig. 3) is associated with C-H, C-N and N-N stretching [32–34]. These chemical compounds are related to proteins, unravelling what proteins affect NUE may further increase understanding of the N metabolism in dairy cows. In this study, the top 10 critical variables were selected to develop a new PLS model and predict the target traits using the same procedure. However, the predictive abilities of these reduced models were compromised for 10 to 20% (results not shown), which suggested that the feature selection procedure did not have additional value in this study.
External validation
In the current research, a dataset with three different diets was used for external validation, and relatively less accurate performance metrics were generated for all target traits (Table 6). Similar findings were reported in the research of Grelet et al. [11], where the R2 for NUE varied from 0.06 to 0.68 in external validations, which reflected the potential decrease of predictive ability. Lahart et al. [23] also found that the accuracy of external validation of DMI was lower than the cross-validation and that the R2 varied considerably among models (0.16 to 0.68). Lower accuracies in external validation may be explained by variations in the validation dataset not covered in the calibration dataset. [11, 35]. In the present study, different R2s for NUE were obtained in different diet groups of T2, and the variation of diet components was impossible to be included in the prediction models due to the identical diet formulation in the calibration dataset (Table 1). Furthermore, T1 and T2 were conducted in different seasons. Extreme heat in summer is expected to affect the metabolic status and further affect the milk production and N utilization of dairy cows [36]. The occurrence of summer heat in T1 may have resulted in lower R2s for predictions of N intake (DMI) and N output than in T2, which was conducted in winter. In addition, as discussed in previous section, NUE may be more robust when both N intake and N output were changed because it is a ratio trait. The prediction accuracies for NUE were relatively stable and comparable.
Predicting cows consuming completely different diets without taking the diets into account usually generate lower accuracies [35]. However, it is still worthwhile to test the robustness of prediction models by external validation, especially for large-scale data prediction. Large-scale data prediction requires much more variation in diets in the training set and much higher numbers of farms and animals to end up with more accurate external validations. In this study, reasonable results were obtained for NUE in the external validation (Table 6), which means the models were robust enough to predict the NUE without considering diet composition. Moreover, the R2 of 3 subgroups in T2 indicated that the diet components do affect the prediction accuracy. The average NUE of animals in subgroup 3 was close to that of the calibration dataset (26.1 vs 26.4), and the ratio of concentrate to C:R for subgroup 3 and calibration dataset was the same (56:44). The similar NUE and the equal C:R may be the reason for the accurate predictions (R2 = 0.76) by Model 2. In this study, animals in group 1 and 2 of T2 were offered diets with higher C:R ratios than the standard, which significantly reduced milk yield and NUE (Table 3). Therefore, it is expected that the current model would perform even better (or more reasonable, for NL and DMI_a) on those Chinese farms that feed the cows with the regular diet, in which the C:R is 55:45 in most cases (Table 1). As long as feeding regimes are very similar on other farms, the prediction equations may facilitate genetic evaluation on a larger data set of MIR spectra. For instance, Chen et al. [12] applied the prediction models of Grelet et al. [11] to a large dataset for genetic evaluation of predicted NUE and NL in early lactation. It also should be noted that the equations in Grelet et al. [11] were based on three farms in three countries and therefore they might be more robust than prediction equations from the present study with the data from one farm.
MIR spectra do have additional value for predicting N-related traits. Higher MSPEs, and higher bias% and slope% were observed when MIR spectra were not included in the prediction model for DMI_a and NL (Table 7), even though higher R2s were obtained for these models (Table 6). However, as several studies indicated [15, 33, 37], pre-processed MIR cannot always provide more accurate results. In the current research, it was observed that models including pre-processed MIR performed better than models with original MIR in within-herd validation, but performed worse in external validation (Tables 4, 5, 6 and 7). The different seasons and diet compositions may affect the profile of original MIR spectra. Mathematical treatments could further amplify the error if the data points of the calibration data set and validation data set are already different. Thus, the final spectra may strongly affect the quality of prediction. Therefore, it is suggested to pre-test the model with preprocessed and original MIR spectra before using the prediction equations for nationwide prediction.
Future implications
The results in this research showed that predictivities of NUE, NL and DMI_a by milk MIR spectra were affected by diet composition. Changes in these target traits were observed even though we did not perform a detailed dietary analysis in this study (Table 3). There is a potential opportunity to combine the knowledge of animal nutrition and MIR spectra to improve the predictive ability of N related traits, as well as to understand the biological mechanisms underlying these traits. Nevertheless, these results may provide insights in the farm management strategy in China. The improved model and biological understanding could be used to improve feeding management on dairy farms. For example, a suitable ration can result in a higher nitrogen use efficiency for individual cows, which would be beneficial for mitigating the negative environmental impacts of dairy farms.
A reasonable prediction model, with R2 of 0.63, RE of 0.19 and RPD of 1.80 in the external validation, was developed for NUE of individual cows (Table 6). It is possible to perform genetic analysis for NUE in a large-scale dataset with MIR records. However, our model was based on a Holstein population in a typical farm in the north of China, which means it might not be applicable to farms in a completely different environment (e.g., climate conditions, diets, management strategies). Therefore, a more comprehensive dataset, which accounts for the variation in environment, is needed to develop a nationwide generalized model to predict N related traits in the Chinese dairy population.