2.1. Animals
Eighty-one (81) male 3-month-old Wistar rats (280–320 g) were obtained from the central vivarium of the State University of Maringá. The animals were acclimated to a controlled temperature (22° ± 1°C) and a 12 h/12 h light/dark cycle (lights on at 7:00 AM) for 2 weeks before the experiments. The animals were housed in groups (n = 5–10/group) in plastic cages and given standard commercial chow (Nuvilab, Quimtia, PR, Brazil) and tap water ad libitum. The local Ethics Committee on Animal Experimentation of the State University of Maringá approved the experimental procedures following the guidelines of the U.S. National Institutes of Health and Brazilian College for Animal Experimentation (CEUA no. 8156290119). All efforts were made to minimize the number of animals used and their suffering.
2.2. Drugs
Desipramine and 6- OHDA were obtained from Sigma-Aldrich (Sigma, St. Louis, MO, USA). Desipramine was dissolved in sterile saline and 6-OHDA was dissolved in the vehicle (sterile saline with 0.2% ascorbic acid). After 6-OHDA was infused bilaterally in a single dose directly into the SNpc (4 µg/µl) or dorsolateral striatum (12 µg/µl). The neurotoxin 6-OHDA was prepared according to established doses that were shown to promote significant dopaminergic neuron loss in the SNpc (Santiago et al. 2014)or striatum (Shobana et al. 2012).
2.3. Stereotaxic surgery
Thirty minutes before the stereotaxic surgery the animals received intraperitoneal (i.p.) desipramine (25 mg/kg) injection to protect noradrenergic neurons (Padovan-Neto et al. 2009). The animals were then anesthetized with Equitesin i.p. [3 mL/kg; 1% sodium thiopental, 4.25% chloral hydrate, 2.13% magnesium sulfate, 42.8% propylene glycol, and 3.7% ethanol in water (Vieira et al. 2019)], and the skulls were fixed in a stereotaxic frame (Kopf 957, Kopf Instruments, Tujunga, CA, USA). Bilateral infusions of 6-OHDA in a total volume of 1 µl were made in the SNpc or dorsolateral striatum using a 27-gauge stainless-steel needle that was connected to a 5 µl Hamilton syringe (Hamilton Company, Reno, NV, USA), according to the following coordinates (Paxinos and Charles Watson 2007): SNpc: anterior/posterior (AP), − 5.0 mm from bregma; medial/lateral (ML), ± 2.1 mm from midline; dorsal/ventral (DV), − 8.0 mm from the skull; Striatum: anterior/posterior (AP), + 0.2 mm from bregma; medial/lateral (ML), ± 3.5 mm from midline; dorsal/ventral (DV), − 4.8 mm (Fig. 1). The flow of the injections was controlled by an electronic pump (Insight, Ribeirão Preto, Brazil) at a rate of 0.25 µl/min over 4 min (Bonato et al. 2018). The injection needle was left in place for an additional 2 min to avoid reflux. Sham operations followed the same procedure, but the vehicle (sterile saline) was injected instead of 6-OHDA.
2.4. Experimental design
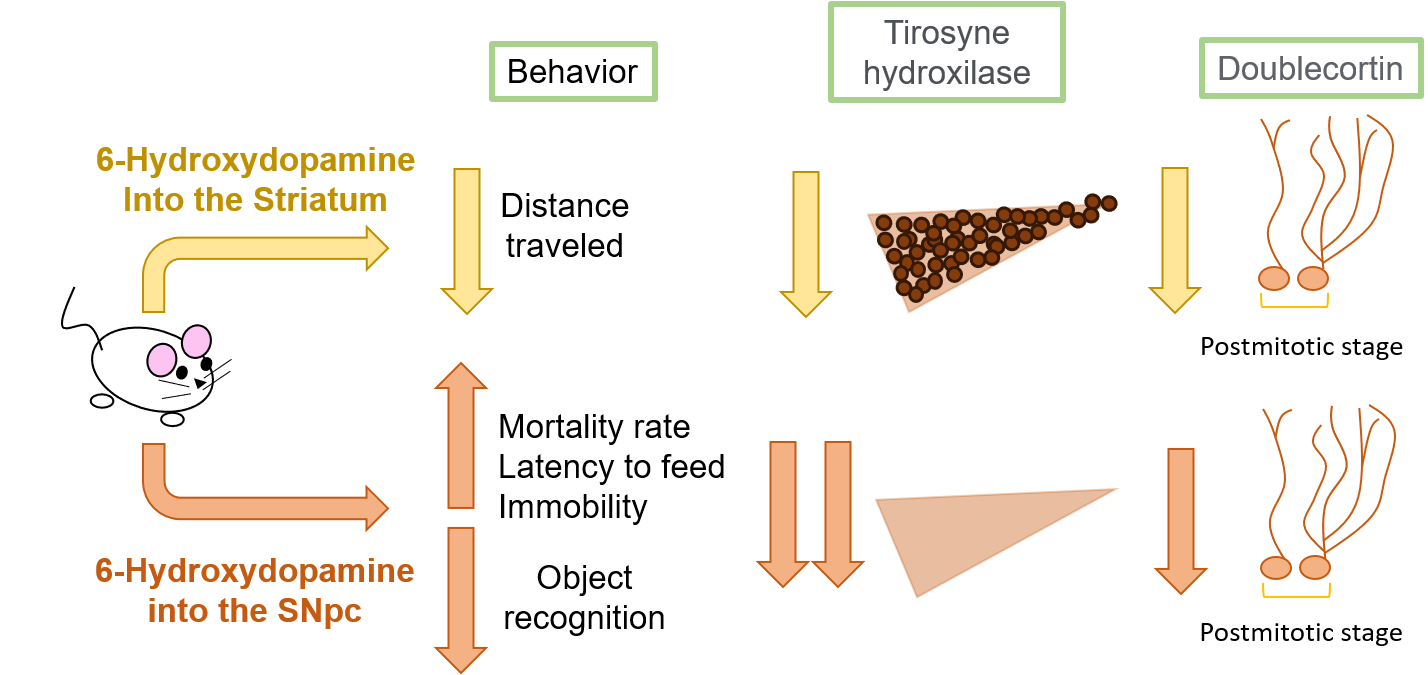
The animals were randomly distributed into 4 experimental groups: SNpc saline (n = 12), SNpc 6-OHDA (n = 39), Striatum saline (n = 12), Striatum 6-OHDA (n = 18). Behavioral testing was conducted from 8:00 AM to 12:00 AM. The open-field test (OF), object recognition test (ORT), splash test (ST), novel suppressed feeding test (NSF), and forced swim test (FST) were performed on days 14, 15, 17, 19, and 22 after 6-OHDA injections, respectively (Fig. 2). All of the animals’ behaviors were monitored and recorded through a video camera positioned above the apparatuses. The images were later analyzed using the ANYmaze contrast-sensitive video monitoring system (Stoelting, Wood Dale, IL, USA). After behavioral testing, the animals’ brains were removed and processed for histological analyses.
2.5. Behavioral testing
Open field
The OF task evaluates locomotion and exploratory behavior (Gellért and Varga 2016). The open field consisted of a circular arena (80 cm diameter, 40 cm walls). On day 14 after the lesion, each rat was gently moved from its home cage and immediately placed in the center of the OF. The rat was allowed to explore the apparatus for 5 min. The distance traveled (in meters), the number of entries, and time spent in the center of the arena were recorded.
Object recognition test (ORT)
The ORT is based on the rodent's instinctive preference for novelty, thus allowing for to assessment of the animals' recognition memory (Akkerman et al. 2012). On the first day, the animals are placed on a round platform (80 cm diameter, 40 cm walls) for 5 minutes for habituation. After two identical objects were placed symmetrically on the platform and the animal had another 5 min for free exploration. Twenty-four h later the animals were put back on the platform with the objects from the previous day, and they were allowed to explore them for 4 min. After one hour interval, the animals were returned to the platform, but one of the objects was replaced with a new one, starting the test session. Each animal had 4 min to explore the new and the old object. The exploration time for each object was recorded. Exploration was considered when the animal was at least 2 cm from the object or touched it. Animals that had an exploration time of less than 5 sec were discarded from the test since memory assessment requires sufficient exploratory behavior for reliable performance (Akkerman et al. 2012). The parameters evaluated were: the time spent by each animal exploring the known object and the time spent exploring the new object. An exploration index (D2) was calculated using the following formula: (exploration time of the new object - exploration time of the known object)/ (exploration time of the new object + exploration time of the known object).
Splash test
The splash test is used to evaluate motivational deficits and self-care difficulties in rodents (Marques et al. 2019). In this test, grooming behavior, which can be considered an indirect measure of the hedonic state was assessed. Each rat was individually placed on a circular platform (39 cm diameter). After 3 min of free exploration, a 10% sucrose solution was squirted on the dorsal coat of the rats. Latency to first grooming and time spent grooming were recorded for 5 min.
Novel suppressed feeding (NSF)
The NSF test has been used to assess type-anxiety behaviors (Blasco-Serra et al. 2017). This test introduces an additional element of motivation, as the animal is deprived of food for a long period. Twenty-four hours before the start of the test, the animal’s food was removed from the cages. The next day, the test was performed on a square platform (70 cm x 70 cm), where each animal was placed individually. The room lights were turned off, and a spotlight was placed only in the center of the platform on a feed pellet. The animal was allowed to remain on that platform for 10 min or until the moment when it picked up the pallet. Then, the animal was transferred to a home cage with previously weighed pallets of feed, so that it could feed for 10 min. After this period, the food was removed and weighed again to assess consumption. After the end of the test, the animals were returned to their cages with food and water ad libitum. The parameters analyzed were: Latency (time to the animal to get the feed) and consumption in the cage-house (weight of the feed before - weight of the feed after feeding). The parameters were manually quantified.
Forced Swim Test (FST)
The FST identifies passive coping strategies in rodents (Can et al. 2011). The test was conducted in two sessions. In the training session, the rats were placed in a tank (25 cm diameter, 65 cm height) that was filled with water at a temperature of 24°C ± 1°C and a depth of 30 cm for 15 min. Twenty-four hours after the training session, the rats were subjected to the test for 5 min, which was videotaped for subsequent quantification of the latency and the immobility time (seconds) i.e., the absence of motion of the entire body and only small movements necessary to keep the animal's head above the water. The water was changed after each animal to avoid the influence of urinary or fecal material.
2.6. Immunohistochemistry
Five to eight animals were randomly chosen from each experimental group, and their brains were processed for immunohistochemistry. Briefly, the animals were deeply anesthetized with sodium thiopental (50 mg/kg; Thiopentax®, Cristália, SP, Brazil) and then transcardially perfused with phosphate-buffered saline (PBS) followed by 4% paraformaldehyde in 0.2 M phosphate buffer. The brains were removed, postfixed in the same fixative for 2 h, and cryoprotected by immersion in 30% sucrose for 48 h before snap froze. Frozen tissue was serially sectioned on a cryostat (Cryocut 1800, Reichert-Jung, Heidelberg, Germany) into 30 µm coronal sections that were collected in replicates in Eppendorf tubes that contained 0.01 M PBS with 0.01% sodium azide.
The brain sections were quenched in 1% H2O2 for 30 min and then blocked with 2% bovine serum albumin (BSA) in PBS for 60 min. The sections were incubated with mouse polyclonal anti-tyrosine hydroxylase (TH) antibody (1:2.000, AB152, Merck Millipore, Darmstadt, Germany) or goat polyclonal anti-doublecortin (DCX) antibody (1:1.000, sc-8066, Santa Cruz Biotechnology, Santa Cruz, CA, USA) in PBS that contained 0.3% Triton X-100 for 48 h at 4°C. The sections were then incubated with the respective biotinylated secondary antibodies (1:500, anti-mouse [sc2039], and anti-goat [sc-2042], Santa Cruz Biotechnology, Santa Cruz, CA, USA) for 2 h. The signals were visualized using avidin-biotin complex (Vector Laboratories, Burlingame, CA, USA), 3,3′-diaminobenzidine (DAB) as the chromogen, 0.05% H2O2. The sections were then mounted on gelatin-coated slides, dehydrated in ethanol, and coverslipped with Permount mounting medium.
Analysis
The slides were previously coded and the analyzes were carried out by an experimenter blind to the treatments. The slides were analyzed with the aid of an optical microscope (Olympus, BX41, Pennsylvania, USA) attached to a camera (QColor, Olympus, America Inc.). For the quantification of TH-immunoreactive (IR) cells, photomicrographs were obtained from SNpc, VTA, and striatum at the 20X objective. The ImageJ software (National Institutes of Health, Bethesda, MD, USA) was used to assist in counting the number of TH-IR cells. The number of TH-IR cells was obtained over the entire extension of SNcp and VTA. For the striatum, measurements of integrated optical density (IOD) were performed in prefixed areas (0.58 mm2) that were previously defined. After acquiring the images, they were converted to a 16-bit grayscale image, the background was removed, the threshold for the positive signal was defined and the IOD was calculated. The two cerebral hemispheres were evaluated and the average between them was obtained. The analysis was conducted from 4 to 5 sections per animal.
DCX-IR cells were counted through the subgranular zone (SGZ) of the dentate gyrus of the hippocampus (Bregma − 3.14 to − 4.52 mm, Paxinos and Charles Watson 2007). Five to six sections were analyzed per animal. For each section, the DG gyrus area was obtained and the number of DCX-IR cells was counted. Evaluation of DCX-IR neurons was performed in 10 DCX-IR neurons which were random. The DCX-IR were classified into 6 different categories concerning their dendrite morphology (Plümpe et al. 2006): A, neuron with no process, B neuron with very short processes, C and D neurons with intermediate processes, with D being more developed than C, and categories E and F, which corresponded to more mature neurons. In E neurons with apparent branches in the molecular layer of the SGZ and F neurons with several branches along the dendritic tree. The results were presented as the sum of A + B (proliferative stage), C + D (intermediate stage), and E + F (post-mitotic stage) (Fig. 6A).
2.7. Statistical analysis
Statistic 8.0 software (StatSoft®, Palo Alto, CA, USA) was used for the statistical analysis. A mortality curve was built to analyze survival data, and the log-rank test (χ2 test) was used to assess differences in animal survival. The behavioral and histological data were examined to verify normality (Shapiro-Wilk test) and homoscedasticity (F test to compare variances). Subsequently, the data were analyzed with the Student t-test. The data were expressed as mean ± SEM. Values of p < 0.05 were considered statistically significant.