Herein, we synthesized the chalcogenide-quaternary nanocomposite loaded Graphene-based ternary photocatalyst via a modified solvothermal method. The preparation of quaternary nanocomposite was based on metallic citrate polymerization which used ethylene glycol (C2H6O2) and citric acid (C6H8O7) as chelate cations. The morphology and electrochemical properties of the as-prepared nano-material investigated by using a physical characterization equipment. Each result showed that the ternary photocatalyst was successfully synthesized and showed the low recombination rate of photogenerated electrons and holes, which defined the catalytic activity of the photocatalyst for CO2 evolution into hydrocarbon fuels under light irradiation. In addition, the stability and reusability of the photocatalyst were analyzed by a 6-times cycling test without loss of methanol formation by CO2 evolution. The graphene-based ternary photocatalyst offers a new nanomaterial with a new-model that protects the environment by showing high catalytic activity in reducing CO2 to methanol.
Original Research
New Modeling of AgFeNi2S4-Graphene-TiO2 Ternary Nanocomposite with Chelate Compounds and Its Photocatalytic Reduction of CO2
https://doi.org/10.21203/rs.3.rs-173213/v1
This work is licensed under a CC BY 4.0 License
Journal Publication
published 11 Mar, 2021
Read the published version in Journal of Materials Science: Materials in Electronics →
Version 1
posted
You are reading this latest preprint version
The increase in CO2 is the main cause of environmental pollution. There are several methods to reduce the CO2 from the atmosphere, such as photoreduction and electrochemical. Among them, CO2 conversion into solar fuel via the photocatalyst based method is an effective way to solve the problem. Nowadays, graphene-based chalcogenide photo-catalysts have high catalytic activity and variable band gap energy, which have been identified as the most promising catalysts in the process [1-3].
Transition-metal sulfide materials are the ideal choices for the photocatalyst. Especially, nickel sulfide is a low cost, a p-type semiconductor with 1.24 eV band gap energy and a visible-light response [4-7]. Most importantly, it has a low Fermi level, which can capture the photo generated electrons because of its obvious tendency toward the metallic character. Transition metals (Ag, Fe, Cu, etc.) have unique properties, such as visible light response, inhibition of electron-hole recombination, and the role of strong electron receptors [8]. Based on the above properties, it is possible to combine nickel-sulfide with transition metals to produce quaternary nanocomposites with semi-insulating properties and high catalytic activity.
Coupling TiO2 with other semi-conductor can enhance the charge carrier property/ catalytic activity by adjusting their band gap position. For example, NiS decorated with TiO2 nanoflower exhibited a high photoactivity in hydrogen evolution has been reported [9, 10]. The tradition TiO2 is the most widely studied semiconductor because it has high stability, cheap and strong oxidizing ability. However, pure TiO2 is somewhat limited in the photocatalytic field; because it is activated under UV light and ((<387 nm) electrons and holes converge rapidly on the surface [11]. There are many techniques used to improve the properties of TiO2, such as surface modification and combining with low bandgap nano material [12, 13]. A chalcogenide catalyst can be used to improve the photocatalytic properties of TiO2 in CO2 photocatalytic reduction.
In this study, 2D graphene was used as a non-metallic co-catalyst to enhance the properties of the metal-semiconductor. Graphene has advantages such as high surface area, electronic conductivity, charge transfer and could function as a catalyst better than 0-D and 1-D nanomaterials [13-15].
The combination of the metal-semiconductor with graphene can strengthen the physical and chemical properties of graphene, which is a method for obtaining highly catalytically active nanocomposites [16]. In addition, the manufacturing of a ternary composite material has turned into an effective tactic to increase the absorption of solar light and photocatalytic capability [17, 18]. The fabrication of ternary nanocomposites keeps many advantages to itself, such as adjustment of band gap energy, efficient charge carrier, and high catalyst activity. It is reported that the combination of two or more semiconductors provides these nano-architectural nanomaterials with new proeprties and access to new applications [19, 20].
Herein, the new-structured ternary AgFeNi2S4-Graphene-TiO2 nanocomposite was synthesized via modified solvothermal method. The photocatalytic activity of the ternary photocatalyst was evaluated for the CO2 photoreduction under the light irradiation (λ = 254 nm and 565) with two-different electron-donor scavengers. The catalytic activity test confirmed that the final ternary photocatalyst exhibits high activity for methanol production with 8.62%, 7.23%. The morphological, optical and electrochemical properties of the ternary photocatalyst were studied and each results pointed-out that ternary nanocomposite was successfully synthesized.
2.1 Materials
Silver nitrate AgNO3 (≥98 %), Iron (III) bitrate nonahydrate Fe(NO3)3·9H2O (99.9 %), Nickel (II) nitrate hexahydrate Ni(NO3)2·6H2O (≥99 %), Sodium thiosulfate Na2S2O3 (≥99 %), Citric acid C6H8O7 (≥99.5 %), were procured from Duksan Pure Chemical Co. Ltd (Korea). Hydrochloric acid HCl (36 wt%), Sulfuric acid H2SO4 (≥97 %), Zinc nitrate hexahydrate Zn(NO3)2·6H2O (≥99.5 %), Scavenger (Na2SO3 (97 %), Na2S (98 %)), were procured from Samchun Pure Chemical Co.LTD (Korea). The natural graphite powder is a precursor material of graphene. All chemical reagents had an analytical class and organic-solvents were used with deionized water.
2.2 Synthesis of the quaternary nanocomposite
The quaternary nanocomposite was synthesized by a hydrothermal method. The precursor solution was prepared using a 3: 2 ratio of ethylene glycol (C2H6O2) and chelate-cationic citric acid (C6H8O7). The 0.02:0.03:0.04:0.08 mmol ratio of precursor reagents were dispersed into the citric-acid solvent and stirred at 60 ℃ for 6 h until it becomes viscous. The process of preparing the mortar is called chelating, and its main function is to establish a chemical bond between the transition metal and the organic molecules in order to adjust the metal chain.
The mixture was transferred into 100 ml Teflon-line clave and heated at 150 °C for 15 h, then allowed it to cool to room temperature (25 °C). The final product was washed by DI-water and dried at 100 ℃; then the powder was calcined at 800 ℃ for 4 h. The final nanomaterial was denoted as AFNS.
2.3 Synthesis of ternary nanocomposite
The binary and ternary composite prepared by a modified solvothermal method. The graphene was prepared by a Hummer Offeman’s method [18] and more detailed information was described previously [22]. First, the organic solvent was prepared using absolute ethanol and DI water (volume ratio = 5:4) with continuous stirring at room temperature. Then, 0.7 g of the as-prepared AFNS added into the solvent, stirred it for 1 h, and then added 0.5 g graphene. After stirring for 6 h, transfer the solution to a 100 ml Teflon-lined stainless-steel autoclave and heat-treated at 150 °C for 15 h, and then cooled to 25 °C. The final product is rinsed with DI water, dried at 90 °C until dry, and then calcined under the same conditions. The as-prepared sample was denoted as AFNSG.
The next step is TiO2 combined with AFNSG. The molar ratio of ethanol to H2O to TNB of 30 : 15 : 4 and stirred it continuously for 1 h. Add 0.5 g of AFNSG nanocomposites to the prepared solution, stirred at room temperature for 6 h, then transfer the solution to an autoclave and kept in an electric oven at 150 °C for 15 h. The obtained product was rinsed with DI-water and dried until it became a powder, which was calcined under the same conditions. The final sample renamed AFNSGT. The morphology state and electrochemical analysis method was detailly explained in the supplementary material.
2.4 CO2 photoreduction test of AFNSGT nanocomposite
The photoreduction of CO2 was conducted in three-part closed reactor under the light irradiation (Scheme S1). Two different electron-donor scavengers were used in this experiment, which could provide a cyclic-electron supplier to increase the catalytic activity of the photocatalyst. First, 0.04 M NaHCO3 solution was prepared. Then, 0.1 g of photocatalyst and scavengers were dispersed in solvent and stirred for 1 h. A high pure input gas (CO2, 99.99 %) was purged into the mixture to obtain a gas/solvent mixture; the gas was controlled by the mass flow controller and the total gas-purging time was 30 min. Next, the pure nitrogen was purged into the mixture to remove the gas from the glass-reactor. The lamp was then switched on and the light source (500 W halogen lamp) was placed at the top of the reactor at a distance of about 10 cm. The total reaction time was 48 h, and the reactor was cooled every 12 h. The final solution was withdrawn from the reactor using a syringe and a membrane filter with a pore size of 0.45 μm.
The 500 W metal halide lamp as the light source, and the light source place at the top of the reactor which had a distance around 10 cm. In this experiment, two different electron-donor scavengers were used, and it can provide a cyclic electron supplier which can boost the catalytic of the photocatalyst. In detail, the 100 mg of photocatalyst and scavengers were dispersed in 0.04 M NaHCO3 containing 50 ml solvent and stirred for 1 h. The pure input gas was controlled by the mass flow controller and the total gas-purging time was 30 min. The total reaction was 48 hours, and every 12 hours, a solution of a certain volume was withdrawn from the reactor using a syringe, and the solution was filtered through a membrane filter with a pore size of 0.45 μm and a diameter of 47 mm. The alcohol amount of the solution was analyzed by a “Quantitative analysis of alcohol” method. In alcohol analysis, 10 ml of 0.1 M CrO3 added into 1 ml sample and agitated it for 15 min, then centrifuged the suspension (10000 ppm/15 min). The concentration of acquired solution examined by a UV spectrophotometer (Optizen POP, Korea) using a quartz cell (1 cm × 4.5 cm). The functional group of the final methanol was analyzed by a FTIR spectrometer (FTIR iS5, Thermoscience).
3.1 Phase composition
The crystal structures of all samples are shown in Figure 1. The XRD result basically expresses the characteristics of each sample. The XRD peak intensity of AFNSG and AFNSGT had become sharp, which showed that each sample had decent crystalline state. The FWHM amounts of the XRD-patterns were decreased and crystallite size increased due to the decent crystallinity of the AFNSG and AFNSGT nanocomposites.
The diffraction peaks were located at 2θ of 21.87 and 41.48 ° assigned to the (112) crystal planes of Ag2S (JCPDS. 14-0072). In addition, the diffraction peaks at 2θ of 30.92, 37.75 and 55.28 ° were assigned to the crystal planes of FeNi2S4 (JCPDS. 96-900-0979). Other diffraction peaks corresponded to the crystal phase of AFNS. After combining with graphene, the diffraction peak became sharp and the diffraction peak of Graphene was observed at 2θ of 14.41°, corresponding to the (100) crystal plane. The peak intensity was low because of less quantity. In AFNSGT nanocomposite, the XRD pattern of TiO2 were observed at 2θ of 25.14, 48.01, 55.12, 62.71 and 74.89 °, which were assigned to the (101), (200), (121), (024) and (125) crystal planes of anatase TiO2 (JCPDS №.21-1272). The reference XRD peak of anatase TiO2 and ternary nanocomposite data was suggested in Figure S1. The catalytic activity of the anatase is more active than the rutile phase, the electron-hole pair life of anatase is favorable for the surface reaction. In addition, the crystal facet [(101), (010), (001)] of anatase had different catalytic activity. According to the obtained XRD result, an above-mentioned peak was observed, it is confirming that a combination of TiO2 and AFNSG can show high catalytic activity.
The crystallite sizes of each nanocomposite were calculated using a Debye-Scherrer equation and found them to be 9.04, 12.65, and 1.41 nm. The crystallite sizes of a particle can affect the catalytic activity of the photocatalyst. There are several published research paper that analyzed the effect of crystallite size on photocatalytic performance.
The chemical states and interactions among AgFeNi2S4, graphene, and TiO2 were analyzed by XPS analysis. Figure 2 shows the XPS spectrum of each element and the binding energy value depend on the chemical interaction and formation of the samples. Figure 2 (a) shows the two peaks at 368.44 and 378.15 eV binding region, which are related to the Ag3d spectrum of Ag (I) in AFNSGT [23]. The XPS spectrum of Fe2p (Figure 2 (b)) displayed the four deconvoluted peaks 711.35, 714.34, 724.07, and 726.47 eV. The photoelectron peak at 711.35 eV corresponds to the binding energy of Fe3+ 2p 3/2; the peaks at 724.07 eV can be assigned to the Fe2+ 2p 3/2. The peak at 726.47 eV can be corresponded to the 2p 1/2 of Fe (II) and Fe (III) ion [24]. The last peak in the 714.34 binding-energy region is a satellite peak that indicates the coexistence of Fe (II) and Fe (III) in the quaternary nanocomposite. Figure 2 (c) shows the Ni2p XPS spectrum was deconvoluted into two spin-orbit doublets. The photoelectron peaks at 856.47 and 874.46 eV indicate the 2p 3/2 and 2p 1/2 spin orbitals of Ni3+. The other two peaks assigned to the high spin divalent state (satellite peaks) of Ni2+ [25].
The S2p XPS spectrum consisted of four peaks, located in the 159.34, 160.19, 163.28, and 165.06 eV binding-energy regions, as shown in Figure 2 (d). These four peaks can be assigned to monosulfide (S2-) and disulfide (S22-) [26]. The XPS peaks of sulfide were placed at 158~161 eV, and the disulfide peaks were located in the 162~168 eV binding-energy region. The O1s spectrum is composed of four peaks, located in, the 529.51, 530.39, 531.63 and 533.09 eV binding-energy regions. The first-peak expresses the C-O group, whereas the second peak assigned to the metal-carbonate forms (O-Me) [27], as shown in Figure 2 (f) [28]. The existence of the metal carbonates form confirms the interaction between metal and oxygen. The next two peaks correspond to the carbonyl and carboxyl groups.
The high resolution Ti2p spectrum of AFNSGT displayed the two peaks at 458.85 and 464.75 eV, which are related to the Ti4+2p 3/2 and Ti4+2p 1/2. In addition, 2p 3/2 spin-orbitals clearly determined the Ti (IV), and the ratio of these two peaks are 2:1, as shown in Figure 2 (g) [29].
3.2 Morphology characterization
The surface of the photocatalyst was analyzed via SEM and TEM. Figure 3 (a)-(f) show the SEM analysis of the quaternary, binary, and ternary nanocomposites. The quaternary nanocomposite had wrinkled and elliptical morphology, as shown in Figure 3 (a) and (b). After combining with Graphene, all particles agglomerated on the graphene exterior, because of the functional group of the graphene surface. The variously structured particles were irregularly agglomerated, as shown in Figure 3 (c)-(d). In SEM image of AFNSGT, the TiO2 particle showed the round and pentagonal structure. Figure 3 (e) and (f) show the successful fabrication of the AgFeNi2S4-Graphene-TiO2. Furthermore, the successful interconnection of the AgFeNi2S4,Graphene and TiO2 can be helpful for the hetero-junction structure with the high charge carrier properties. Because the role of graphene is bridge and electron, acceptor which can support the photogenerated charge carrier and increase the photocatalytic capacity.
Additionally, the quantitative element analysis was explored by EDX instrument. Figure 3 (g) shows the microanalysis of all as-synthesized samples, which reveal the presence of the main elements. The Ag, Fe, Ni, S, Ti, and O were obtained from the metal and metal-oxide component, and the C was derived from the main adsorbent material of graphene in the ternary photocatalyst. Each element had its own Kα and Kβ values in the proper region. These elemental analyses are summarized in the bit graph.
The internal structure and crystallographic facet of each nanocomposite are analyzed by TEM and HRTEM. Figure 4 (a) and (b) show the presence of the quaternary nanocomposite as elliptical with graphene, this result indicates the successful interaction of AFNS and graphene. The morphology of graphene was clear and provided the large surface needed for the metal compound to grow on the exterior, as shown in Figure S2 (a, b).
Figure 4 (d) and (e) show that the pentagonal TiO2 occurred as dark-black and was uniformly spread on the graphene exterior in the AFNSGT ternary nanocomposite. TiO2 and quaternary nanocomposites are evenly distributed on the surface of graphene, and the oxygenated-functional group on the graphene exterior prevents the formation of metal or metal oxide agglomerates. Figure 4 (c) and (f) depicted the crystallographic facets of each nanocomposite via HRTEM. The lattice fringes with d-spacing values of the quaternary and TiO2, which were 0.236 nm and 0.353 nm, which correspond to the AFNS (201) and TiO2 (101) crystal planes, respectively, as shown in Figure 4 (c) and (f). The average particle-size histogram with an interactive 3D surface plot of the quaternary, binary, and ternary nanocomposites are shown in Figure 5. The calculated average particle sizes were 3.29 nm (AFNS in AFNSG), 2.49 nm (AFNS in AFNSGT), and 2.85 nm (TiO2 in AFNSGT). The particle size state is shown in Figure 5 (a)~(c). According to the 3D surface plot result, the roughness of AFNSG was uneven and convex, and the AFNSGT nanocomposite had a smooth-convex surface, as shown in Figure 5 (d).
The carbon material state (D and G-band), molecular interaction between AgFeNi2S4, graphene, and TiO2 were confirmed by performing the Raman spectroscopy. The full Raman data of the binary and ternary nanocomposites are shown in detail in Figure 6. Graphene had two sharp peaks in the 1337.87 and 1564.17 cm-1 shift region, which indicates the A1g symmetry and E2g symmetry (D mode and G mode). The quaternary nanocomposite had two peaks in the 104.8 and 379.3 cm-1 regions. According to published articles, chalcogenide-based nanocomposites had characteristic peaks in the 100-500 cm-1 regions [30]. Some main peaks were not observed, because of the modification of the crystal lattice vibrations of the nanomaterial. The AFNSGT included four main peaks at 136.62, 259.13, 391.54, and 585.26 cm-1, all assigned to the TiO2. The Raman band of anatase-structured TiO2 was obtained in the 100-700 cm-1 shift region, which included the Eg, B1g, and A1g modes. The Eg mode peak appeared at 136.62 and 585.26 cm-1, the B1g mode peak at 391.54 cm-1, and the last one was the SEO peak at 259.13 cm-1, which indicates the motions of atoms. The characteristic peaks of graphene and the quaternary nanocomposites were not obtained in AFNSGT, because the symmetric motion of graphene was distorted and the peak intensity of TiO2 was sharp and strong. After we magnified the Raman peak of AFNSGT, the characteristic peaks of graphene were obtained at 1420.52 and 1534.85 cm-1 with low intensity.
The charge transfer and interactions between AFNS, TiO2, and Graphene were studied using a DRS, Photocurrent response, PL, and EIS method. The band gap energy value of each nanocomposite was computed by UV-vis DRS, using Equation [2] [31]:
[hvF (R∞)]1/n =A(hv Eg ) [2]
where Eg is the energy of the band gap, F (R) (1 R)2/2R is the Kubelka-Munk function, A is the constant of proportionality, and F (R) is the absorption coefficient, hv= hc/λ is the energy of the incident photon.
All samples had a light response in the Vis-light region and near-UV light, as shown in Figure 7 (b). The calculated band gap of each nanocomposite was 2.34, 2.24, and 2.96 eV, which was lower than that of pure anatase TiO2, as shown in Figure 7 (a).
The quaternary nanocomposite had a visible-light response because of the band gap energy. After being combined with graphene, the band gap value was reduced. Graphene has good electron conductivity and mobility and can increase the separation of charge carriers. After being combined with anatase-structure TiO2, the band gap value increased from 2.24 to 2.96 eV. The pure anatase TiO2 has 3.20 eV of band gap energy and had high catalytic activity with long-term stability but has fast electron-hole recombination with poor adsorption. Our obtained band gap value was lower than that of pure TiO2. Furthermore, as-prepared -nanocomposite had a vis-light response with low band gap value.
The photocurrent response of all samples showed repeatable signals under six on-off cycles, as shown in Figure 7 (c). All nanocomposites had a prompt and stable photocurrent response for each cycle. The photocurrent response decayed in the dark-condition but recuperated again once the light was on within 30 s.
The above procedure can be described in terms of the presence of charge transmission from the VB to the CB under the light radiation. The pure quaternary nanocomposite had a smaller current value (3.95×10⁻⁶ mA/cm2) in every cycle, which had low separation efficiency of the photo generated charge. AFNSG has efficient photo generated charges because of its good photocurrent response (1.12×10⁻⁵ mA/cm2); the graphene supports the charge separation and promotes the electron flow in the light-on state. AFNSGT showed a higher photocurrent value (8.75×10⁻⁶ mA/cm2) than did AFNS during six on-off cycles of light irradiation.
The final ternary photocatalyst can show better catalytic activity than that of the pure quaternary nanocomposite because of its efficient separation of photogenerated charges and interfacial contact among AgFeNi2S4, Graphene, and TiO2.
The charge separation capability of the AgFeNi2S4-Graphene-TiO2 was analyzed by the PL method. The intensity of PL depends on the recombination rate of the electron-hole pairs, and a decrease in PL intensity indicates the long lifetime of the charge carrier among the semiconductors. All photocatalysts showed a light response under the 514 nm laser, as shown in Figure 7 (d). The emission peaks of samples were appeared in the 550-650 nm range which related to the visible light region. In the PL spectra, two sharp emission peaks appeared at 552.99 and 560.37 nm wavelength regions. Additionally, the pure AFNS had a low-intensity wide emission peak in the 604.66 nm area, but the peak intensity was reduced in AFNSGT.
The emission peak of the metal-based composite was classified in two sector: (1) UV emission (NBE), (2) Visible emission (DF defect) [32]. The PL intensity of pure AFNS was high because of rapid charge recombination. After being combined with carbon-material and TiO2, the PL intensity was reduced because of efficient interfacial contact between each part, which bolster the charge carriers transmission. The low PL intensity with the recombination rate of electron and holes, which is related to rapid conversion from CO2 into hydrocarbon fuel.
Figure 7 (e) shows the electrochemical impedance spectroscopy (EIS) of all samples; the EIS profile is identical to the charge transmit resistance across the electrode/electrolyte. The wide semicircle profile can confirm the poor charge carrier with low conductivity. Conversely, the small semi-circle can explain the high conductivity with an effective charge carrier, which can confirm the high catalytic performance of the photocatalyst. Figure 8 (e) shows the Nyquist plot of all samples at room temperature for the frequency range 5 mHz and 1 mHz with half-cell. The AFNSG sample had a smaller semicircle than did the pure AFNS and AFNSGT. The size of the semicircle depends on the chemical composition and inter-connection of each AFNS, Graphene, and TiO2. Graphene had a small semicircle profile, because its high electrical conductivity can sustain the conductivity of the quaternary chalcogenide nanocomposite. In addition, the semicircular profile of the AFNSGT ternary nanocomposite is located between AFNS and AFNSG, depending on the electrical conductivity of AFNS, graphene, and TiO2.
A NiS-based or quantum dot united with carbon or a semiconductor photocatalyst is mostly used for H2 evolution [33-35]. According to a published paper [36-38], some research papers reported on the NiS-based photocatalyst used for CO2 reduction under light illumination. Generally, a one-spot and seed-mediated hydrothermal method and a sol-gel method are used to prepare NiS photocatalysts [1, 2]. In addition, the binary photocatalyst showed a high charge-transfer property and good conductivity. All the analysis results confirmed that the prepared binary photocatalyst can show high stability and photoactivity for CO2 reduction. According to all the electrochemical analysis result, the AFNSGT ternary nanocomposite had successful formation and a high interconnection with highly efficient charge transfer, and suppression of the photogenerated e- and h+ recombination rate; all those factors can upgrade the photocatalytic reduction of CO2 into hydrocarbon products. Compared to the electrochemical result of binary nanocomposites, the ternary nanocomposite showed a low result, but the combination of anatase-TiO2 with graphene and metal nanocomposite had high photocatalytic activity. Also, the combination of 2D graphene and TiO2 with a metal nanocomposite had more intimate contact, superior electronic coupling, and a more sensitive photosensitizer, which can lead to better CO2 reduction under light irradiation [39]. Based on the results of the above studies and the results of our study, we assume that the ternary nanocomposite has high photocatalytic activity for CO2 reduction.
3.3 Photocatalytic performance and reduction of CO2
The final ternary AgFeNi2S4-Graphene-TiO2 was used for the photocatalytic reduction of CO2 with two different electron-donor scavengers (Na2SO3 and Na2S). Figure 8 shows the quantification of the final methanol yield. The final concentration of methanol was analyzed by the "Quantitative Analysis of Alcohol" using CrO3 as a strong oxide agent. During the experiment, the final methanol was oxides, and the oxidation state of CrO3 decreased. Then, the color of the base solution was changed. Briefly, as the methanol concentration increases, the oxidation state of CrO3 decreases, and the color of the base solution changes accordingly.
Figure 8 (a) and (c) show the final product yield with different amounts of Na2SO3 under light irradiation. The final product yield increased when the amount of electron donors increased from 0.2 to 0.6 g. The methanol yields increased from 4.05 to 6.25 % when the scavenger amount increased (0.2, 0.4, and 0.6 g) after 48 hours under vis-light irradiation.
With 0.2g of a scavenger, the final product yield was 0.56, 2.01, 3.74, and 4.05 %, while using a 0.4 g of a scavenger, the yield was 1.94, 2.16, 2.74, and 5.19 % under the visible light irradiation. The highest methanol yield was found when using 0.6 g of Na2SO3, and the methanol yield was 1.80, 2.50, 4.53, and 6.25 % after 12 to 48 hours under the vis-light. Under the UV-light, the methanol yield was 0.54, 2.95, 4.77, and 6.03 % with 0.2 g, and the yield was 0.85, 2.13, 5.55, and 7.17 % with 0.4 g of Na2SO3. When using a 0.6 g scavenger, the final product yield was 1.17, 2.24, 6.80, and 8.62 % after 12 to 48 hours under light irradiation. The final hydrocarbon fuel amount increased with various quotas of scavengers under the UV-light irradiation, because of the photon energy of each light source.
To determine the effect of the Na2SO3 scavenger, we used another scavenger (Na2S) under the same condition. Figure 8 (b) and (d) show the methanol yield with different quotas of Na2S scavenger under illumination. The final product yield was 0.54, 1.00, 2.07, and 3.59 % with low amount of scavenger, and the yield was 0.55, 1.72, 2.29 and 4.97 % with 0.4 g of Na2S. When using 0.6 g of Na2S, the final product yield was 0.48, 2.59, 3.34 and 5.92 % after 12 to 48 hours under the vis-light. After 48 h, the maximum alcohol yields were determined at 5.09, 6.03, and 7.23 % under UV light, and different amounts of Na2S electron donor suppliers were used during the experiment.
The stability and reusability are the main factors that define the sturdiness of a photocatalyst in practical application. In the recycling test, the photocatalyst (AFNSGT) was used six times (288 h) under light irradiation with two-different scavengers (0.6 g) in CO2 evolution. The ternary photocatalyst was very sturdy during six recycles with no significant deactivation towards methanol production, as shown in Figure 9. According to the recycling test, the ternary photocatalyst can be considered for generating solar fuels in a practical application.
From the results of the above experiments, it can be concluded that the best CO2 reduction was obtained in the UV light region, because it can supply the efficient photon energy which can activate the photocatalyst. A scavenger (sodium carbonate and sodium sulfide) with a cyclic electron donor/supplier can boost the photoactivity of a graphene-based ternary photocatalyst because it allows that CO2 combined with water. More specifically, there are two reasons: (i) an increase in the amount of dissolved CO2 (ii) and reduction of the recombination of hole–electron pairs, leading to a longer decay time of surface electrons and facilitation of CO2 reduction. To identify the presence of the final products and semi-product, the FTIR technique was used. The final methanol (after 1 and 6-cycles) and commercial methanol solution were used in this FTIR analysis. The FTIR spectrum of methanol shown in Figure 10, consisted of four characteristic peaks located at theoretical peak region and all data keys are summarized in Table 1. The FTIR spectrum of all samples was exhibited in a range of 800-4000 cm-1. The peak location and intensity of the reference and methanol products were the same which confirms that the ternary photocatalyst reduced the CO2 into methanol. During the test, the semi-product was withdrawn from the reactor and analyzed by FTIR. This result suggests that the chemical structure of CO2 had changed, and it confirmed that carbon dioxide can be reduced to methanol.
All used photocatalyst was collected, rinsed with water, and dried at 100 °C in an oven. The crystal structure of the photocatalyst before and after the experiment analyzed via XRD measurement. There is no significant change obtained from the XRD pattern and this result confirmed the stability of the photocatalyst. XRD pattern of the samples displayed in Figure 11. The XRD pattern of the photocatalyst before and after the experiment confirmed the stability and reusability of the material. Currently, the research paper on the quaternary chalcogenide-based nanocomposites for CO2 reduction has not been published. There are several ternary chalcogenide photocatalysts, for CO2 reduction such as ZnO/ZnSe [40], CeO3/ZnInS2 [41] and CuInS2-TiO2 heterojunctions [42]. The AgFeNi2S4-Graphene-TiO2 exhibits higher photocatalytic CO2 conversion activities than did the other ternary chalcogenide photocatalysts. Therefore, noble-metal joined quaternary chalcogenide catalyst can still achieve high-efficiency CO2 reduction.
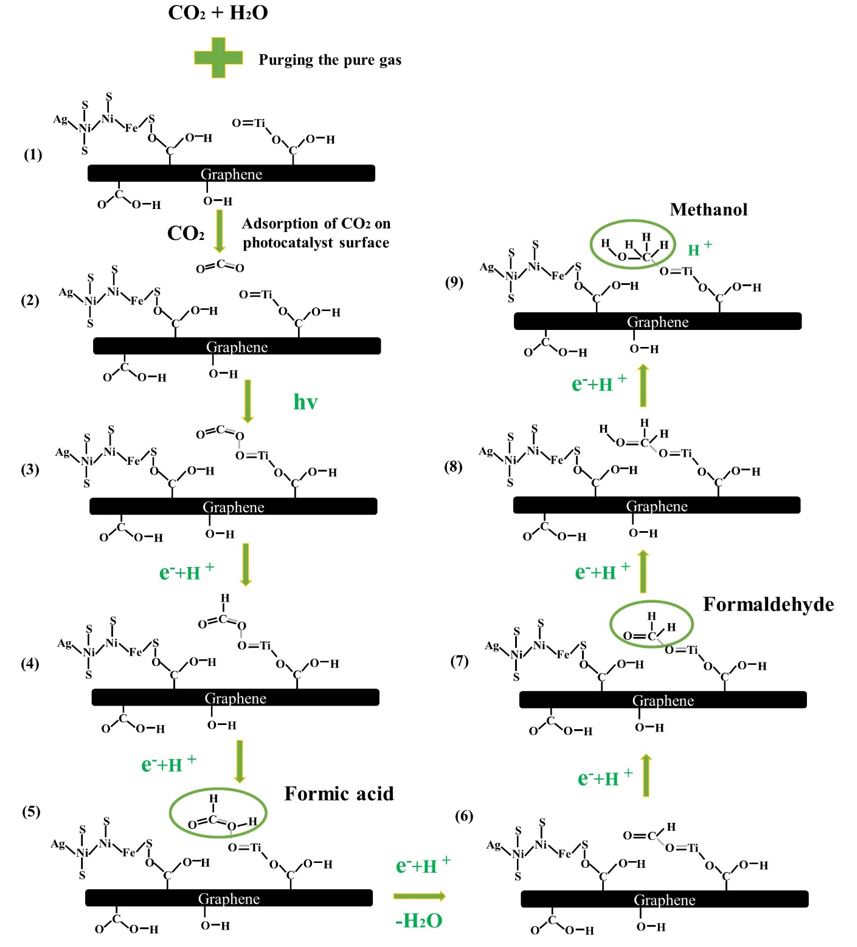
The pathway of CO2 reduction was described in Scheme 1 and chemical reaction was suggested in below part. The reduction process of CO2 to methanol is unique due to the reaction pathways. In general, the reduction of CO2 needs more negative potential level in conduction band, the water oxidation needs more positive level in valence band, thereby increasing the number of protons and enhancing the reduction of carbon dioxide. Under the vis/UV light irradiation, both AgFeNi2S4 and TiO2 were absorbs the photon’s energy, the electron can be excited from VB to CB. Graphene can accelerate the charge carrier between AFNS and TiO2 and suppress the recombination of charges.

Eqs. (1)~(4) describe the activation of AgFeNi2S4, TiO2, and graphene, which enables them to produce the photoexcited electron-hole pairs. Eqs. (6-9) describe the redox reaction, where the holes are used for oxidation and electrons are used for the reduction process. The positive-charged holes reacted with water to form hydrogen, and the hydrogen source is favorably activating the formation of methanol. Meanwhile, the purged CO2 was adsorbed on photocatalyst surface, thereby the photo-excited electrons on the surface can reduce/convert the CO2 into methanol. The conversion of CO2 into CH3OH required 6e- /6H+.
In summary, we successfully synthesized the graphene-based ternary photocatalyst containing a chalcogenide nanocomposite (AgFeNi2S4) by a modified solvothermal method. The as-prepared samples analyzed with some spectroscopic techniques for the confirmation of catalytic activity of the photocatalyst for the CO2 reduction into hydrocarbon fuels with two different scavengers. The final photocatalyst showed high conversion efficiency because of efficient separation of photogenerated charge (e- and h+) and strong interfacial contact among AgFeNi2S4, Graphene, and TiO2. The methanol yield was 6.25 and 8.62% under the visible and UV light irradiation when using 0.6 g of the Na2SO3 scavenger. In addition, the yield was 5.92 and 7.23 % when using the same amount of Na2S scavenger. The two scavengers that provided the different values of cyclic electron donor/supplier can boost the photoactivity and it allow the CO2 to be combined with water. The reusability of the ternary catalyst was high after six cycles, which confirmed that the as-prepared catalyst can be useful for the practical applications. In this work, we used the quaternary chalcogenide nanocomposite loaded graphene-based photocatalyst to support the benefits of a heterogeneous system and developed the evolution rate of CO2 into liquid methanol (CH3OH).
- Hao, Q., Rui-Tang, G., Xing-Yu, L., Xu, S., Zhong-Yi, W., Jun-Ying, T., Wei-Guo, P. 0D NiS2 quantum dots modified 2D g-C3N4 for efficient photocatalytic CO2 Colloids and Surfaces A, (2020), 600, 124912.
- Jae, H. L., Sung-Il, K., Sun-M. P., Misook, K. A p-n heterojunction NiS-sensitized TiO2 photocatalytic system for efficient photoreduction of carbon dioxide to methane. Ceramics International, (2017), 43, 1768-1774.
- Ali, A., Nguyen, D. C. T., Cho, K. Y., Oh, W. C. A simple ultrasonic-synthetic route of Cu2Se-graphene-TiO2 ternary composites for carbon dioxide conversion processes, Fullerenes, Nanotubes and Carbon Nanostructures, (2018), 26:12, 827-836.
- Min, Y., He, G., Xu, Q., Chen, Y. Dual-functional MoS2sheet-modified CdS branch-like heterostructures with increased photostability and photocatalytic activity, J Mater Chem A, (2014), 2, 2578-2584.
- Devi, S., Korake, P., Achary, S.N., Gupta. N.M. Genesis of increased photoactivity of CdS/Nixnanocomposites for visible-light-driven splitting of water, Int J Hydrogen Energy, (2014), 39, 19424-19433.
- Zhang, W., Xu, R. Surface engineered active photocatalysts without noble metals: CuS-ZnxCd1−xS nanospheres by one-step synthesis, Int J Hydrogen Energy, (2009), 34, 8495-8503.
- Zong, X., Han, J., Ma, G., Yan, H., Wu, G., Li, C. Photocatalytic H2evolution on CdS loaded with WS2 as cocatalyst under visible light irradiation, J Phys Chem C, (2011), 115, 12202-12208.
- Santhosh, K. M. C., Pradeep, B. Electrical properties of silver selenide thin films prepared by reactive evaporation, Bull Mater Sci., (2002), 25, 407-411.
- Ya, N.L., Yan, L., Long-long, Q., Xiao, T.W., Jian, W., Cheng, W.W. Excellent photocatalytic performance from NiS decorated TiO2 nanoflowers with exposed {001} facets, Materials Research Bulletin, (2020), 130, 110945.
- Xuan, W., Hao, D., Sijia, S., Han, Z., Run, Z., Yangzi, L., Yu, L., Jie, W. Preparation of a temperature-sensitive superhydrophobic self-cleaning SiO2-TiO2@PDMS coating with photocatalytic activity, Coat. Tech, (2021), 9, 126853.
- Tian, H., Shen, K., Hu, X., Qiao, L., & Zheng, W N. S co-doped graphene quantum dots-graphene-TiO2 nanotubes composite with increased photocatalytic activity, Journal of Alloys and Compounds, (2017), 691, 369–377.
- Choi, K.H., Park, S.Y., Park, B.J., Jung, J.S. Recyclable Ag-coated Fe3O4@TiO2for efficient photocatalytic oxidation of chlorophenol, Coat. Tech., 320 (2017), pp. 240-245
- Zhang, P., Wang, T., Gong, J. Mechanistic Understanding of the Plasmonic Enhancement for Solar Water Splitting, Mater., 27 (2015), pp. 5328-5342
- Eda, G., Fanchini, G., Chhowalla. M. Large-area ultrathin films of reduced graphene oxide as a transparent and flexible electronic material, Nature Nanotechnology, (2008), 3, 270-274.
- Stankovich, S., Dikin, D.A., Dommett, G.H.B., Kohlhaas, K.M., Zimney, E.J., Stach, E.A., Piner, R.D., Nguyen, S.T., Ruoff, R.S. Graphene-based composite materials. Nature, (2006), 442, 282-286.
- Tian, H., Wan, C., Xue, X., Hu, X., Wang, X. Effective Electron Transfer Pathway of the Ternary TiO2/RGO/Ag Nanocomposite with Increased Photocatalytic Activity under Visible Light, Catalysts, (2017), 7,
- Huang, H., Liu, K., Zhang, Y., Chen, K., Zhang, Y., Tian, N. Tunable 3D hierarchical graphene-BiOI nanoarchitectures: Their in-situ preparation, and highly improved photocatalytic performance and photoelectrochemical properties under visible light irradiation, RSC Adv., 4 (2014), pp. 49386-49394
- Oh, W.C., Zhang, F.J. Preparation, and characterization of graphene oxide reduced from a mild chemical method, Asian J. Chem. 23 2011, 875.
- Yan, Y., Sun, S., Song, Y., Yan, X., Guan, W., Liu, X., Shi, W. Microwave-assisted in situ synthesis of reduced graphene oxide–BiVO4 composite photocatalysts and their increased photocatalytic performance for the degradation of ciprofloxacin, J. Hazard. Mater., (2013), 250, 106–114.
- Rajendran, R., Shrestha, L.K., Minami, K., Subramanian, M., Jayavel, R., Ariga, K, Dimensionally integrated nanoarchitectonics for a novel composite from 0D, 1D, and 2D nanomaterials: RGO/CNT/CeO2 ternary nanocomposites with electrochemical performance, J. Mater. Chem. A, 2 (2014), pp. 18480-18487.
- Zambaga, O., Oh, W.C. Photocatalytic CO2 reduction with Graphene-based semiconductor, Journal of Multifunctional Materials and Photoscience, 10 ( 2019), pp. 127-140.
- Zambaga, O., Kwang Y.C., Oh, W.C. Novel Micro and Nanostructure of AgCuInS2-Graphene-TiO2 Ternary Composite for Photocatalytic CO2 Reduction for Methanol Fuel, ACS Omega, 5 (2020), 26389–26401.
- Gondal, M.A., Suliman M.A., Dastageer, M.A., Gaik-Khuan Chau., Basheer, C., Dan Yang., Suwaiyan, A. Visible Light Photocatalytic Degradation of Herbicide (Atrazine) using Surface Plasmon Resonance Induced in Mesoporous AgWO3/SBA-15 Composite, Journal of Molecular Catalysis A: Chemical, (2016), 425, 208-216.
- Hongliang, P., Zaiyong, M., Shijun, L., Huagen, L., Lijun, Y., Fan, L., Huiyu, S., Yiliang, Z., Bingqing, Z., High Performance Fe- and N- Doped Carbon Catalyst with Graphene Structure for Oxygen Reduction. Scientific Reports, (2013) 3(1).
- Yang, G., Liwei, M., Wutao, W., Shizhong, C., Zhi, Z., Hongwei, H., Weihua, C. Double Metal Ions Synergistic Effect in Hierarchical Multiple Sulfide Microflowers for Increased Supercapacitor Performance, ACS Applied Materials & Interfaces, (2015), 7(7), 4311–4319.
- Diptiman, D., Md. Estak, A., Sumit, M., Biswajit, M., Shyamal, K. S. Amorphous molybdenum sulfide quantum dots: an efficient hydrogen evolution electrocatalyst in neutral medium, Journal of Materials Chemistry A, (2016), 40, 15486-15493.
- Hui, L., Shuang, , Zhiling, Z., Xiaonan, Ali, A., Nguyen, D. C. T., Cho, K. Y., Oh, W. C. A simple ultrasonic-synthetic route of Cu2Se-graphene-TiO2 ternary composites for carbon dioxide conversion processes, Fullerenes, Nanotubes and Carbon Nanostructures., (2018), 26:12, 827-836.
- Demri, B., Muster, D. XPS study of some calcium compounds, Journal of Materials Processing Technology, (1995), 55, 311-314.
- Hussein, Z., Ming, H., Ang, Moses, O. T. Ta/TiO2-and Nb/TiO2-Mixed Oxides as Efficient Solar Photocatalysts: Preparation, Characterization, and Photocatalytic Activity, International Journal of Photoenergy, (2012), 1–9.
- Pandiaraman, M., Soundararajan, N. Micro-Raman studies on thermally evaporated Ag2Se thin films, Journal of Theoretical and Applied Physics., (2012), 6:7.
- Pyrgiotakis, G., Wolfgang, S. M. X-Ray Photoelectron Spectroscopy of Anatase-TiO2 Coated Carbon Nanotubes, Solid State Phenomena., (2010), 162, 163-177.
- Kumar, S., Bhunia, S., Singh, J., Ojha, A. K. Absence of room temperature ferromagnetism in Fe stabilized ZrO2 nanostructures and effect of Fe doping on its structural, optical and luminescence properties, Alloy. Compd., (2015), 649, 348–356.
- Zhou, X., Sun, H., Zhang, H., Tu, W. One-pot hydrothermal synthesis of CdS/NiS photocatalyst for high H2 evolution from water under visible light, Int J Hydrogen Energy, (2017), 42, 11199-11205.
- Wang, B., Ding, Y., Deng, Z., Li, Z. Rational design of ternary NiS/CQDs/ZnIn2S4nanocomposites as efficient noble-metal-free photocatalyst for hydrogen evolution under visible light, J. Catal, (2019), 40, 335-342.
- Li, G., Sun, Y., Zhang, Q., Gao, Z., Sun, W., Zhou, X. Ag quantum dots modified hierarchically porous and defective TiO2nanoparticles for improved photocatalytic CO2 reduction, Chem. Eng. J, (2021), 410, 128397.
- Tang, J.Y., Guo, R.T., Zhou, W.G., Huang, C.Y., Pan W.G. Ball-flower like NiO/g-C3N4heterojunction for efficient visible light photocatalytic CO2 reduction, Catal. B: Environ., (2018), 237, 802-810.
- Chen, F., Yang, H., Wang, X., Yu, H. Facile synthesis and enhanced photocatalytic H2-evolution performance of NiS2-modified g-C3N4photocatalysts, J. Catal., (2017), 38, 296-304.
- Qin, H., Guo, R.T., Liu, X.Y., Pan, W.G., Wang, Z.Y., Shi, X., Tang, J.Y., Huang, C.Y. Z-scheme MoS2/g-C3N4heterojunction for efficient visible light photocatalytic CO2 reduction, Dalton Trans., (2018), 47, 15155-15163
- Xie, S., Zhang, Q., Liu, G., Wang, Y. Photocatalytic and photoelectrocatalytic reduction of CO2 using heterogeneous catalysts with controlled nanostructures, Commun., (2015), 15, 1-24.
- Shuangfang, Z., Xiaohong Y., Yinan, Z. Increased photocatalytic reduction of CO2 to methanol by ZnO nanoparticles deposited on ZnSe nanosheet, Phys. Lett, 693 2018, 170-175.
- Chao, Y., Qin, L., Yang, X., Kangle, Lv., Mei, L. Increased visible-light photocatalytic CO2 reduction performance of Znln2S4 microspheres by using CeO2 as cocatalyst, Surf. Sci, 464 (15) 2019, 388-395.
- Feiyan, X., Jianjun, Z., Bicheng, Z., Jiaguo, Y., Jingsan, X. CuInS2 sensitized TiO2 hybrid nanofibers for improved photocatalytic CO2 reduction, Catal. B: Environ, 230 (15) 2018, 194-202.
Table 1. Characteristic vibrational group of the final-product from the FTIR measurement.
|
№ |
Vibrational state |
Mode |
Experimental (cm-1) |
Theoretical (cm-1) |
|
1 |
Hydroxyl group |
(O-H) |
3295.34 cm-1 |
3400-3300 cm-1 |
|
2 |
Alcohol group |
C-O-H |
1277.38 cm-1 |
1440-1220 cm-1 |
|
3 |
Methyl group |
(C-H) in (CH3)δ |
1639.71 cm-1 |
1450 cm-1 |
|
4 |
Carbonyl group |
C-O |
1015.54m-1 |
1300-1000 cm-1 |
- scheme1.jpg
CO2 reduction process on the AFNSGT photocatalyst.