3.1 Textural and Morphological properties of Micro-Mesoporus ZSM-5 Composite
Effect of CTMABr as template for creation of mesoporosity was studied by varying CTMABr/SiO2 molar ratio, keeping other composition constant. Fig. S-1 and Fig. 1 represents the powder XRD patterns of ZSM-5, ZSM-5CTA − 0.04, ZSM-5CTA − 0.06 and ZSM-5CTA − 0.1 in as synthesized and H-form, respectively. As shown in Fig S-1, The low angle XRD pattern of as synthesized micro-meso ZSM-5 composite showed only one peak at 2θ° = 2.6 with low intensity, which confirmed generation of mesopores in ZSM-5 [15, 16]. However, the low angle diffraction peaks disappeared upon calcination which is required to remove organic templates (Fig. 1), similar observation is reported by Wang et al[14] with CTMABr and Dimethyl octadecyle as dual template. Wide angle XRD pattern (Fig. 1) of ZSM-5, ZSM-5CTA − 0.04, ZSM-5CTA − 0.06 and ZSM-5CTA − 0.1 exhibits wide-range structural ordering characteristic of MFI type zeolite. As can be seen, no other unidentified/mixed phases were observed, indicated that synthesized samples are having pure MFI phase. Upon addition of CTMABr, the relative crystallinity of micro-ZSM-5 and micro-meso ZSM-5 is quite different. The conventional micro- ZSM-5 has the highest relative crystallinity than micro-mesoZSM-5CTA − 0.04 ( 82%), ZSM-5CTA − 0.06 (71%) and ZSM-5CTA − 0.1(80%). This is mainly due to small framework thickness of micro-meso ZSM-5 along the b-axis direction compared to three-dimensional microporous ZSM-5 zeolite.[17]
The surface area, pore size and pore volume for all synthesized samples are determined by Low temperature (–196oC) nitrogen adsorption-desorption analysis, Fig. 2 depict isotherms for ZSM-5, ZSM-5CTA − 0.04 , ZSM-5CTA − 0.06 , and ZSM-5CTA − .0.1 samples. The conventional ZSM-5 exhibits type I isotherm (IUPAC classification) depicting high uptake at low relative pressures, which is a characteristics of microporous zeolitic structures without mesoposity. This is also confirmed by pore size distribution curve in Fig. S-2, shows a hysteresis loop associated with presence of interparticle voids.[17]
In case of micro-meso ZSM-5CTA − 0.04 , ZSM-5CTA − 0.06 , and ZSM-5CTA − .0.1 display combination of both type І and type IV isotherms[18], indicates the existence of both microporous and mesoporous pores. At low relative pressure (P/P0 < 0.45), isothermsforZSM-5CTA − 0.04 , ZSM-5CTA − 0.06 , and ZSM-5CTA − .0.1 is identical as that of micro-ZSM-5. At higher relative pressure (P/P0 > 0.45), a hysteresis loops appeared in the isotherms of ZSM-5CTA − 0.04 ,ZSM-5CTA − 0.06 , and ZSM-5CTA − .0.1. Hysteresis loops of ZSM-5CTA − 0.06 isotherm is wide, while in case of ZSM-5CTA − 0.04 and ZSM-5CTA − .0.1, a hysteresis loops are relatively narrow, and uneven in pattern. This indicates that ZSM-5CTA − 0.04 and ZSM-5CTA − .0.1 have disordered mesopores and broad pore size distribution. In case of ZSM-5CTA − 0.06 , mesopores is also disorder but pore size distribution is comparatively uniform.[19]
Fig S2 shows the pore size distribution of ZSM-5CTA − 0.04, ZSM-5CTA − 0.06 , and ZSM-5CTA − .0.1. The mesopore size of ZSM-5CTA − 0.04 andZSM-5CTA − .0.1 centered around 2.5 nm, in addition this, ZSM-5CTA − 0.04 have broad mesopore size distribution in 3 to 4nm. In case of ZSM-5CTA − 0.06, pore size is centered around 3 nm and relatively higher intensity indicates a higher and uniform mesopore formation in ZSM-5CTA − 0.06 than ZSM-5CTA − 0.04 andZSM-5CTA − .0.1. As suggested from the shape of hysteresis loops in their isotherms their mesoporous and pore size distribution, meoporous zeolite has mesopore size distribution in the range 2,5 to 3 nm. In contrast, conventional ZSm-5 does not have significant mesoporosity.
Textural property of ZSM-5,ZSM-5CTA − 0.04 , ZSM-5CTA − 0.06 , and ZSM-5CTA − .0.1 sample are tabulated in Table-1. It show that the sample ZSM-5CTA − 0.04 , ZSM-5CTA − 0.06 possess higher external/mesoporous surface area of 72 and 98 m2/g respectively and mesopore volume of 0.09 and 0.10 cc/g, respectively than micro-ZSM-5 (30 m2/g and 0.05 cc/g). The micropore surface area (340 and 323 m2/g) and micropore volume ( 0.15 & 0.14 cc/g) of ZSM-5CTA − 0.04 , ZSM-5CTA − 0.06 respectively are lower than that of micro-ZSM-5 (372 m2/g and 0.16 cc/g ). Higher external/mesoporous surface area and mesopore volume of ZSM-5CTA − 0.04 and ZSM-5CTA − 0.06 confirmed the formation mesoporous without destroying the microporous ZSM-5 framework structure. ZSM-5CTA − .0.1 also possess higher mesopore surface area of 63m2/g and meso-volume of 0.08 cc/g than ZSM-5 however it is lower than ZSM-5CTA − 0.04 and ZSM-5CTA − 0.06 .
Scanning electron microscopy was employed to provide detailed insights into the morphological changes of synthesized micro-meso ZSM-5 composite. Figure 3 represent SEM image of micro-ZSM-5, micro-mesoZSM-5CTA − 0.04, and micro-mesoZSM-5CTA − 0.06. Particle of conventional micro- ZSM-5 is spherical in shape with 1 to 4µm size whereas ZSM-5CTA − 0.04and ZSM-5CTA − 0.06 hows lamellar MFI structure formed as plate like structure stacked into porous spherical aggregate (inset of Fig. 3b & c). Furthermore the surface of ZSM-5CTA − 0.04,and ZSM-5CTA − 0.06 are rough and porous whereas the surface of the conventional micro-ZSM-5 is smooth and porous structure. Laleh Emadadi and Quanyi Wang et. al [11, 15] reported similar type of morphology for mesoporous ZSM-5 synthesized using Diquaternary ammonium surfactant and combination of CTAB and TPOAC as template, respectively.
In order to observe clear morphologies and to confirm mesoporosity, TEM analysis was also performed. Figure 4 depict TEM image of micro-ZSM-5 &optimum micro-meso ZSM-5CTA − 0.06. Figure 4(a) shows fully packed fusion of crystals in compliance with data obtained from SEM. The fusion of crystal arrangement in ZSM-5 is thick with bulky accordance, while in the TEM image of ZSM-5CTA − 0.06 (Fig. 4b), spherical shaped transparency within fused crystal clearly indicates the formation of mesoporous structure whereas it is absent in conventional micro-ZSM-5. This specify that the organic moieties (Anionic surfactant template) could accomplish a better interaction rather than inorganic silicates. Also the magnified TEM image of ZSM-5CTA − 0.06 (Fig. 4c and d)shows a uniform distribution of mesoporous structure. The lattice finges obtained in TEM image of ZSM-5CTA − 0.06 explains the presence of micro and mesopores within the ZSM-5CTA − 0.06 catalyst.
29Si MAS NMR and 27Al MAS NMR were performed to investigate the local coordination environments of silicon and aluminum. Figure 5 (a) represents the 29Si NMR of micro-ZSM-5, micro-meso ZSM-5CTA − 0.04 ,and ZSM-5CTA − 0.06. The spectrum of ZSM-5 shows three resonance peak at -107, -113. and − 117 ppm which were assigned to Si(0Al) (Q4), 3Si(1Al) and crystallographic in equivalent sites of Si(0Al) (Q4) sites, respectively[15, 20]. While spectra of ZSM-5CTA − 0.04 ,and ZSM-5CTA − 0.06 display four resonance peak at -107, -113. -117 and − 100 ppm. Additional peak at-100 ppm may be assigned to silanol group ((SiO)3SiOH, Q3).[20]. However, peak at -100 ppm is absent in conventional micro-ZSM-5. Appearance of silionol group possibly come from mesoporous surface in ZSM-5CTA − 0.04 , ZSM-5CTA − 0.06 , and ZSM-5CTA − .0.1[15].
Figure 5 (b) represents 27Al NMR of micro-ZSM-5, micro-mesoZSM-5CTA − 0.04 , and micro-mesoZSM-5CTA − 0.06. Single resonance peak at ~ 55 ppm assigned to tetrahedral coordinated Al is seen in conventional micro-ZSM-5. On other hand, ZSM-5CTA − 0.04 , and ZSM-5CTA − 0.06 shows two peak centered at ~ 55 ppm and 0 ppm. Peak at 0 ppm is ascribed to the octahedral aluminum, associated with the non framework aluminum species[18]. The generation of mesoporous in ZSM-5 gives signal at 0ppm, which is corresponding decrease in crystallinity of ZSM-5 matches well with XRD patterns.
3.3 Catalytic performance: Fructose to 5-EMF
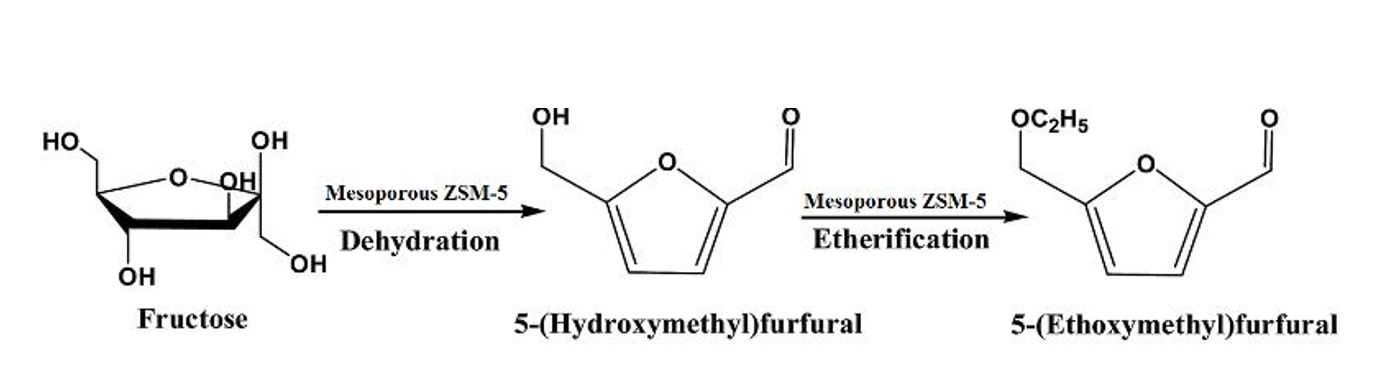
As presented in reaction Scheme 2, synthesis of 5-EMF (biofuel additive) from fructose is occurred with two step reaction mechanism in which first step involve dehydration of fructose to 5-HMF and then etherification of 5-HMF in presence of ethanol to 5-EMF[17, 23]. In addition to acidity of catalyst, mesoporosity, which overcome steric hindrance and improve accessibility of active site, play vital role to improve catalytic performance. Characterization of ZSM-5CTA − 0.04, ZSM-5CTA − 0.06 , and ZSM-5CTA − .0.1 indicated presence of mesoporosity which is beneficial for said reaction in comparison to conventional microporous ZSM-5.
Under identical set of reaction conditions, the performance of ZSM-5, ZSM-5CTA − 0.04 , ZSM-5CTA − 0.06 , and ZSM-5CTA − .0.1 for Fructose to 5-EMF were evaluated. The results are depicted in Fig. 6, after 8 h at 125°C. All studied catalysts provide more than 95% conversion. It is noted that, in order to have complete material balance, there must be other unidentified products, either degradation by-products (humin-type) or intermediates such as ethyl-fructoside, and ethyl glucoside etc.[24] As illustrated in Table 2, micro-ZSM-5 gave 4.6% yield of EMF and 7% of HMF, which is the lowest activity (11.6% combined yield of HMF and EMF) in spite of having acidity, 100% crystallinity and maximum microporosity. In case of micro-meso ZSM-5, 15% EMF yield, 9.2% HMF with 24.2 combined (HMF + EMF) yield was achieved over ZSM-5CTA − 0.04 at similar reaction condition. In another case, ZSM-5CTA − 0.06 showed even more improved activity with 24% EMF yield, 9.5% HMF and 33.5% combined (HMF + EMF) yield. Almost 2 and 3 fold increase in activity over ZSM-5CTA − 0.04 and ZSM-5CTA − 0.06 than ZSM-5 can be attributed to the comparatively higher mesoporous character i.e. Smeso( 72 and 98 m2/g), Vmeso ( 0.09 and and 0.10 cc/g) forZSM-5CTA − 0.04 and ZSM-5CTA − 0.06 respectively than conventional micro-ZSM-5 (Smeso =30 m2/g and Vmeso= 0.05 cc/g). The presence of mesopores in ZSM-5 apparently promotes the access of the reactant to active sites in the interior of mesoporous zeolite. Surprisingly, in spite having sufficient mesopore character ( Smeso =63 m2/g and Vmeso= 0.08 cc/g), ZSM-5CTA − .0.1 gave very low activity of 8% EMF yield, 6% HMF and 14% combined yield. Comparatively higher micropore (Smicro= 405 m2/g, Vmicro=0.196 cc/g) in ZSM-5CTA − .0.1than ZSM-5CTA − 0.04 and ZSM-5CTA − 0.06 (Smicro= 323–340 m2/g, Vmicro=0.140–0.148 cc/g) may restricted the access of the reactant to active sites and resulted in the poor activity.
In view of maximizing the EMF yield, reaction temperature was optimized over optimized ZSM-5CTA − 0.06. The reaction temperature was varied from 125ᵒC to 175ᵒC keeping all other parameter constant. As illustrated in Fig. 6, EMF and combined EMF + HMF yield increases from 24 to 40% and 33 to 46% as temperature increase from 125 to 165ᵒC, respectively. The dehydration of fructose to 5-HMF and later etherification of 5-HMF with ethanol is an endothermic reaction. Hence, EMF yield increased as temperature increased. However with further increases at 175ᵒC, decrease in yield of HMF (4%), EMF (24%) was observed, which is attributed to the reaction path has further proceeded to ethyl levulinate and levulinic acid formation of humins.
At optimized temperature, ZSM-5CTA − 0.06.exhibits 5 fold increase in the EMF % yield and almost 3 fold increase in total yield of EMF and HMF than micropous ZSM-5.