EvoClustRNA workflow
In this work, we propose a new methodology together with ready-to-use implementation (EvoClustRNA), that can contribute to the improvement of RNA 3D structure prediction. The EvoClustRNA method takes as input (i) an alignment file, (ii) a folder with models generated for homologous sequence, and (iii) a file that maps sequence names from the alignment with filenames of models.
The input preparation for the workflow has to be performed manually by the user (Fig 2. 1-2). An input alignment can be obtained from the Rfam database or generated by the user. Sequences in the alignment should be sorted by length, and the redundancy removal procedure should be applied to remove similar sequences. In the proposed protocol, the shortest homologs are modeled using the SimRNAweb server or/and Rosetta. At the final stage of the input preparation, the top 100 models from a simulation should be moved to the input folder for the EvoClustRNA workflow.
We recommend to fold the shortest homologs because the average accuracy of de novo prediction of RNA 3D structure deteriorates with the increased length of RNA (e.g., [10,20]). The volume of the conformational space that needs to be sampled grows exponentially with the chain length [21,22]. Furthermore, de novo structure prediction methods rely on multiple approximations (e.g., coarse-grained representations, crude statistical potentials) thus with the increased size of the system under study small errors accumulate. Moreover, the computational cost increases with the molecule size for the calculation of energy for each conformation, which also increases the computational cost for a fixed simulation length.
When the input files are ready, the next step of the process (Fig 2. 3-4) can be executed. The EvoClustRNA package contains tools to make the process as easy as possible, starting from processing input models to obtain all-vs-all core RMSD matrix (evoClustRNA.py), automated clustering procedure (evoClust_autoclustix.py), ending with a script to calculate the accuracy of prediction (evoClust_calc_rmsd.py). The model of the target sequence with the highest number of neighbors is selected as the final prediction.
The full workflow can be accessed at GitHub https://github.com/mmagnus/EvoClustRNA with the use cases, e.g., for the RNA-Puzzle 13 (https://github.com/mmagnus/EvoClustRNA/tree/master/test_data/rp13).
Blind predictions with EvoClustRNA in the RNA-Puzzles
EvoClustRNA was tested on the RNA-Puzzle 13 problem. The target of 71 nucleotides was an RNA 5-aminoimidazole-4-carboxamide riboside 5′-monophosphate (ZMP) riboswitch, which can up-regulate de novo purine synthesis in response to increased intracellular levels of ZMP [23]. The alignment for this riboswitch was downloaded from the Rfam database (Rfam ID: RF01750), whence ten homologs were selected for modeling with Rosetta. The secondary structures for all homologs were devised with Jalview based on the Rfam alignment. The pseudoknot was suggested in the available literature [24] and it was used for modeling. The EvoClustRNA prediction with an RMSD of 5.5 Å with respect to the reference structure (Fig. 3) was the second in the total ranking of RNA-Puzzles (http://www.rnapuzzles.org/blog/2000/01/01/PZ13-3d/). The final prediction was made based on the visual inspection of the best clusters, which were obtained by using the EvoClustRNA method.
EvoClustRNA was also used in the RNA-Puzzles for modeling problem 14. The RNA molecule of interest was the 61-nucleotide long L-glutamine riboswitch, which upon glutamine binding undergoes a major conformational change in the P3 helix [25]. It was the first RNA-Puzzle, for which the participating groups were asked to model two forms of the RNA molecule: one with a ligand (“bound”) and another one without a ligand (“free”). However, the EvoClustRNA method was used only to model the “bound” form. The alignment for this RNA family (RFAM: RF01739) was downloaded from the Rfam database, whence two homologs were selected for modeling with Rosetta. It was suggested in the literature [26] that the structure included an E-loop motif. This motif was found in the PDB database and was used as a rigid fragment during the modeling. Three independent simulations were performed and the final prediction was obtained in a fully automated manner. The native structure of the riboswitch superimposed on the model obtained with the EvoClustRNA method is shown in Fig. 4. The EvoClustRNA prediction was ranked at the first place in the overall ranking with 5.5 Å RMSD with respect to the native structure (http://www.rnapuzzles.org/blog/2000/01/01/PZ14Bound-3d/). Details of these results were reported in an article describing RNA-Puzzles Round III [10].
Accuracy of prediction for RNA family
To compare the accuracy of predictions for sequences of homologs, the core RMSD was used. The predictions were made for diverse homologous molecules that differed in sequence and length, therefore standard RMSD could not be used. Core RMSD took into account only C3′ atoms of conserved cores. The conserved cores determined based on input alignments were of the same sequence length, so there is always the same number of atoms to be compared (see Methods for details). For each RNA family, one target sequence (sequence of the reference structure taken from the PDB database) and four sequences of homologs were processed. Full names of the sequences and secondary structures used for modeling can be found in the Supplementary data, in the text and the figure, sequences will be referred to with three-letter identifiers. For different sequences that belong to the same Rfam family, divergent prediction accuracy was observed both for SimRNA and Rosetta (Fig. 5).
Interestingly, for 5 out of 8 RNA families for Rosetta and 4 for SimRNA, sequences of homologs yielded more accurate models than folding the target sequence. For example, in the case of the tRNA family, the best models from SimRNA were generated for a tRNA-Lys sequence (accession number: AB009835.1, referred as “tab”) from Drosophila melanogaster (fruit fly). These models reached a core RMSD of 5 Å, in contrast, the best model of the target sequence achieved a core RMSD of 7 Å to the reference structure. Similarly, for the TPP riboswitch, the best models from Rosetta were obtained by folding a sequence from Streptococcus agalactiae (AL766847.1, “tal”).
Surprisingly, SimRNA and Rosetta performed differently for the same sequences. In 26 out of 40 folded sequences, Rosetta outperformed SimRNA (models with the lowest core RMSD to the reference structure). For example, for the target sequence and all sequences of homologs of the THF riboswitch, Rosetta generated more accurate models than SimRNA. Similarly for the RNA-Puzzle 14, Rosetta in the best 100 generated more accurate models for a sequence from the marine metagenome (AACY023015051.1, “cy2“) homolog. In contrast, in the case of the adenine riboswitch, SimRNA generated more accurate models for the target sequence and a sequence from Clostridium difficile (AAFV01000199.1, “a99”).
Together, these data indicated that folding sequences of homologs could potentially enrich with accurate predictions a pool of models taken for clustering. However, to conclusively test if this is the case, we analyzed various variants of the presented here methodology in comparison to the controls. The results are presented in the next section.
Using MSA information to enhance the accuracy of predictions
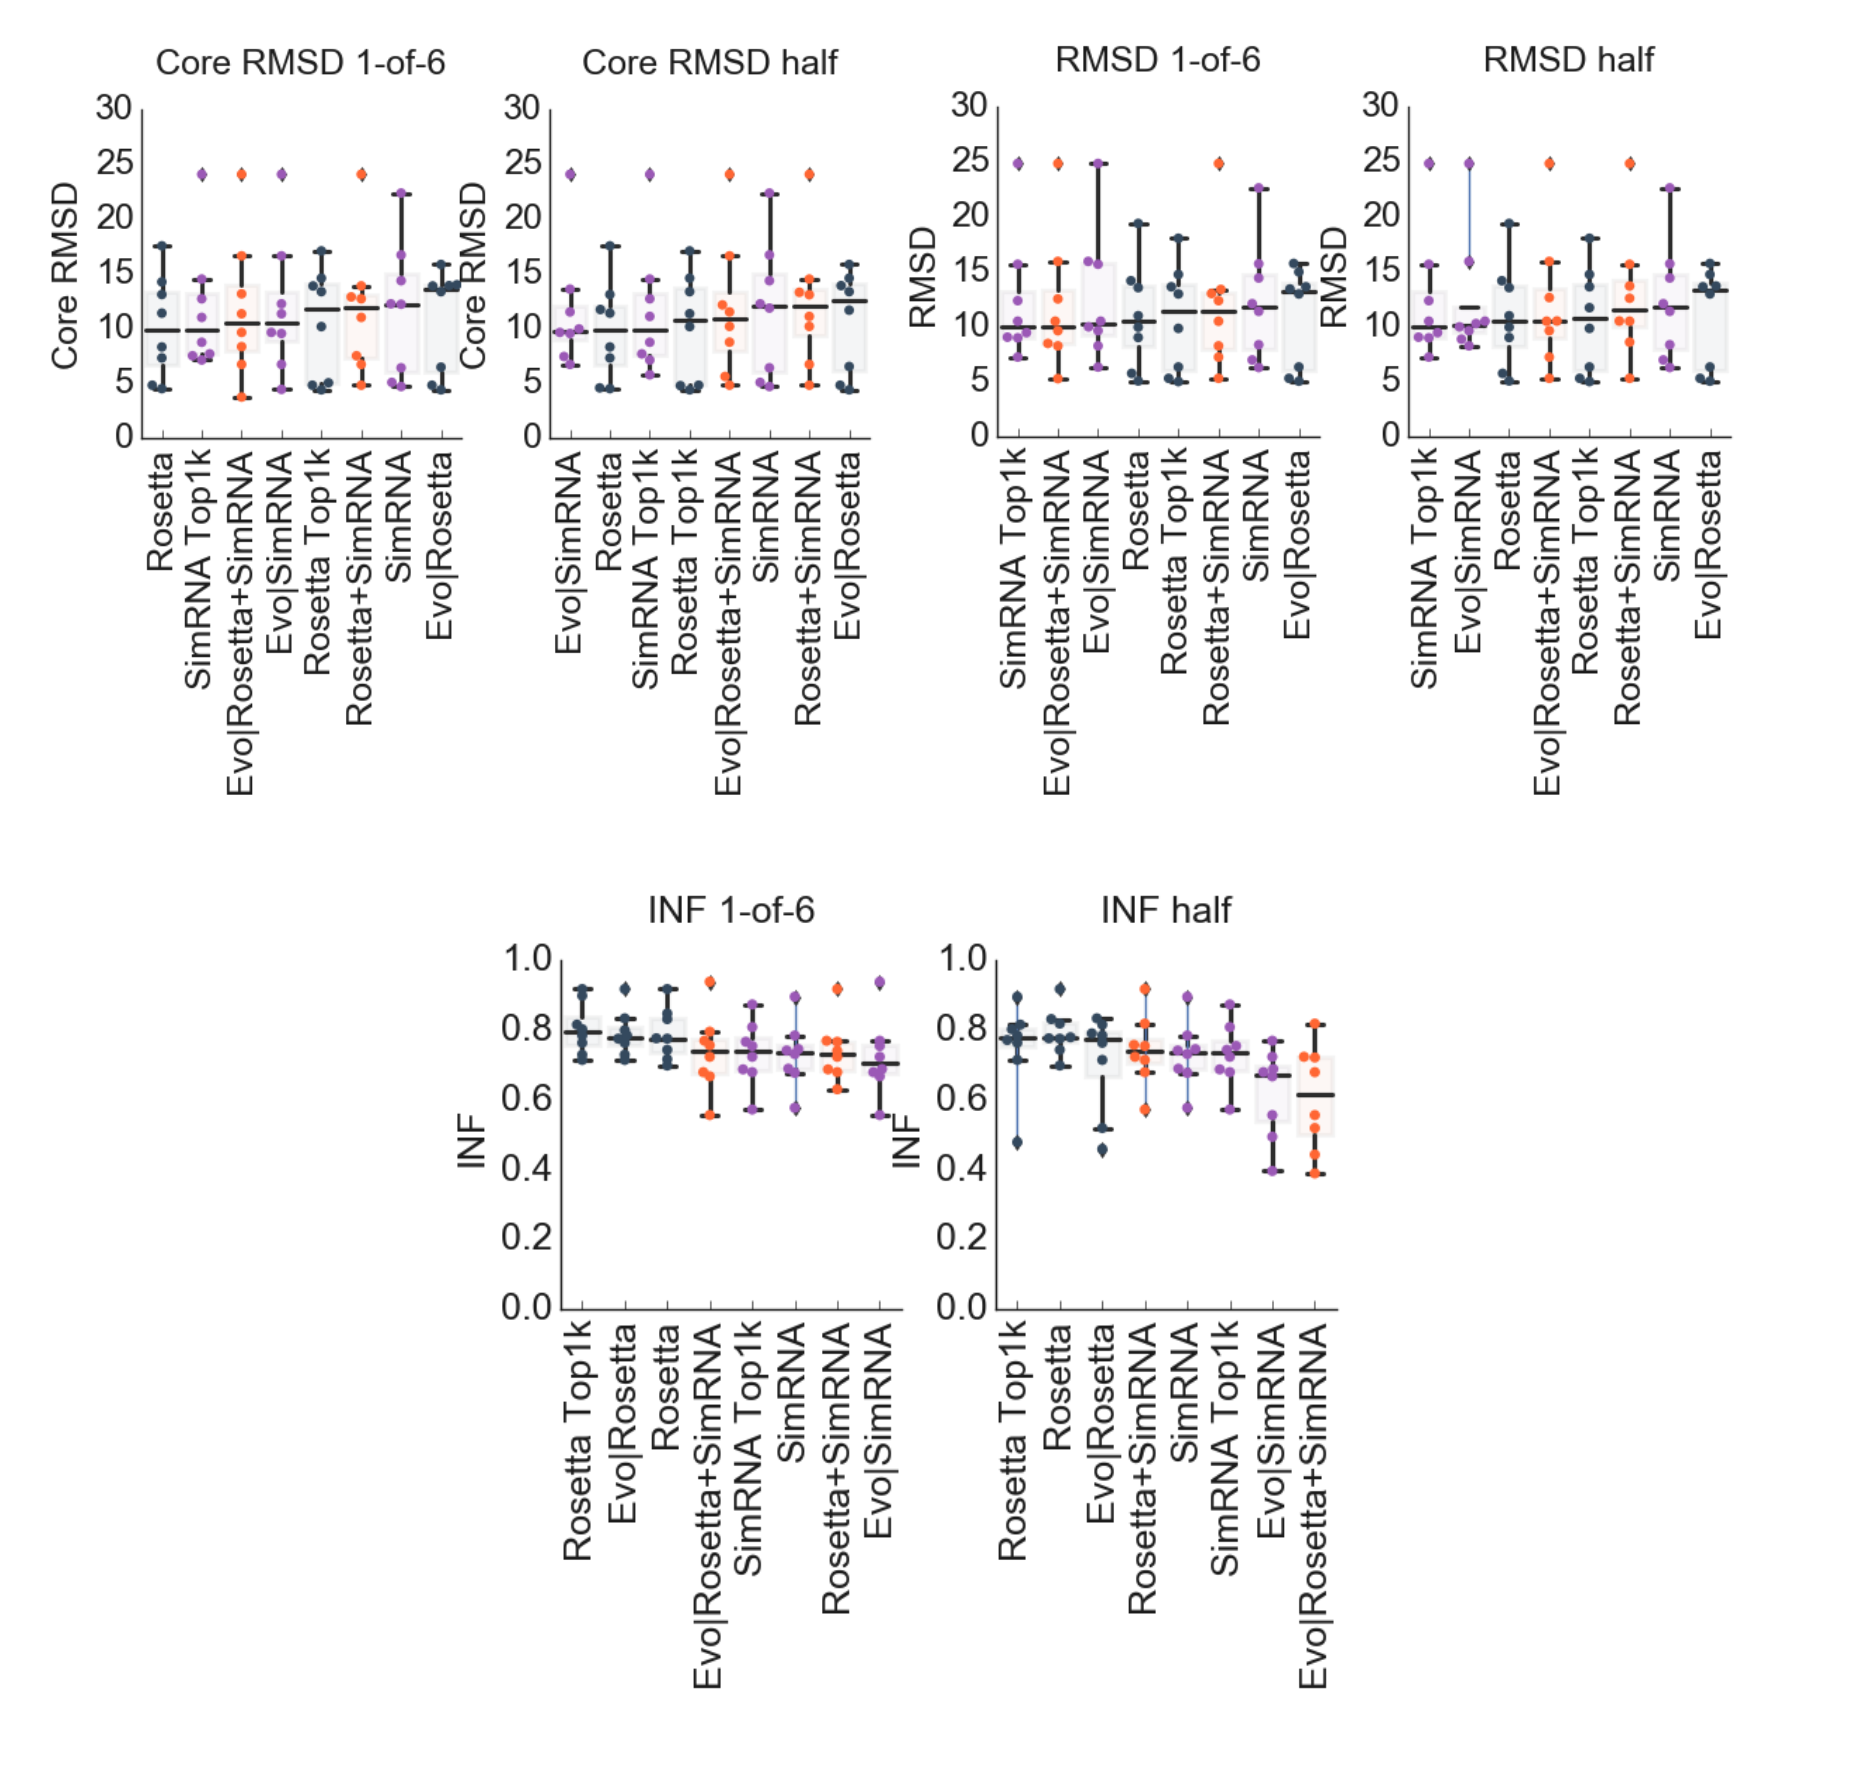
To test, if accurate predictions of sequences of homologs could improve the prediction of the structure of the target sequence, various variants of the method were compared to the controls, and the results are shown in Figure 6 and the details can be found in Table 1 of the Supplementary Data.
The following eight variants of EvoClustRNA and controls were compared to each other. As controls, the standard protocols for Rosetta FARFAR (“Rosetta”) and SimRNA (“SimRNA”) were used. To test the clustering procedure itself without the use of any homologous sequences, three different procedures were considered where the input was: the top 500 models from SimRNA and Rosetta combined (“SimRNA+Rosetta”), the top 1000 models from Rosetta (“Rosetta Top1k”), the top 1000 models from SimRNA (“SimRNA Top1k”). The full EvoClustRNA procedure was tested with the input including 1000 models generated for five homologous sequences (the top 200 models per sequence) from SimRNA (“EvoClustRNA|SimRNA”) and Rosetta (“EvoClustRNA|Rosetta”) separately, and where 500 models (the top 100 per one sequence) produced with Rosetta and 500 models (100 per one sequence) and with SimRNA were combined into one input (“EvoClustRNA|Rosetta+SimRNA”).
SimRNA Top1k reached the lowest median of RMSD, better by 1.77 Å to control, SimRNA, and better than Evo|SimRNA by 1.61 Å. For Rosetta, Rosetta Top1k and Evo|Rosetta scored worse than the control by 0.31 Å and 2.83 Å respectively. Evo|SimRNA achieved the lowest core RMSD with the difference to the control, SimRNA, of 2.26 Å. For variants of Rosetta, the best one was the control, Rosetta. In terms of INFs, the accuracy of prediction for Rosetta and Evo|Rosetta was the same (0.77). In the case of the SimRNA, Evo|SimRNA achieved INF of 0.67 and SimRNA 0.74. The differences between benchmarked variants were not statistically significant (the Wilcoxon, non-parametric statistical test to examine if related paired samples come from the same distribution).
The comparison of the two clustering modes, half and 1-of-6 mode, can be found in the Supplementary Data (Fig. S2). The analysis was performed also for various combinations of sequences of homologs (Fig. S1), e.g., taking the target sequence and one sequence of homolog one by one, then sequences of two homologs, then three and four in all possible combinations (Supplementary Data, Fig. S1). The results of an analysis of core RMSD of all possible combinations of five input sequences of homologs for all 8 RNA families investigated in this work: Adenine riboswitch (Ade), c-di-GMP riboswitch (GMP), TPP riboswitch (TPP), THF riboswitch (THF), tRNA, RNA-Puzzle 13 (RP13), RNA-Puzzle 14 (RP14), RNA-Puzzle 17 (RP17). This analysis was performed with the evox_all_variants.py from the EvoClustRNA package. Also in these tests, the statistically significant overall improvement of the prediction of variants of EvoClustRNA over the controls was not detected.
Accurate predictions of structures for sequences of homologs
Encouraged by the results from the folding sequences of homologs, we searched for more sequences to investigate how they fold. Because of the computational cost of predictions, we limited our analysis to four RNA families modeled with SimRNA: purine riboswitch, RNA-Puzzle 17, cyclic-di-GMP riboswitch, THF riboswitch (Fig. 7).
Once again, we were able to identify sequences that yielded more accurate models than the target sequence, defined as a number of models of lower core RMSD than the best model for the target. For the adenine riboswitch four sequences gave more accurate solutions, from Streptococcus pyogenes (AAFV01000199.1, “a99”, three models), Bacillus cereus (AE016877.1, “ae0”, one model), Clostridium botulinum (CP001581.1, “cp1”, twelve models), Bacillus cytotoxicus (CP000764.1 “cp07”, one model) than models for the target sequence. The best model for the “ae0” sequence was of core RMSD 3.13, which is better by 1.12 Å better than the best model for target sequence (core RMSD of 4.25 Å).
In the case of the RNA-Puzzle 17, the majority of the models are close to the 20 Å, however, some homologs gave single accurate models, below core RMSD 10 Å: “hcf” (HCF12C_58327, one model), “bsk” (BS_KBB_SWE26_205m_c1114943, three models), “s23” (2236876006_041573, eleven models) (sequences and accession codes are taken from [27]). The striking case is the “rum” (RUMENNODE_3955907_1) homolog. This sequence yielded six models more accurate than the best model for the target sequence. The best of these models with the core RMSD as low as 4.13 Å was better by 1.48 Å than the best model for target sequence (core RMSD of 5.61 Å).
For the THF riboswitch, none of the sequences of homologs gave better predictions than the target sequence. Interestingly, for one of the homologs, Alkaliphilus metalliredigens (CP000724.1, “cp7”), a cluster of accurate solutions were generated (around 6 Å). This cluster enriched the final pool of models used for clustering and improved the selection of the final model.
In the case of the cyclic-di-GMP riboswitch, the results were consistent and comparable to the models for the target sequences and all sequences gave models of the same accuracy, with core RMSD ranging from 6.5 Å to 15 Å, after removing outliers for Peptoclostridium difficile (ABFD02000011.1, “gba”) sequence). Two homologs generated better models than the target sequence: AE000513.1 (“gxx”, 6 models) and AM180355.1 (“am1”, one model).
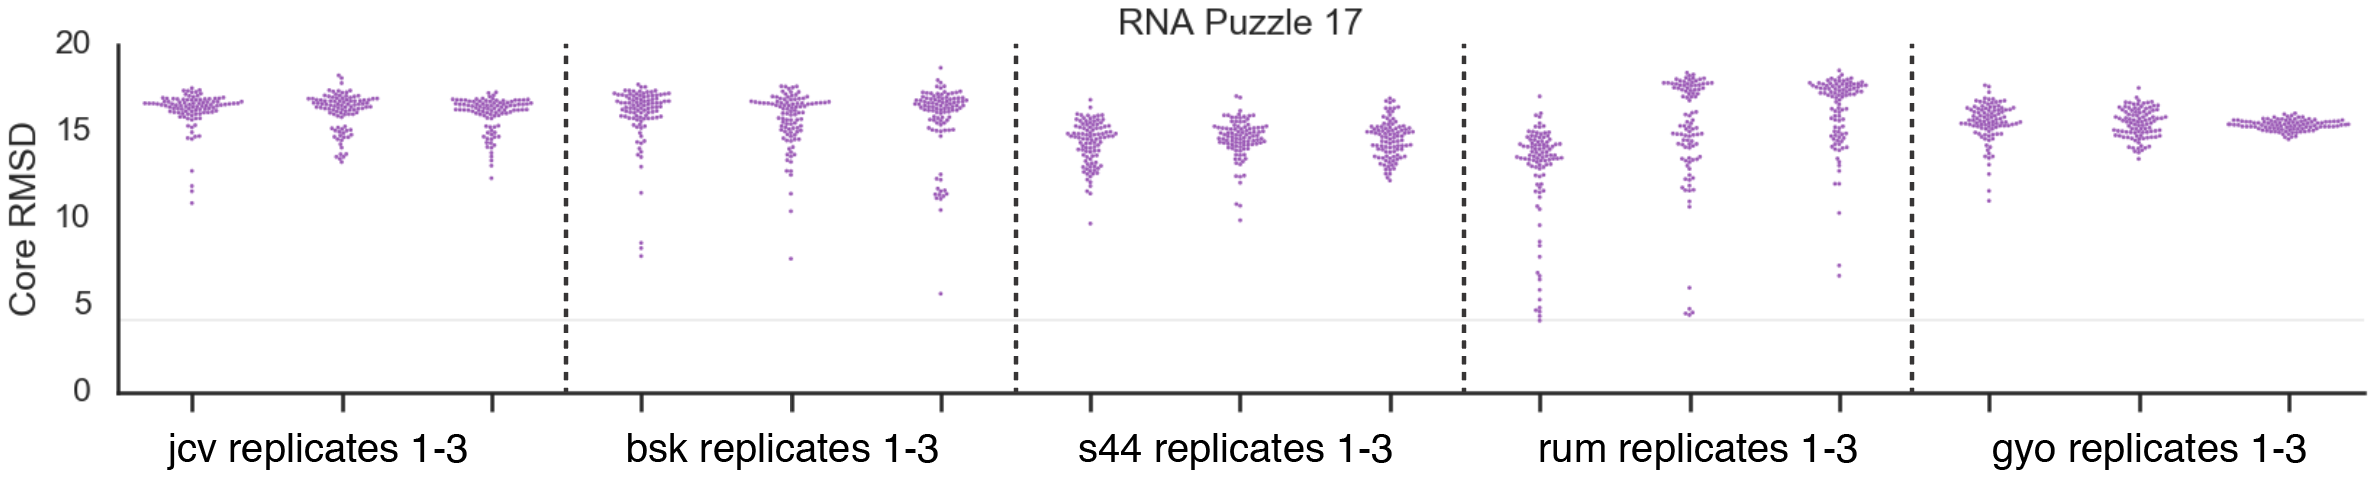
We also wanted to test if the results for sequences of homologous RNAs are consistent between simulations with different initial seed values. Seed values are numbers that are used to create initial starting points for a simulation, and are typically assigned by a pseudo random number generator. Because of the high computational cost of simulations, this analysis was done only for five cases (three independent runs with pseudo random seed values) of RNA-Puzzle 17 using SimRNA. The core RMSDs are not the same between runs because of the random seed values, however, the trend for some sequences (e.g., “rum”) to generate accurate models is preserved (Fig. S4). Simulations for “JCV” sequence did not give any models below 10 Å threshold, while for “rum” sequence twenty-one models were obtained below this threshold.
Example: Sampling of conformational space for the RNA-Puzzle 17 and the TPP riboswitch
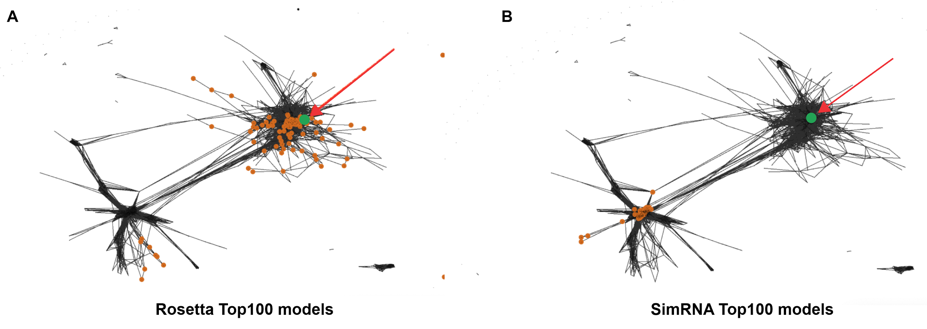
To understand whether there were structures that shared the same 3D structure in comparison with the native structure in the pool of 500 models of homologs, the results of clustering were visualized with CLANS [28]. To perform this analysis, we implemented a new tool called Clanstix (a part of the rna-tools package (https://rna-tools.readthedocs.io/en/latest/tools.html#module-rna_tools.tools.clanstix.rna_clanstix). CLANS uses a version of the Fruchterman–Reingold graph layout algorithm to visualize pairwise sequence similarities in either two-dimensional or three-dimensional space. The program was designed to calculate pairwise attraction values to compare protein sequences; however, it is possible to load a matrix of precomputed attraction values and thereby display any kind of data based on pairwise interactions. Therefore, the Clanstix program from the rna-tools package was used to convert the all-vs-all RMSD distance matrix, between selected for clustering fragments from the EvoClustRNA|SimRNAweb runs, into an input file for CLANS.
The results of clustering with CLANS are shown in Figure 8. In this clustering visualization, 100 models of five homologs are shown (each homolog uniquely colored, models of the target sequence are colored in lime). Models with a pairwise distance in terms of RMSDs lower than 6 Å are connected. The experimentally determined reference structure (Fig. 8A) was added to this clustering to see where it would be mapped. Interestingly, the native structure was mapped to a small cluster, in which there are three models for the target sequence. The cluster medoid (Fig. 8B) achieved an RMSD of 7 Å to the reference structure. This clustering visualization showed that there were models generated with the correct fold, but none of them were selected as the final prediction. In the absence of the information about the reference structure, the default prediction of EvoClustRNA was the medoid of the biggest cluster (Fig. 8C).
An analogous analysis was performed for the results of clustering of EvoClustRNA|SimRNAweb runs for the TPP riboswitch. Models with a pairwise distance in terms of RMSDs lower than 9 Å are connected. Interestingly, the reference structure (Fig. 8D, dot) was mapped to a cluster of models of one of the homologs (Fig. 8F, blue). The medoid of this cluster (Fig. 8F) achieved a core RMSD of 9 Å to the native structure. This cluster was devoid of models for the target sequence and included only models of its homologs. Since SimRNAweb was not able to detect non-canonical interactions, most of the structures were in “open” conformation and were dissimilar to the reference structure. The default prediction of EvoClustRNA (Fig. 8E) achieved an RMSD of 24 Å with respect to the reference structure.
We also looked at the diversity of models generated by the two methods used in this study. Figure 5. shows that the top 100 models from SimRNA tend to be more similar to each other as compared to the top 100 models from Rosetta. The results of clustering for the TPP riboswitch are shown in Fig. S3. For this visualization, the top 100 models from each method were considered. The different diversity of models from each modeling method can be detected. The top 100 models generated with Rosetta were more diverse and sampled much bigger conformational space. In contrast, the top 100 models from SimRNA were similar to each other and sampled limited conformational space. This observation is important for further analysis when one combines models from different predictive methods to use them with EvoClustRNA.

