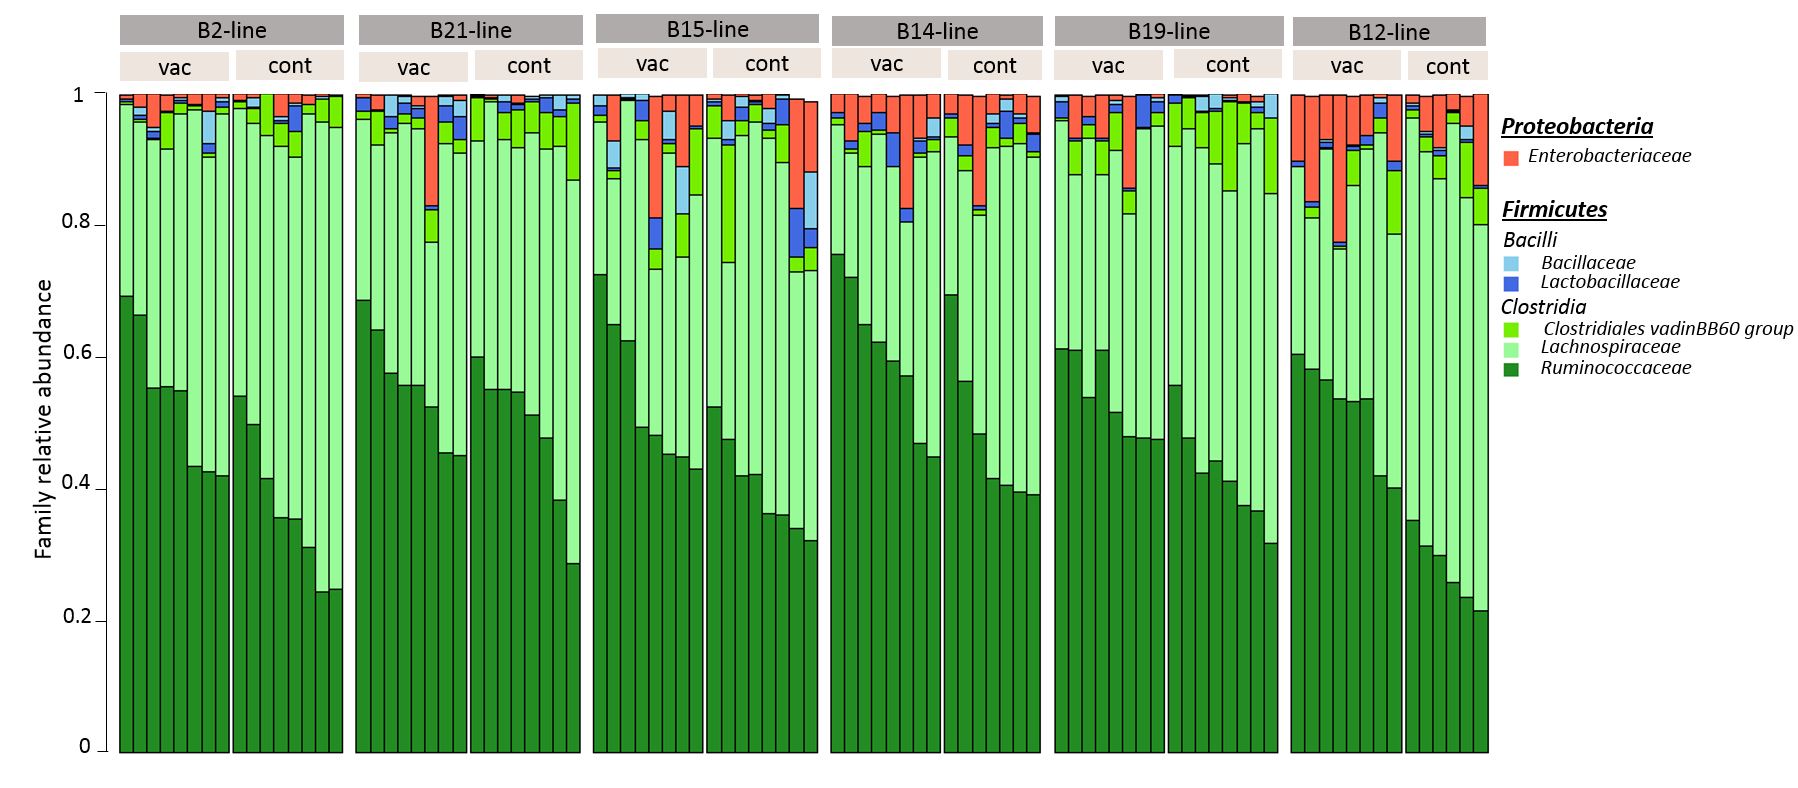
Taxonomic composition
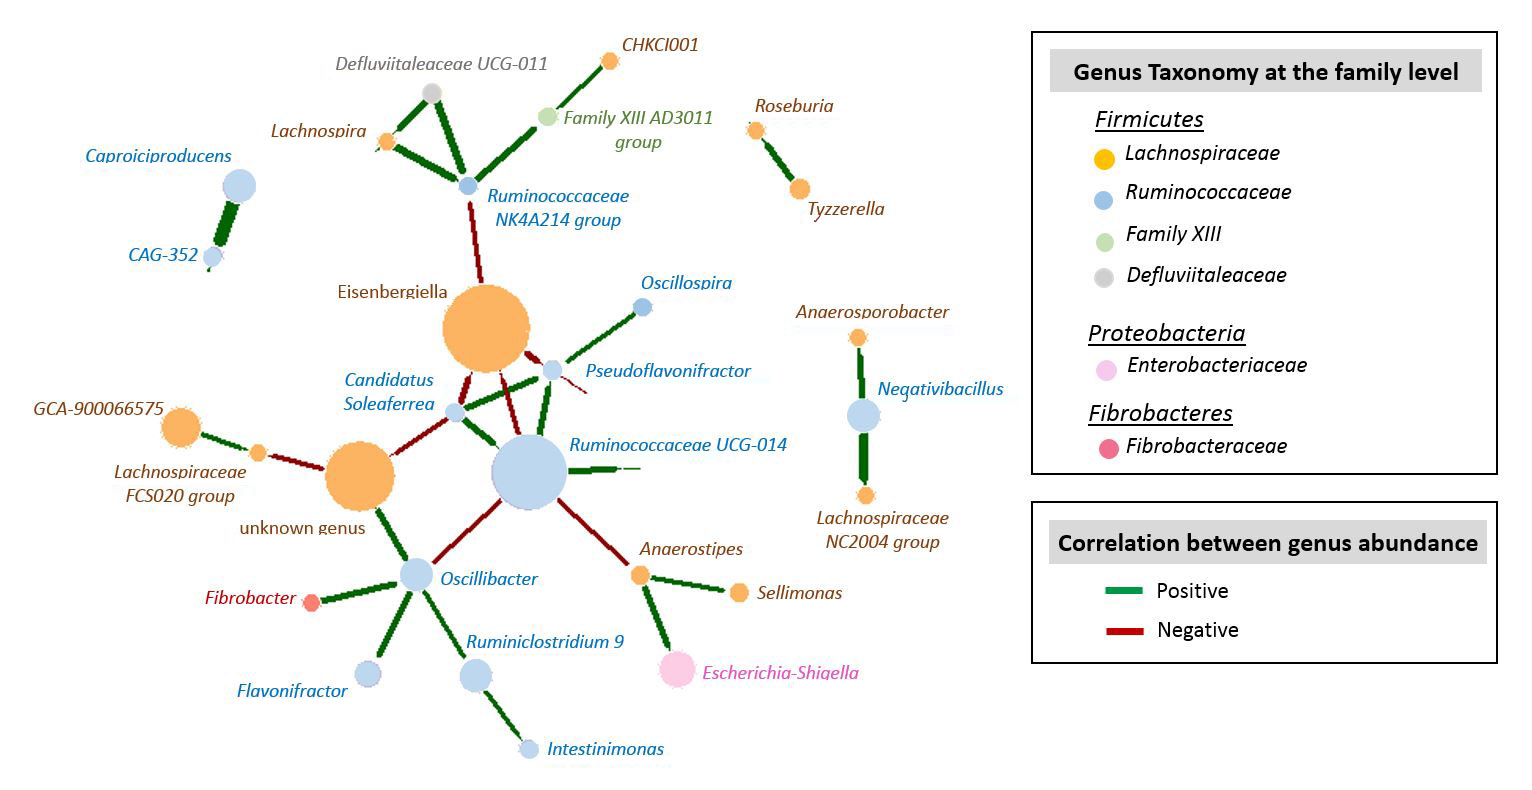
From the 93 caecal samples processed, 16S rRNA gene sequencing provided a total of 12,256,442 reads that after quality control led to 4,952,178 sequences with an average of 53,249 sequences per sample (range: from 32,560 to 76,819 sequences). We identified 487 OTUs from 5 phylum (Suppl Table S1-a), 12 families (Suppl Fig S1, Suppl Table 1-b) and 73 genera (Figure 1, Suppl Table S1-c). The massively dominant phylum was Firmicutes (average abundance 96%), with essentially Lachnospiraceae (48.1%), Ruminococcaceae (42.1%), and in a lesser extent Bacilli (2.1%). It was followed by the much less abundant Proteobacteria (average abundance 3.9%). Over the 73 genera identified, Ruminococcus torques group (12.4%), Eisenbergiella (9.0%), and Ruminococcaceae UCG-014 (8.0%) were the three dominant ones, and 34 significant correlations were observed between their abundance (Suppl Table S2, Suppl Figure S2). Eisenbergiella was negatively associated with Ruminococcaceae UCG-014 (rho=-0.52), and Escherichia-Shigella, which is often described as pathogenic, was positively associated with Anaerostipes (rho=0.54), and with an unknown genus from the Gammaproteobacteria class (rho=0.95).
Differences in microbiota composition according to the genetic line
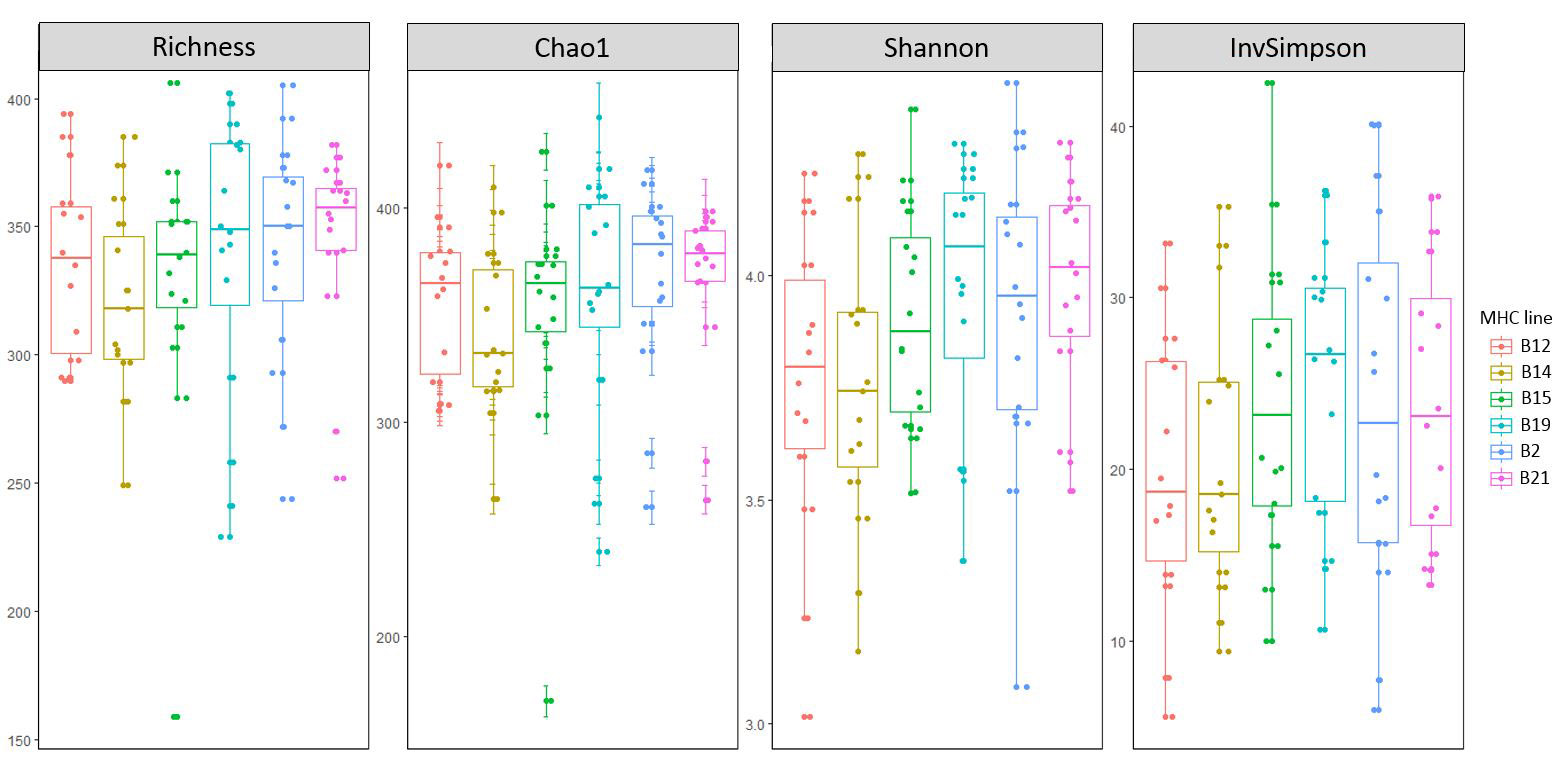
Lines had a significant effect on β-diversity (BC distances) independently of the vaccine status (p-value=1x10⁻⁴) (Figure 2 a), but not on the α-diversity indices (Suppl Figure S3, Suppl Table 3, Additional File 5), meaning that the microbial dissimilarity observed between the lines was not due to a higher bacterial richness in some of them.
Results from pairwise comparisons of BC distances between lines showed that the line B14 displayed the greatest dissimilarity with the other ones (all pairwise p-values < 0.0002), and the greatest homogeneity within its bacterial community (Table 1, Figure 2b-d). Then, the line B21 was the more dissimilar one, followed to a lower extent by B2 and B12. Furthermore, we observed a closer proximity between B12 and B14, and between B19 and B21, which did not match the lines clustering regarding their vaccine efficiency. The number of OTUs differing between a pair of lines were in accordance with their corresponding β-diversity profiles as it ranged from none (B12 - B15 and B2 - B21), to 126 (B14 - B21) (Suppl Table S4-a). Globally, the line B14 had more abundant OTUs from the Ruminococcus torques group, and fewer abundances of OTUs from Ruminococcaceae UCG-014 and Ruminiclostridium 5 genus (Suppl Table S5).
The B21 line is mostly dissimilar with B12 and B14, and it globally harbored a larger abundance of OTU from Ruminococcaceae UCG-014 and GCA-900066575 genera and a lower abundance of OTU from Flavonifractor, Escherichia-Shigella, and Oscillibacter genera (Suppl Table S5). Finally, the B12 line harbored a higher abundance of OTU from Escherichia-Shigella genus in comparison with the lines B2, B21 and B19 (Suppl Table S5).
The same pattern was observed considering the vaccinated and control groups separately: we did not observe a line effect on α-diversity in any group, and once again, the lines B14 and B21 displayed the more dissimilar microbiota in both groups (Suppl Table 4-b-c). However, we observed that vaccination brought the lines closer: they were less dissimilar in the vaccinated group than in the control group, especially for B21 (all p-value<0.006 in pairwise comparison on BC distance implying B21 in the control group, while only two comparisons displayed p-value<0.03 in the vaccinated group, with significance maintained with B14 and B12). Furthermore, vaccination also brought closer the microbiota inside each vaccine efficiency group: in the LR group, the Bray-Curtis dissimilarities observed between lines B19 and B12 in the control group (p-value=0.01) disappeared in the vaccinated group (p-value=0.11); in the HR group, the BC dissimilarities between lines B21 and B2 line in the control group (p-value=0.0008) disappeared with vaccination (p-value=0.23).
Vaccination effect on the caecal microbiota of IBV challenged chicken
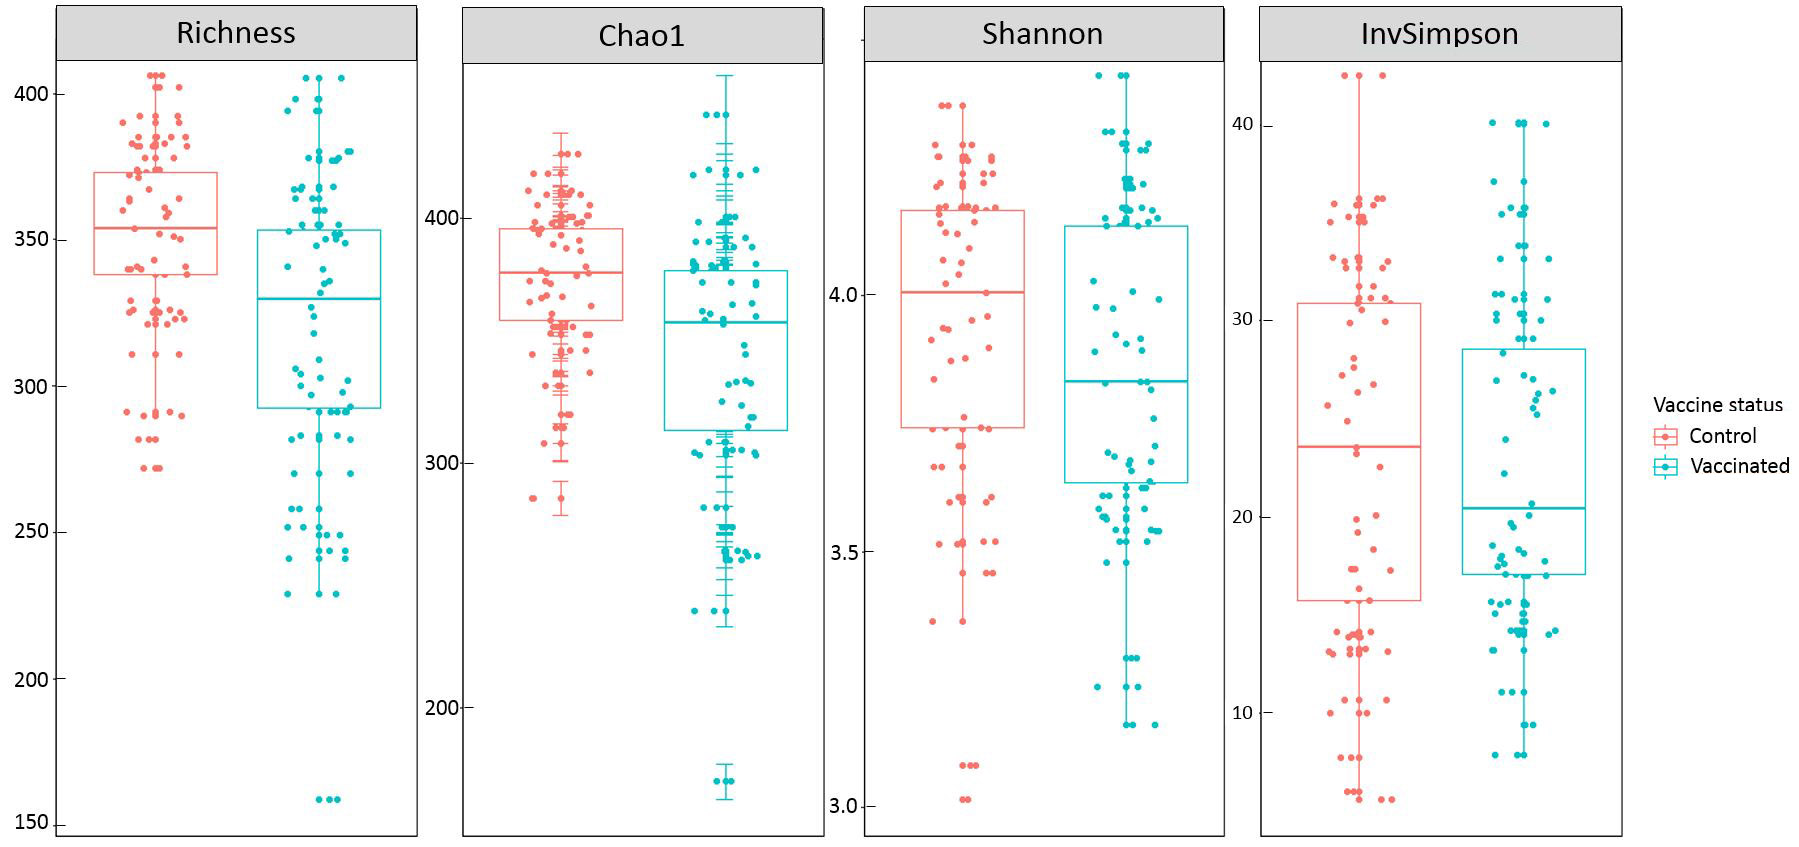
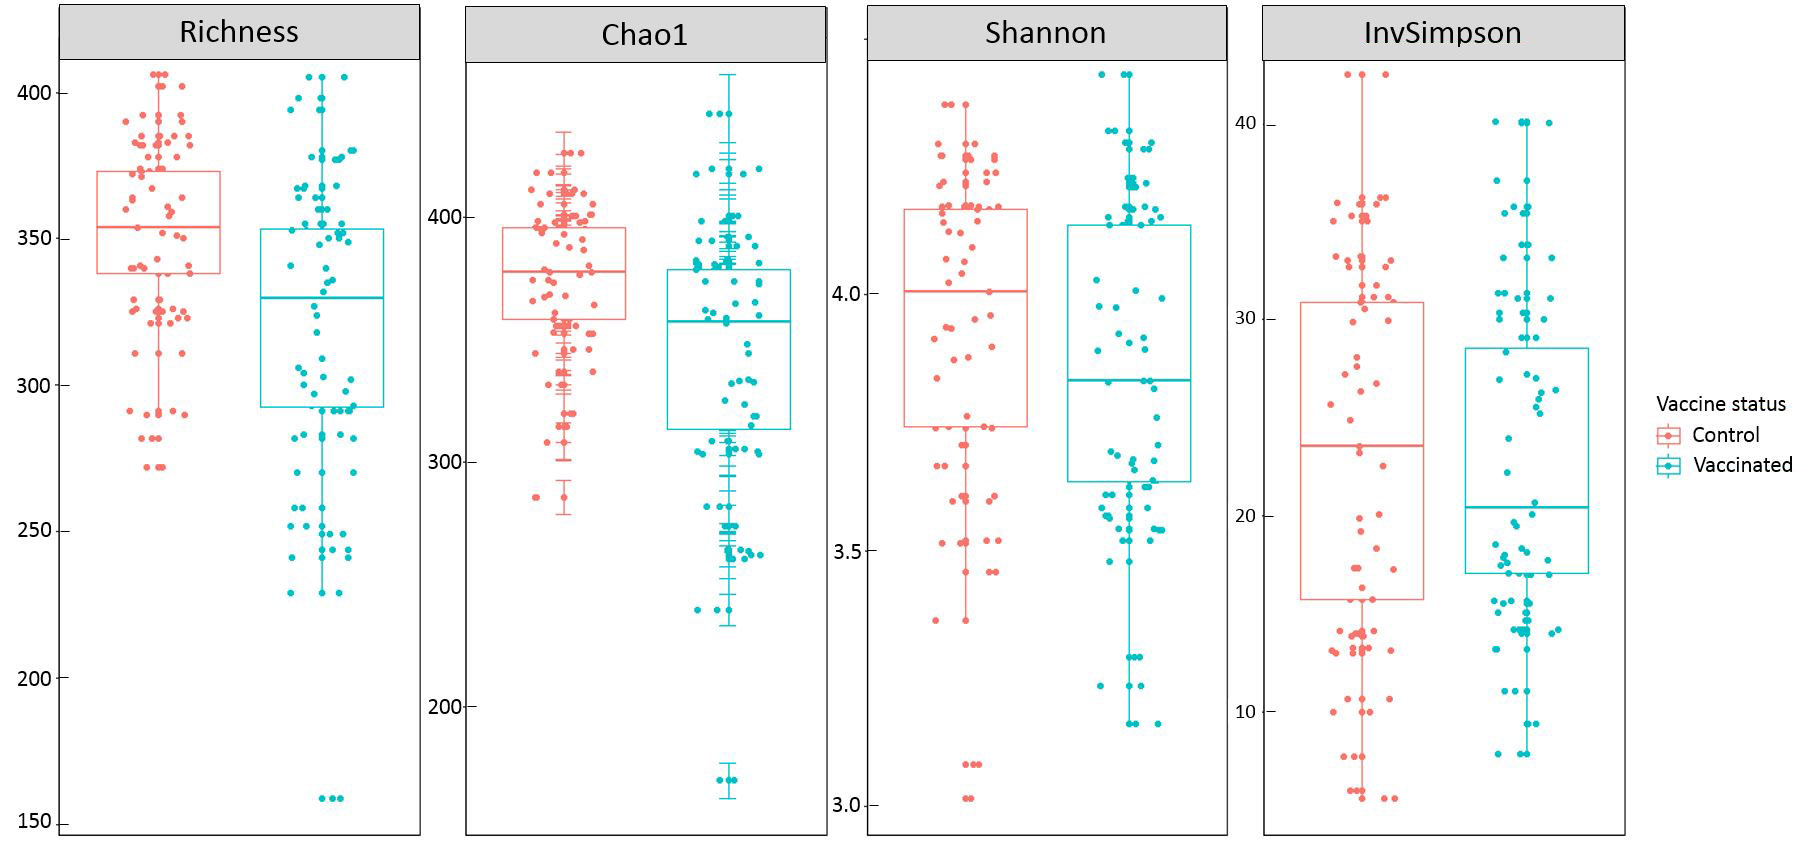
Vaccination was associated with a reduced species richness (p-value=7.0 x 10⁻⁴) and Chao1 estimator (p-value=7.2 x 10⁻⁴), but it did not had any significant effect neither on Shannon (p-value=0.24) nor on inverse Simpson (p- value=0.92) (Table 2, Suppl Figure S4). Since Shannon index is more sensitive to the more abundant OTUs, we can hypothesize that the greater richness observed in the control group is due to its higher carriage of rare OTUs. As Lachnospiraceae and Ruminococcaceae were the dominant families observed, we wondered whether vaccination had also an effect on species Richness and Chao1 in each of them separately. In the Ruminococcaceae subgroup, vaccination significantly decreased OTU richness (p-value=1.1 x 10⁻⁷) and Chao1 (p-value=9.8 x 10⁻⁷), but it had no significant effect in the Lachnospiracea group.
Regarding β-diversity, vaccination had a significant effect on Bray-Curtis distances (p-value=1x10⁻⁴) with vaccinated versus control samples forming two distinct clusters noticeable on NMDS representation (Figure 3-a). Furthermore, it strengthened microbiota homogeneity as it significantly reduced β-diversity which is measured through the mean average distance of each sample to the centroid of the corresponding group (p-value=4x10⁻³). Finally, by looking at the centroids displacement on an NMDS from the control group to the vaccinated group, vaccination similarly disturbed the microbiota β-diversity in all lines (Figure3-b).
Differential analysis on OTU abundance carried considering all lines together showed that most of the OTUs impacted by the vaccination were from the Ruminococcaceae and Lachnospiraceae families, and to a lower extent from Clostridiales vadinBB60 group, and Enterobacteriaceae family (Suppl Table S7). Twenty-three out of 25 differentially abundant OTUs from the Ruminococcaceae UGG-014 group genus, and 5 out of 6 OTUs from Faecalibacterium genus were less abundant in the vaccinated group. On the contrary, 11 OTUs out of 12 differentially abundant OTUs from Eisenbergiella genus, 5 out of 7 OTUs from Ruminococcus torques group, 5 out of 6 OTUs from Ruminoclostridium 9 and Oscillibacter genera, all 3 OTUs from Escherichia-Shigella, Lachnospiraceae NK4A136 group, Subdoligranulum, and Lactobacillus genus, and both OTUs from Tyzerella 3 genus were more abundant in the vaccinated group.
Considering the lines separately, the trend for Ruminococcaceae was similar, as most of the OTUs significantly different in this family were less abundant in the vaccinated group (Suppl Table S8). Ruminococcaceae UCG-014, the most affected genus within this family, was especially impacted in the lines B2, B19, and B21. Finally, vaccination disturbed more the B2 line (39 OTUs differentially abundant), then the B19 line (22 OTUs), and to a lower extent the B15 and B21 lines (9 OTUs).
Association between vaccine efficiency and caecal microbiota
Microbial differences between high and low vaccine response lines
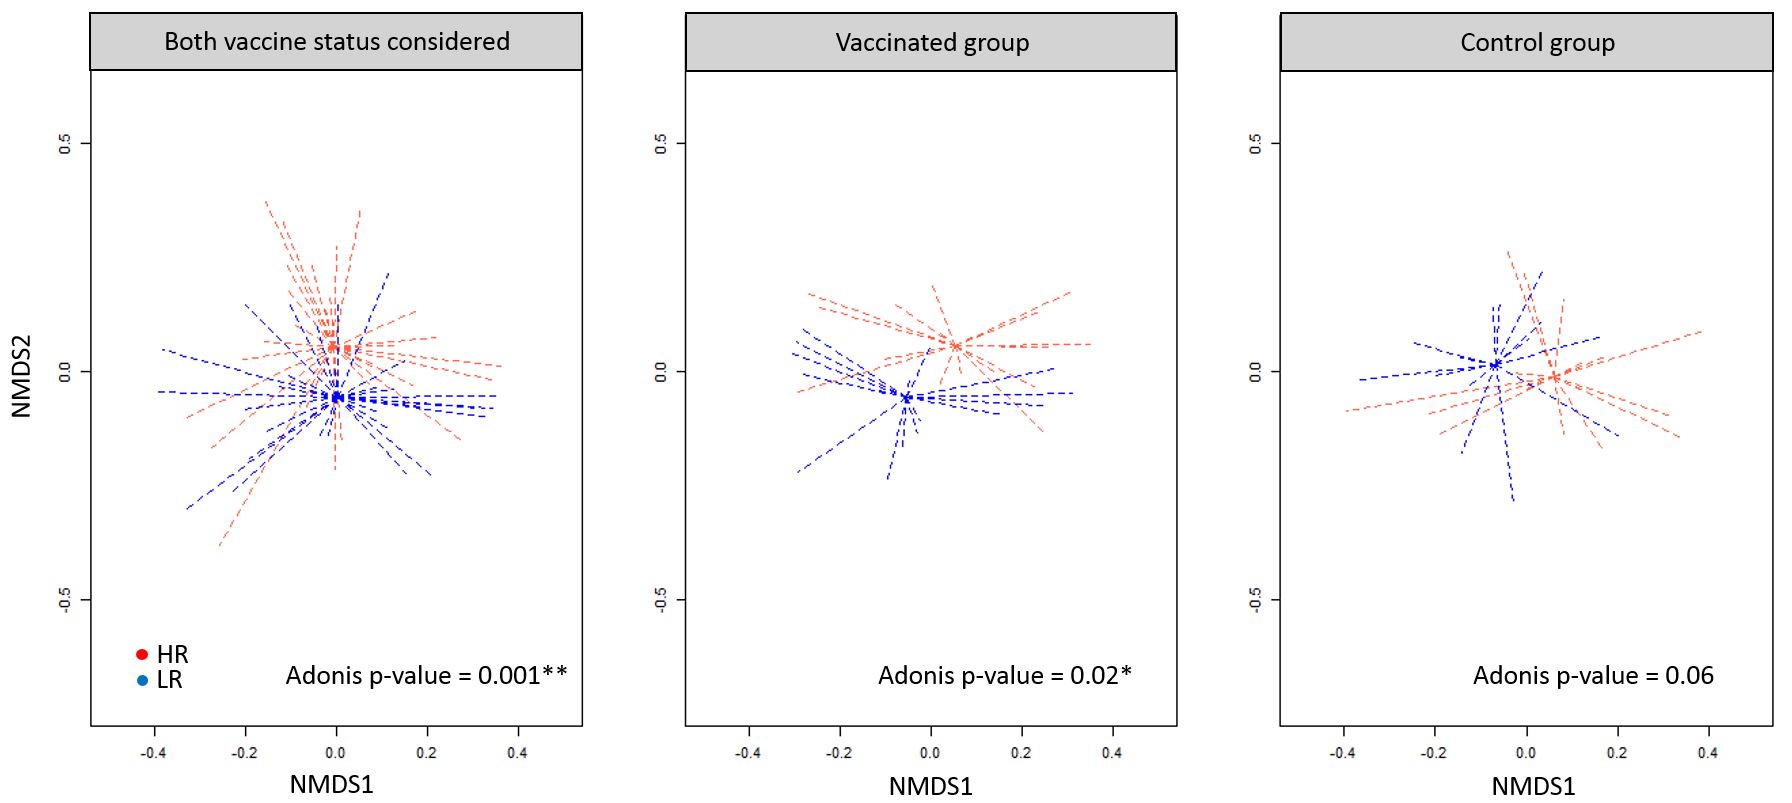
We compared the HR (B2 & B21 lines) and LR (B19 & B12 lines) groups to study the association between vaccine efficiency and caecal microbiota (nchicken=62, nOTU=487). There was no significant difference for the richness indices observed between these groups (Suppl Figure S5), which suggests that the better vaccine response from HR animals was not necessarily correlated to a higher caecal microbiota richness, however there was a significant β-diversity difference on Bray-Curtis distances (p-value=0.001, Suppl Figure S6-a). This microbial dissimilarity was also present in the control group (nvac=48, Adonis p-value=0.06, Suppl Figure S-6b, ncont=45, Adonis p-value=0.02, Suppl Figure S6-c), but not detected in the vaccinated group.
In order to search for potential bacterial species contributing to this observed dissimilarity, we searched for OTUs with different abundances between the HR and LR groups whatever the vaccine status (Table 3). We observed 7 bacterial species from the Lachnospiraceae family, and 4 bacterial species from the Ruminococcaceae family that were significantly more abundant in the HR group, against 4 OTUs from the Lachnospiraceae family, 5 from the Ruminococcaceae family, 1 from the Defluviitaleaceae family, and 1 from the Escherichia-Shigella genus that were more abundant in the LR group. Among the most significant differences, two OTUs were more abundant in the HR group than in the LR group: one from the Tyzzeralla genus (abundance ratio HR/LR of 4.6, adjusted p-value= 0.003) and one from the Angelakisella genus (abundance ratio HR/LR of 7.6, adjusted p-value= 0.003). On the contrary, the genus CAG-352 and Escherichia-Shigella were both more abundant in the LR group (resp. abundance ratio LR/HR of 3.6 and 2.3, adjusted p-value of 3.39x10⁻³ and 2.09x10⁻²). The Cluster_143 from Flavonifractor genus was more abundant in the HR group only considering the vaccinated animals (adjusted p-value=0.03).
Association between microbiota and immune phenotypes in LR and HR groups
We also searched for associations between the microbiota and the immune phenotypes regarding the effect of the microbial β-diversity on each of 28 immune parameter with an PERMANOVA (Adonis) model performed between the LR and HR groups. We found 9 phenotypes that were significantly different between HR and LR bacterial communities considering Bray-Curtis distances (Table 4). TCRγδ expression on TCRγδ T cells was the immune parameter with the most significant difference (Adonis p-value=2x10⁻⁴), followed by monocyte counts (p-value=0.001), CD45 expression on heterophils (p-value=0.002), and CD45 expression on thrombocytes (p-value=0.003), and then by CD4+ T cell counts (p-value=0.01), CD4 expression on CD4+ T cells (p-value=0.02), and CD8αß expression on TCRγδ T cells, CD8αß+ T cell counts, and Bu1 expression on B cells (all p-values=0.03). Since these results suggested a relationship between the microbiota composition and some immune parameters, we then searched which OTUs were more involved in this association through Spearman correlations calculated between OTU abundances and the levels of these immune parameters. Filtering the output of Spearman correlation analyses with a cutoff of 0.4 on the estimator and of 0.05 on the adjusted p-value (FDR) enabled us to observed 74 OTUs with at least a moderate association with an immune phenotype, while it drops to 4 when restricting the whole dataset to only strong associations (rho>0.5 or rho<-0.5) (Table S9). It is to notice that among those few high associations, two implied a negative correlation between OTUs from Escherichia-Shigella genus and TCRγδ expression on TCRγδ+ T cells (Cluster 3: rho=-0.60, adjusted-p-value=3.5x10⁻⁷ ; Cluster 544: rho=-0.55, adjusted-pvalue=4.3x10⁻⁶).
The two immune parameters that displayed the greatest numbers of high or moderate associations with OTU abundance were also the immune parameters that had the most significant differences based on Adonis model performed on the HR and LR Bray-Curtis distance. We indeed observed 12 OTUs that shared significant moderate or high associations with TCRγδ expression on TCRγδ+ T cells (5 being positive), and 10 with monocyte counts (4 being positive) (Table S9). Among those OTUs, Cluster 65 from Ruminococcacea UCG-014 genus displayed a negative association with frequency of TCR1+ CD8+ expression on TCRγδ T cells (rho=-0.44, adjusted-p-value=3.5x10⁻⁴) and with CD4 expression on CD4 T cells (rho=-0.42, adjusted-p-value=8.0x10⁻⁴), and was also significantly more abundant in the HR group than in the LR group (adjusted-p-value=2.7x10⁻²) (Table 3). Similarly, Cluster 759 from Escherichia-Shigella genus that displayed a negative association with CD4 expression on CD4+ T cells (rho= -0.43, adjusted-p-value=5.0x10⁻⁴) and was also more abundant in the LR group (adjusted-p-value=2.1x10⁻⁴). About TCRγδ expression on TCRγδ T cells, among the 12 positive associations, 6 implied OTUs from the Escherichia-Shigella genus (Table S9). CD8αß expression on TCRγδ T cells and CD4 expression on CD4+ T cells both displayed 6 associations with OTU abundance from the microbiota. Considering the monocytes counts, among the 6 negative associations observed, 2 involved OTUs from the Flavonifractor genus, that were both more abundant in the B12 line than the B21 line (Cluster 14, Cluster 625, adjusted p-values<0.04).
Prediction of microbial functions differentially abundant between HR and LR groups
Picrust2 enabled us to predict the presence of 4.509 functions in caecal bacterial communities of both HR and LR groups, with 268 KEGG genes predicted to be more abundant in the HR group, against 1451 in the LR group (Suppl Table S10). From the enrichment analysis it appears that in the HR group there was a significant enrichment in predicted functions related to quorum sensing (adjusted p-value=0.001), with 80 KEGG genes from this pathway observed to be more abundant in HR than LR animals (Suppl Table S11). From the list of enriched genes in the HR group, the following genes code for enzymes that produce metabolites acting in immune pathways: the KEGG gene K01858 from the inositol phosphate metabolism pathway, coding for a myo-inositol-1-phosphate synthase (log2FC=-1.22, adjusted p-value=0.004), the KEGG gene K00692, coding for a levansucrase (log2FC=-2.04, adjusted p-value=0.004), and the KEGG gene K01218 coding for a mannan endo-1,4-beta-mannosidase (log2FC=-1.32, adjusted p-value=0.0004).
In the LR group there was a significant enrichment in predicted functions related to cationic antimicrobial peptide (CAMP) resistance (adjusted p-value=1.2x10⁻⁹), two-component system (adjust-p-value=7.5x10⁻⁸), Escherichia coli biofilm formation (adjusted-p-value=7.5x10⁻⁸), lipopolysaccharide biosynthesis (adjusted-p-value=1.3x10⁻⁷), bacterial secretion system (adjusted-p-value=1.6x10⁻³), Vibrio cholerae biofilm formation (adjusted-p-value=5.1x10⁻³), phenylalanine metabolism (adjusted p-value=2x10⁻²) and degradation of aromatic compounds (adjusted-p-value=4.9x10⁻²). From this list of “LR” enriched gene functions, we then focused on lipopolysaccharide biosynthesis and bacterial secretion system pathways. We found some differentially abundant genes mostly for functions related to lipopolysaccharide biosynthesis, then to ABC transporters, and to a lower extent to peptidoglycan biosynthesis, and n-glycan biosynthesis (Suppl Table S10). Regarding genes coding for lipopolysaccharide biosynthesis, KEGG genes K03271 (GmhA), K07031 (HddA), and K03273 (gmhB) encoding enzymes that enable the final synthesis of S-layer glycoprotein were predicted to be more abundant in the HR group (respective adjusted p-values of 0.043, 0.015, and 0.045). Besides, 20 KEGG genes which enable the synthesis of Lipid X, IVa, IIa and IIb, Lipid A disaccharid, and Inner Core oligosaccharide (OS) were predicted to be more abundant in the LR group. Concerning the N-Glycan biosynthesis pathway, the KEGG gene K00721 coding for a mannosyltransferase that enables dolichyl phosphate D-mannose synthesis was predicted to be more abundant in the HR group (adjusted p-value=0.046). Finally, some KEGG genes from the ABC transporter pathway coding for the transfer of lipopolysacharide (K11720 and K06861), teichoic acid (K09692, and K09693), lipoproteins (K09808 and K09810), and phospholipid (K07323, K02065, K02066, K02067, and K07122) from the cytosol to the cell wall of bacteria were predicted to be more abundant in the LR group.
Associations between immune phenotypes and microbiota according to the genetic line
We searched for associations between individual caecal microbiota and immune phenotypes with ADONIS. We first used this model between each immune parameter and the Bray-Curtis distances of the caecal microbiota from the whole population, considering the 6 lines together. Then, we repeated these analyses in each line separately to search if some of them could contribute more than others to the observed associations.
We found that 5 immune parameters had a significant association with the caecal microbiota. As we observed on the analysis restricted to the HR and LG group, TCRϒδ expression on TCRγδ T cells was the immune parameter with the most significant association (p-value=5x10⁻⁴). The four other parameters had weaker associations: Bu1 expression on B cells, IgM expression on B cells, CD45 expression on monocytes in addition to the serum titer of IBV-specific antibodies (p-values between 0.01 and 0.03) (Table 4). The analysis of each line separately showed that for TCRϒδ expression on TCRγδ T cells, the line B21 displayed the strongest association (p value=0.008), followed by the lines B14 and B15 (p-values of 0.02 and 0.04 respectively), while the lines B2, B12, and B19 did not display significant differences. We thus performed again this model on a subset of the three lines (B21, B14 and B15) with significant differences and on a subset of the three other lines (B19, B12, and B2) without significant differences, and represented the results on the total population on an NMDS plot (Figure 4). As expected, TCRϒδ expression on TCRγδ T cells were significantly associated to the Bray-Curtis distances of the caecal microbiota only in the total population (p-value=0.0002) and the B21, B14 and B15 sub-group (p-value=0.0025). Considering the other immune parameters, the lines B21 and B19 were the only ones that displayed a significant association with Bu1 expression on B cells (respective p-values of 0.03 and 0.01), while the line B19 had an association with serum titer of IBV-specific antibodies (p-value=0.02), and the line B21 had an association with CD45 expression on monocytes (p-value=0.02).
Associations between immune phenotypes and microbiota according to the vaccine status
Finally, we searched for the bacteria that could be involved in these associations through Spearman correlation analysis that we calculated between the level of each immune parameters and the relative abundance of each OTU. We first calculated them on the entire population to search for association present whatever the vaccine status and the level of IBV infection (Figure 5-a, Table S12). Then, we calculated it on the animal from vaccinated (Figure 5-b, Table S13) and control group (Figure 5-c, Table S14) separately to identify association specific of an acute infection with an inflammatory state group (control group) or of a rather sub-clinical infection (vaccinated group).
We only get few common associations between these three analyses. We observed negative association between TCRϒδ expression on TCRγδ T cells and OTU from Escherichia-Shigella genus in the three datasets. Especially, Cluster 544 from this genus was observed in the three datasets whatever the level of infection. Such consistency strengthens the likelihood of a biological link between Escherichia-Shigella and TCRϒδ expression on TCRγδ T cells.
All the other associations we observed on the vaccinated group and the control group implied quite different immune parameters and different OTUs. The highest correlations we observed were in the control group, with for instance two strong positive correlations implying MHC-II expression on monocytes. A first one with Cluster 93 from Ruminoccocaceae UGC-014 genus (rhoC=0.63, adjusted-p-value=0.001), and another one with Cluster 279 from Ruminococcus 1 genus (rho=0.62, adjusted-p-value= 0.001).