Ethics statement
This study was approved by the Ethic Committees of Northwestern Polytechnical University; Ethics approval number: 202102043. The ethics form is shown in the supplementary materials
Cell lines
The BC cell lines T24, human urothelium immortalized cells SV-HUC-1, K562 cell and HEK 293 cell were obtained from Cell Bank of Chinese Academy of Sciences (BioVector NTCC, Shanghai, China). The three cell lines of T24, SV-HUC-1 and HEK 293 were normal cultured in DMEM cell culture medium (Gibco, No. 11965-084, USA), supplemented with 100 units/mL penicillin, 0.1 mg/mL streptomycin and 10% (v/v) exosome-depleted FBS (SBI, Mountain View, CA, USA), K562 cells were maintained in RPIM-1640 culture medium with the same supplements. All cells were cultured in a humidified 5 % CO2 atmosphere at 37 °C.
NK cells expansion
Human NK cells were expanded from peripheral blood mononuclear cell (PBMC) according to Li et al. (24). Briefly, peripheral venous blood was collected from healthy donors (10 mL, n = 12) and the PBMC were separated by using lymphocyte separation liquid (Haoyang TBD, Tianjin, China). Genetically modified stimulating cell for NK cell expansion was prepared according to our previous work (24) and cultured in RPIM-1640 cell culture medium supplemented with 100 units/mL penicillin, 0.1 mg/mL streptomycin and 10% (v/v) FBS (Gibco, No 10082139, USA). PBMC were co-cultured with an equal number of irradiation killed stimulating cells and maintained in RPIM-1640 cell culture medium, supplemented with 100 units/mL penicillin, 0.1 mg/mL streptomycin, 10% (v/v) FBS and 100 units/mL IL-2. After 14 days culture, the proportion of NK cells in PBMC was determined by flow cytometry (BD FACS Calibur, San Jose, CA, USA) through labeled with CD56-PE (BD, Cat No. 561904, CA, USA) and CD3-FITC monoclonal antibodies (mAbs) (BD, Cat No. 561806, CA, USA).
Exosomes isolation and identification
The culture supernatant of T24 and SV-HUC-1 cells was collected to isolate exosomes according to the instruction of ultracentrifugation method (25). Briefly, the cell culture supernatant was prepared by initial centrifugation (1×10 min, 300×g; 1×30 min, 2000×g) to remove cell debris. The exosomes contained supernatant was collected and filtered by 0.22 μm filter. The filtrate was ultracentrifuged (1×30 min, 10,0000×g) by using a fixed-angled rotor (Ti-70, Beckman Coulter, Inc., Brea, CA, USA) at 4°C. After washed by PBS, the filtrate was ultracentrifuged (1×70 min, 10,000×g) at 4 °C. The sediment was stored in -80 °C for the subsequent detection.
Transmission electron microscope (TEM) was employed to detect the morphology of exosome. The exosome sediment was resuspended in 2% paraformaldehyde aqueous solution and then 3-5 μL exosome suspension was dripping onto cleaned mica chips. After critical point drying, mica chips were imaged by (TEM) (FEI, Tecnai G2 Spirit BioTwin, USA) at 10 kV with a CCD camera (Gatan, Warrendale, PA, USA). Western blot method was used to examine the exosomal marker CD9, CD63 and CD81 on isolated exosome. Further, the Zetasizer Nano ZS (Malvern Instruments, Malvern, UK) was used to detected the particle size and concentration of isolated exosomes. Each sample was measured 3 times at room temperature. The concentrations of exosomes were evaluated by BCA assay (BCA Protein Assay Kit, Beyotime, No. P0012-1).
Exosomes uptake assay
The exosomes uptake assay was following the protocol of Li et al. (24). Briefly, NK cells were added into 12 well plate and co-cultured with PKH67 labeled exosome for 24h. After then, the NK cells were washed by PBS and labeled with DAPI (Beyotime Institute of Biotechnolog, No. C1005, China). Then NK cells were observed under an inverted fluorescence microscope (Leica, Inverted Fluorescence Microscope, DM IL LED, Germany) and tested by flow cytometry. The positive rate of the NK cells (only the NK cells which take up labeled exosome showed the green fluorescence signal) was calculated.
NK cell viability and cytotoxicity
NK cells (2×10⁶ in each group) were treated by T24 exosome for 24 h to 48 h. After centrifuged at 1000×g for 5 min and washed by PBS, NK cells in each group were resuspended in 1 mL RPMI-1640 media (IL-2 free). NK cell suspension (200 μL) were added into a well of 96-well plate and repeated for 5 well. Twenty microliter of CCK-8 (Cell Counting Kit-8, Dojindo, Japan) was added to each well of NK cell and then the plate was incubated in a 5 % CO2 incubator at 37 ℃ for 2 h. The optical density (OD) value of each well was recorded at 450 nm in a microplate reader (BioTek Synergy-4, Germany). The viability of the NK cells was examined.
The cytotoxicity of NK cells was tested according to our previous publication (26). Briefly, NK cells in each group were centrifuged and washed by PBS. After then, NK cells (2×10⁶) were re-suspended in RPMI-1640 (IL-2 free) and added into the well of a 96-well plate at 100 μL. Target cell (K562) (4×10⁵) which re-suspended in 100 μL medium were added to the same well of NK cell (mix well) to make the effector-to-target ratio (E:T) at 5:1 and co-cultured for 4 h. The wells contain only NK cell (effector (e) well) and K562 cell (target (t) well) respectively were set and cultured in same condition. After 4 h incubation, 20 μL of CCK-8 was added to each well, and the plate was incubated for another 2 h at normal culture condition. The OD values were recorded at 450 nm. The cytotoxicity was determined by evaluating the rate of NK cells killed the target cells; the killing rate was calculated by following equation:
Killing rate (%) = [1- (OD(mix)-ODe)/ODt]×100%.
NK cell apoptosis and receptor expression
After T24 exosome treatment, the apoptosis of NK cell was detected by Annexin-V/PI double dye method. NK cells in each group were collected and washed by PBS. After labeled with Annexin V-FITC and PI (AnnexinV-FITC Apoptosis Detection Kit, Cat No. C1062M. Beyotime Institute of Biotechnolog, China), NK cells in each group were tested by flow cytometry (BD Calibur, Biosciences, California, USA).
After T24 exosome treatment, the NK cells in each group were washed and collected to divided into 4 groups (1×10⁶). Different antibodies of NK cell receptors (NKG2A, NKG2D, NKp30, NKp44, NKp46, and CD226) were used to labeled each group of NK cells. All the cells were tested by flow cytometry separately and analyzed by Cellquest (BD) software. The information of all antibodies are showed in Table 1.
Exosomal miRNA profile of T24 cell
The miRNA profiles of T24 and SV-HUC-1 cell were identified by next-generation sequencing. By compared to SV-HUC-1 exosomal miRNA profile, the aberrant expressed miRNAs in T24 cell derived exosome were identified and verified.
According to the sequencing data, miR-146-3p is the highest expressed miRNA in T24 exosome with large number of reads and significant up-regulated expression compared to the exosome of SV-HUC-1 cell. The other high expressed miRNAs in T24 exosomes are miR-100-5p, miR-21-5p, miR-21-3p, miR-30a-5p, let-7i-5, miR-221-3p, miR-22-3p, miR-186-5p, miR-28-3p, and miR-378a-3p. The expression of this group of miRNAs in T24 exosome was verified by q-PCR method following the instruction of EasyPure miRNA Kit (Transgen Biotech, Beijing, China) and TransScript Green miRNA Two-Step qRT-PCR SuperMix (Transgen Biotech, Beijing, China). q-PCR circle was implement in CFX96 Touch qPCR System (Bio-Rad Laboratories, Hercules, CA, USA). Small RNA U6 was used as internal reference gene, and 2−ΔΔCt method (27) was used to calculate the relative expression ratio of each miRNA in T24 exosome. The specific primers and the expression of miRNAs in BC exosome are showed in our previous study (28)
Target Gene Prediction
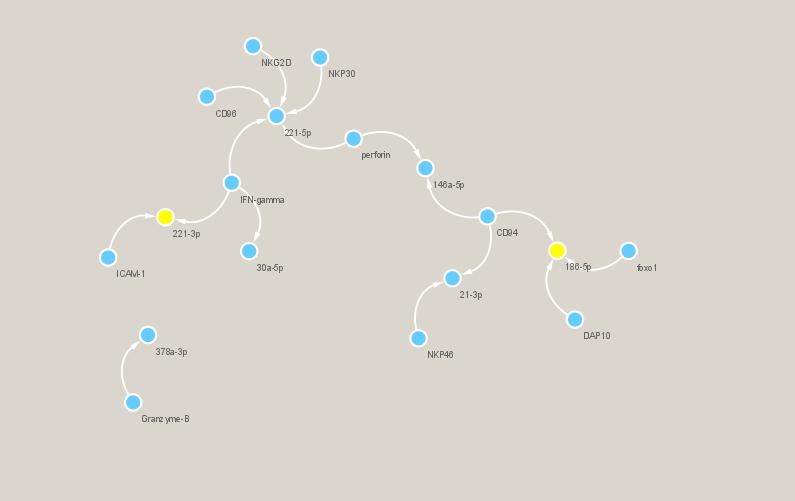
Four online programs TargetScan, miRDB, miRTarBase and miRWalk were employed to predict the potential target genes of these miRNAs in NK cells. The diagrammatic sketch of the interactions of exosomal miRNAs and potential target genes in NK cells was drew by the Cytoscape software (version 3.6.1) (Supplementary material figure1). miR-221-5p and miR-186-5p were selected for downstream analysis.
Luciferase Reporter Assay
TargetScan 7.2 database (http://www.targetscan.org/) were employed to predict the binding site of miRNAs matched to the target genes. Please see the algorithm predicted binding site of miRNA to the target genes in figure 5. Luciferase reported assay was used to confirm the combination of miRNA and target genes. Following the manufacturer’s protocol, the position of sequence region, containing the putative binding sequence of each miRNA, was inserted into a luciferase reporter vector pGLO-basic (Promega, Madison WI, USA). Mutated sequence of the target gene was constructed into pGLO-basic vector. The sequences constructed in the reporter vector and mutant vector were confirmed by sequence analysis. pRL-TK Renilla Luciferase Reporter vector (Promega, Madison WI, USA) was used as an internal control vector. HEK 293 cells were seeded into 96-well plates with the confluent rate about 80 % and co-transfected with either reported vector (0.01 mg/well each), miRNA mimic/mutated vector (10 nM) and internal control vector. After 48 h co-transfection, Luciferase activities were measured by microplate reader (Infinite M1000, TECAN, China). Renin luciferase activity was defined as the standardization of firefly luciferase activity.
NK cell transfection via overexpression target miRNAs in SV-HUC-1 exosome
Because the very low efficiency of transfecting NK cell by conventional transfection methods, we attempt to use exosome as the vector to carry miRNA and transfect NK cells. The mimics of miR-186-5p (Cat no. miR10000456-1-5; RiboBio, Guangzhou, China), miR-221-5p (Cat no. miRB0004568-2-1; RiboBio, Guangzhou, China) and the NC mimic has-miR-NC (Cat no. miR1190315051351, RiboBio, Guangzhou, China) were purchased from Guangzhou RiboBio Co.,LTD. The miRNAs were loaded into exosomes via electroporation according to the protocol by Lamichhane et al (29). Briefly, SV-HUC-1 derived exosomes (5 µg) were mixed each kind of with miRNA (5 µg) in 50 µL electroporation buffer (1.15 mM K3PO4, pH: 7.2, 25 mM KCl, 21% OptiPrep). Electroporation was carried out using Gene Pulser/Micropulser Cuvettes (Bio-Rad, Cat no.165-2089, USA) in a GenePulser Xcell electroporator (Bio-Rad, USA). Electroporation was carried out at 400 V and 125 µF with three pulses. Then the samples were transferred into tube (0.5 mL) and 1 mM EDTA was added. After incubated at RT for 15 min, the samples were centrifuged at 5000×g at 4°C for 5 min to remove buffer and unincorporated miRNA. Then, After 4 h treatment, the content of target miRNAs mimic and NC mimic in transfected NK cells were verified by q-PCR method.
The verification of target genes in NK cell
After miRNAs carrying exosomes treatment for 48 h, the expression of DAP10, CD96, Foxo1, perforin and NKG2Din NK cells were tested in protein level. The information of antibodies was showed in table 1.
Western blot method was used to test the protein expression. After washed with PBS, NK cells in each group (2×10⁷ each) were lysed by RIPA lysis buffer (Cat No. P0013C, Beyotime Institute of Biotechnology) supplemented with protease inhibitor (Cat No. P1051, Beyotime Institute of Biotechnology) on ice for 10 min. The lysate of the cells was quantified by BCA assay (BCA Protein Assay Kit, Cat No. P0012S, Beyotime Institute of Biotechnology). Briefly, lysate was separated by 12 % Tris-glycine gels in equal amounts, and then transferred onto polyvinylidene fluoride (PVFD) membranes. Under gentle shaking, the blots were first blocked in 5 % nonfat milk for 1h. After washing in TBST three times, the blots were incubated with primary antibodies overnight at 4 °C. β-actin was used as internal control. After washing in TBST three times, the blots were incubated with the secondary antibodies at room temperature for 1h with gentle shaking. The blots were washed again with TBS, and then were immersed in the luminous liquid (EasySeeVR Western Blot Kit, Cat No. DW101-02, TransGen Biotech, Beijing, China) for 1 min. The signals were detected by exposure of the film in Chemiluminescence instrument (Tanon-5200Multi, China).
Data analysis
Statistical analyses were performed by using Graphpad prism8 software. The data were presented as the mean ± SD. The results were analyzed by using analysis of student’ t test and Analysis of Variance (ANOVA). Multiple comparisons were performed using the LSD test to evaluate significant differences between the groups. Statistical significance was defined as p<0.05.