3.1. Characterization of biogenic Mn2O3
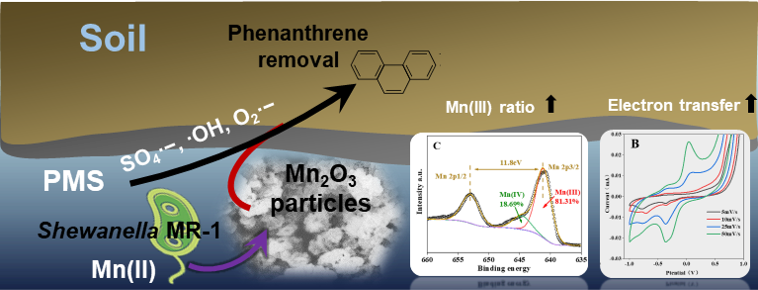
As shown in Fig. 1A, the production of Mn oxide by MR-1 was observed since the cell suspension turned into dark bronze color after 20 days, whereas the suspension maintained yellow PYE medium color without Mn(II). By using SEM, it was observed that large number of biogenic particles were synthesized with a homogeneous size of ~ 150 nm (Fig. 1B). In order to verify the composition of nanoparticles, EDS measurement was conducted, and we found that nanoparticles were mainly comprised of Mn, O, and C (Fig S1 and Table S1). Meanwhile, after deconvoluting the XPS fine structure in the Mn 2p3/2 region at around 640 nm, it was found that more that 80% Mn (III) was on the surface, which indicates that the particles would be Mn2O3 (Fig. 1C). This structure was finally verified by XRD measurement shown in the spectra (Fig. 1D), where three broad peaks at 34°, 55°, and 66° were comparable to the standard spectrum and our sample of Mn2O3 (Fig. 1D). Considering that Fe ions are concurrent with Mn and would increasing the activation in the form of bimetallic catalysis, the influence of Fe(III) on biogenic Mn2O3 were evaluated. The biogenic nanoparticles with similar size were observed in Fig S2. Although the interference from Fe, the Mn(III) ratio still maintained at 66.67%. corresponding to the appearance of FeOOH revealed in the XRD spectrum at around 720 nm. It is worthy to note that biogenic Mn2O3, with comparable particle sizes and even higher ratio of Mn(III) compared with the purchased chemical Mn2O3 (Fig S3B), would possess better performance to activate the PMS for degrading of phenanthrene in soil.
3.2 Biogenic Mn2O3 activate PMS for degrading phenanthrene
Three different kinds of Mn oxides were chosen as the activator to degrade the phenanthrene. As shown in Fig. 2, biogenic Mn2O3 + PMS (Mnbio+PMS) presented 77.4% removal ratio within 120 minutes, which is much higher than that of Mn2O3 + PMS (MnMn2O3+PMS) of 55.7%. Meanwhile, single biogenic Mn2O3 and Mn2O3 only lead 5.0% degrading, indicating that this removal was dominated by the PMS advanced oxidation. The addition of Fe didn’t interfere the degradation of phenanthrene, indicating the feasibility of this method to be used in-vivo. Meanwhile, it should be mentioned that native heavy metals in soil could trigger the PMS activation and leading to the removal ratio to 39.7%. Nonetheless, remarkable elevating between biogenic Mn2O3 and chemical one exhibited better performance of biogenic Mn2O3 as an activator, which would be correlated to the higher ratio of Mn(III) and smaller size. Furthermore, we examined the influence of PMS concentration and it increased from 21.5%, 24.8%, 48.1%, 68.6–78.2%, respectively, associated with the concentration increasing to 80 mg/g soil (Fig. 2B). The dosage of biogenic Mn2O3 was also evaluated (Fig. 2C). And with the increase of biogenic Mn2O3 concentration, the removal ratio increased slowly from 53.1%, 69.5%, and maintained at 77.9%, 79.9%, 79.8%, which might be ascribed to the limiting of PMS fixed at 80 mg/g soil. Since methanol was used to quench OH/ SO4·−, tert-butanol to·OH, p-benzoquinone to ·O2·−, and sodium hydrosulfite to almost all free radicals (Na et al. 2018), we further evaluated the contribution of different kinds of free radicals when AOP happened. As shown in Fig. 2D, p-benzoquinone and tert-butanol did not inhibit the degradation whereas methanol and sodium hydrosulfite quenched most of the free radical reactions. Hence, we concluded the removal contribution from radicals were: SO4·− 48.7%, O2·− 25.8%, and·OH 18.5%.
Furthermore, we discussed the possible pathways of phenanthrene degradation by GC-MS. The complex polycyclic aromatic was firstly oxidized into biphenyl ring structure with phenolic hydroxyl, and then converted into phenol and benzene, followed with the formation of long chain hydrocarbons. This degrading processes of tribe ring was correlated to the decreasing of UV-vis peak at 250 nm, and no accumulation of benzene and Naphthalene was founded, indicating the ring cleavage happened (Fig S4). In general, here we showed that even 0.1% biogenic Mn2O3 will trigger the electron transfer to PMS and the degrade the by multiple radicals.
3.3. Biogenic Mn2O3 with better electron transfer characterization
It was reported that the activating process is the electron transfer from Mn2O3 to PMS, which might be characterized by examining the electrochemical performance of Mn2O3 (Huang et al. 2018). We mixed the Mn2O3 nanoparticles with PTFE and coated them on the glassy carbon electrode to study electron transfer characterizations. As shown in Fig. 4AB, distinct CV plots revealed that biogenic Mn2O3 with higher current was more active and had stronger EET ability than the purchased one. And the potential difference between the redox peaks is about 0.5 V, which belongs to the potential difference between Mn(II) and Mn(III)/Mn(IV) interconversion reaction (Guo et al. 2015). Figure 4C shows the galvanostatic charge-discharge of Mn2O3. The time required for biogenic Mn2O3 to complete the entire charge-discharge process was greater than that of Mn2O3, suggesting the higher electron holding capacity of biogenic Mn2O3 (Hu et al. 2015). Besides, the Mott-Schottky (M-S) curves of biogenic Mn2O3 and Mn2O3 was recorded. The slope of the straight-line part of the M-S curve is normal, indicating that biogenic Mn2O3 was the n-type semiconductor (Zhang et al. 2019), corresponding to the stronger tend to transport electrons into the solution since the Fermi level of the n-type semiconductor is higher than that of the solution after soaking with the solution. Meanwhile, the M-S curve shows that the flat-band potential (Efb) of Mn2O3 is lower than biogenic Mn2O3, indicating that Mn2O3 has lower electron transfer ability than biogenic Mn2O3, so its catalytic efficiency is lower than that of biogenic Mn2O3(Mandel et al. 2020).
3.5. The effect of advanced oxidation on microbial community diversity
Since the well degradation of phenanthrene was achieved, the feasibility of this method to soil remediation was further evaluated by checking the microbial community diversity. As shown in Fig. 5A, the Venn diagram and OUT numbers of four samples: biogenic Mn2O3 + PMS (Mnbio+PMS), PMS, biogenic Mn2O3 (Mnbio), and raw soil (control) were showed. And it was found that the OUT numbers of the Mnbio+PMS group was 581, which was 200 species less than that of control while the number of PMS and biogenic Mn2O3 group was 690 and 720, slightly lower than the control. However, the Shannon index of Mnbio+PMS and control are 4.14 and 4.50, which is higher than that of PMS (3.35) and Mnbio (3.95), indicating that PMS AOP process decreased the total number of species but maintaining the diversity of the microbial population in the soil. Moreover, when we compared the community changes by PCoA analysis (Fig. 5B), it was found that the Mnbio+PMS group was similar to the control while the dosage of PMS was closer to the biogenic Mn2O3 according to the PC1 factor, accounting for 93.4%. Considering that the PMS and Mn2O3 will be consumed after the PMS AOP, the influence of the addition of PMS and biogenic Mn2O3 only on the community would be mitigated, resulting the more similar community of Mnbio+PMS and control.
We further elaborated the analysis via the heat map of microbial community in Fig S5. The community of control were also close to the Mnbio+PMS group: abundant in Bacillus, Brevibacterium, Hydrogenispora sp., Olsenella sp., Planifilumetc sp. which are functioning to improve soil fertility and synergize with plant roots to improve nutrients. For instance, Olsenella sp. is mainly responsible for producing lactic acid and showed weak tolerance to toxic substances (here the phenanthrene), associated with the total degradation of phenanthrene after PMS AOP process(Gurikar et al. 2022, Kraatz 2011, Yu et al. 2015). Whereas, the main genera in PMS group and Mnbio group were Massilia sp., Sphingomonas sp., Arthrobacter sp., Lysobacter sp. etc. corresponding to their tolerance of phenanthrene toxicity and their ability to degrade phenanthrene (Gu et al. 2017, Jain et al. 1994, Leys et al. 2004).
Moreover, the functional Annotation of Prokaryotic Taxa (FAPROTAX) was conducted to understand the influence of PMS AOP (Fig. 5C). After Mnbio+PMS treatment, the number of microorganisms related to animal parasites and human pathogens were reduced, especially the bacteria correlated to the human-pathogens-nosocomia were greatly reduced. Meanwhile, the abundance of denitrification bacteria largely increased which would improving the soil pH environment and reduce the contamination of nitrate (Nägele and Conrad 1990). And the (aromatic) hydrocarbon degradation was also increased. Nevertheless, the ability to lysis the xylenol cellulose and lignin seems to be activated to effectively improving soil fertility (Ulrich et al. 2008). However, after advanced oxidation treatment, the respiration based on manganese, fumarate, sulfite, and iron was severely hampered.
Generally, three feasibilities of the biogenic Mn2O3 PMS AOP were concluded here 1) Given that the removal of phenanthrene by PMS AOP would also consume the residual PMS and biogenic Mn2O3, and the effect on extra added PMS and Mn2O3 is gradually weakened. 2) Although 28.8% OUT decreased after the PMS AOP, the diversity was remained and the loss of strains would be potentially recovered. 3) The PMS AOP would benefit the denitrification and the lysis process of refractory organic matter in soil.