The differentially expressed genes between SNI and Sham mice in NAc, mPFC and PAG
Descalzi et al. 33 RNA-sequenced the NAc, mPFC and PAG gene expression profiles in SNI mice and Sham mice. SNI mice was the mouse model for neuropathic pain and Sham mice was used as control. There were six Sham NAc, six Sham PAG, six Sham PFC, six SNI NAc, six SNI PAG and six SNI PFC samples. Their RPKM (Reads Per Kilobase per Million mapped reads) gene expression level can be found in GEO (Gene Expression Omnibus) under accession number of GSE91396. A strict threshold of differentially expressed fold change greater than 1.5 and p value smaller than 0.05 was applied to get the differentially expressed genes between SNI mice and Sham mice in NAc, mPFC and PAG. The p value was calculated using function voom from R package of limma. The differentially expressed genes between SNI mice and Sham mice in NAc, mPFC and PAG were mapped onto STRING network 34 for further analysis. STRING is a comprehensive protein functional association network.
The network expansion of NAc, mPFC and PAG neuropathic pain genes based on RWR analysis
As we mentioned before, we would like to investigate the interactions or cross-talks among different brain regions that were responsive to neuropathic pain. The differentially expressed genes between SNI mice and Sham mice in NAc, mPFC and PAG were a good start for such network analysis. Therefore, we mapped these three gene lists onto the comprehensive functional association network of STRING 34, a widely used network for bioinformatics studies 35-38. Only the high confidence interactions of STRING were included, in other words, the confidence score of the interaction must be greater than 0.900.
To explore the cross talk between brain regions, we applied Random Walk with Restart (RWR) algorithm 35,39-42. To illustrate how RWR can reveal the cross talk, let us denote the STRING network as a graph comprised of a set of genes and a set of interactions .
The whole interaction network can be represented with an adjacency matrix. The total number of genes was . The value in row and column was 1 if gene and gene had interactions and was 0 if they did not interact.
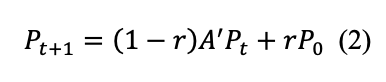
(1) Normalization. The adjacency matrix will be column-wise normalized
Due to technical limitations, Equation 1 has been placed in the Supplementary Files section.
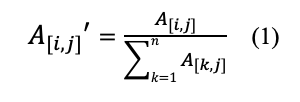
(2) Iteration. Then, a rank walk step will be iterated. In each round of iteration, the state probabilities at time was based on previous state and the initial state
Due to technical limitations, Equation 2 has been placed in the Supplementary Files section.
where was previous state probabilities at time , was the restart probability and was the initial state probabilities which was a column vector with for the seed genes (NAc, mPFC, PAG neuropathic pain genes, respectively) and to 0 for other genes on the network.
(3) Converge. The iteration process will stop when the difference between two states was smaller than 1×10⁻⁶.
After the RWR analysis, each gene on the network will be given a probability of being visited by the seed genes.
The NAc, mPFC and PAG neuropathic pain genes were considered as seed genes, respectively.
To evaluate how significant the probability was, we randomly chose the same number of seed genes 1000 times and calculated the RWR probabilities. If there were more than 50 times that the permutation proverbialities were greater than the actual proverbiality, the permutation p value for that gene was greater than 50/1000=0.05 and that gene will be excluded.
With the permutation p value, we identified the novel neuropathic pain genes in NAc, mPFC and PAG based on RWR analysis. Such expanded NAc, mPFC and PAG neuropathic pain genes can be overlapped to show the cross talk among NAc, mPFC and PAG under neuropathic pain.