3.1 Soil properties before the experiment
The carbonate clay soil used in the experiment had the solid part density of 2.662 g/cm3. In the terms of soil texture, it belonged to a silt class (soil texture triangle, USDA classification). The soil passed into a fluid state and swelled strongly under full water saturation (relative linear deformation was 0.28 cm per cm); its plasticity index being 20 (a lean clay class, ASTM D 2487-2017). The major mineralogical composition of the rock corresponded to montmorillonite (22 wt.%), calcite (12 wt.%), and clastic minerals (quartz, muscovite, albite, clinochlore, microcline). Its wetting contact angle was 37° as the average direction, by Tikhonov - von Mises, with a sample range from 30o to 51o.
3.2 Soil analogues’ surface properties
Calcite proved to be the most hydrophilic component of the mineral composition: the average direction of wetting contact angle on its polished surface was 32o, and the maximum angle on its rough surface was 56o (Fig. 1). The average directions of wetting contact angle of bentonite, kaolinite and quartz porous surfaces ranged from 37 to 44o. The lowest wettability with angles of 90o and more was observed on the spots on bentonite specimens (possibly, due to particles' orientation with the side faces to the contact surface) and mica plates (i.e., on basal faces).
3.3 Analysis of carbonate clay surface properties and organic matter content
Reliable hydrophobization was observed in the "C-6" and "R2-6" options after 6 months of the experiment (Fig. 4). It has appeared as an increase in wetting contact angle both as an average direction and a maximum value. Hereby, the maximum contact angle reached 91o that exceeded the limit value measured for landslide soil.
The following dynamics of the organic matter was obtained. A heterotrophic process was prevailing during the first month of the experiment: the organic matter (including the introduced stimulant) was destroyed by 33% and 17% in the "C-1" and "R2-1" options, respectively. Further, for the next month, the organic matter content increased by 42% and 63% compared to the initial value in the "C-2" and "R2-2" options, respectively. These data suggest that the outbreak of an autotrophic process took place at that moment. In total, the organic matter was slightly accumulated for 6 months in the “C-6” option, but destroyed by 2/3 in the “R2-6” option. At the same time, one can see the quasi-linear dependence of wetting contact angle on organic matter content on Fig. 4, where points concerned 6 months of the experiment are outliers; thus, hydrophobicity was retained at the rather low concentrations of organic matter.
3.4 Particle and microaggregate size distribution
All significant changes in the particle and microaggregate size distribution took place after 6 months of the experiment (Table 1). Thus, the median diameter of microaggregates in the “C-6” and “R2-6” options increased reliably from 13 to 21-23 µm, i.e., almost doubled compared to the "C-0" option. An increase in the median size of microaggregates, in these cases, occurred due to a decrease in the proportion of the fraction <2 μm and an increase in the proportion of the fraction >50 μm in size.
Aggregation indices were calculated, by Gorkova 1975, and demonstrated the stabilization structural type of the initial soil. This type was persisting during the first two months of the experiment. However, for 6 months the structure had been plasticized, and moreover, the soil of the “R2-6” options acquired the coagulative-crystallization structural type.
Table 1 Particle and microaggregate sizes in the experiment
|
Particle size distribution, % in the volume
|
Probability of the options' similarity by F-test
|
|
С-0
|
C-2
|
R2-2
|
C-6
|
R2-6
|
С-0 & C-2
|
C-2 & R2-2
|
C-6 & R2-6
|
|
<2 µm
|
7
|
9
|
8
|
6
|
6
|
0.25
|
0.94
|
0.66
|
|
2 - 50 µm
|
91
|
89
|
88
|
81
|
83
|
0.85
|
0.19
|
0.00
|
|
>50 µm
|
2
|
1
|
4
|
13
|
11
|
0.66
|
0.53
|
0.02
|
|
Median (µm)
|
8
|
6
|
7
|
10
|
10
|
0.67
|
0.33
|
0.46
|
|
Microaggregate size distribution, % in the volume
|
|
|
<2 µm
|
5
|
10
|
6
|
1
|
1
|
0.01
|
0.00
|
0.00
|
|
2 - 50 µm
|
72
|
81
|
86
|
76
|
72
|
0.73
|
0.37
|
0.27
|
|
>50 µm
|
23
|
9
|
8
|
23
|
27
|
0.54
|
0.69
|
0.22
|
|
Median (µm)
|
13
|
8
|
10
|
21
|
23
|
0.71
|
0.43
|
0.05
|
|
Aggregation index related to 1 µm
|
1
|
1
|
1.5
|
1
|
47.0
|
|
|
Aggregation index related to 5 µm
|
1.4
|
1.2
|
1.3
|
2.0
|
2.3
|
3.5 Filtrate geochemistry
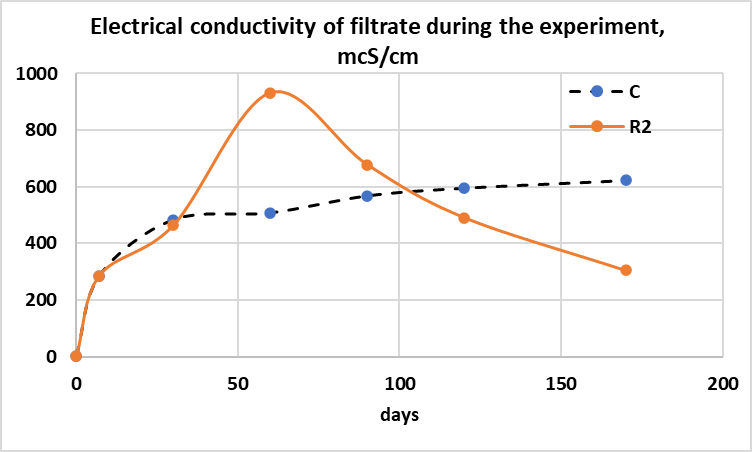
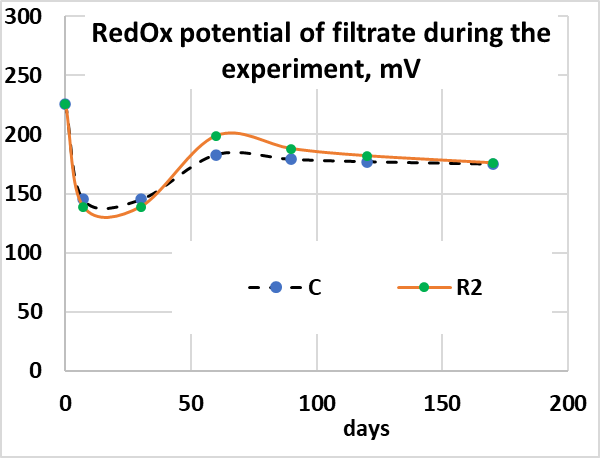
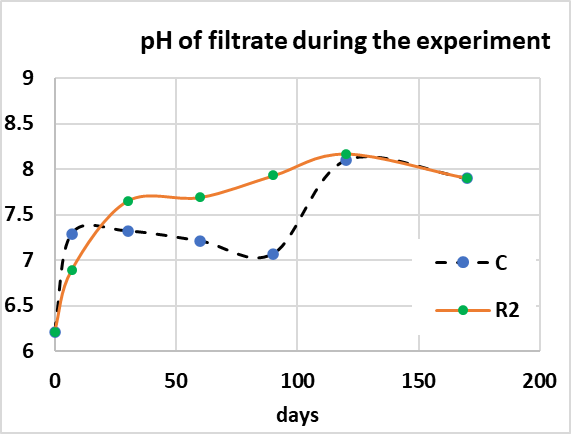
The first complete filtration cycle (point zero) caused the maximum rate of ions leaching in all experiment options, that is proved by an increase in electrical conductivity of water from 3 up to 285 μS/cm. There were clear differences between the options in the dynamics of electrical conductivity: in the “C” option, it asymptotically approached 600 μS/cm, and in the “R2” option, it showed a surge up to 900 μS/cm after 2 months of the experiment and a drop down to an initial value at 6 months' term. PO43-, NO2- and NO3- - anions appeared in the solution, that indicated biogenic compounds’ growth beginning. Herewith, the pH of the filtrate shifted from neutral (6.9) toward slightly alkaline and fluctuated in a range of 7.3-8.1 throughout the experiment; in the "R2" option, the values were about 0.5 pH higher than those of the "C" option until the 4th month of the experiment. Simultaneously, the RedOx potential after passing through a minimum of +140 mV after 1 month, stabilized at the level of +180 mV in both options. The filtrate ionic composition showed К+, HCO3- and NO3-- ions washed out, but the mobility of all other ions has decreased, in the “C” option. The filtrate of the “R2” option contained all the ions, except for Mg2+, at the concentrations lower than in the “C” option and those at the point zero; this especially was evident for К+, Br- and PO43- - ions.