Divergence of the whole Coronaviridae family within different populations and adaptation to cross host species barriers.
To comprehensively explore the evolution of the whole family of Coronaviridae, we performed a genomic comparison of Coronaviridae to search for new age patterns related to virulence or transmissibility, as shown in Supplementary Fig. 1. In the analysis of intra-species and inter-species genetic distances of whole genome sequences of Coronaviridae, it was obvious that the intra-species genetic distances were lower, as shown in Supplementary Fig. 1. For instance, the sequencing similarities of SARS-CoV-2 and bat-SL-CovZC45 and SARS-CoV-2 and bat-SL-CovZXC21 were nearly 88%; however, the similarities of SARS-CoV-2 and SARS-CoV and SARS-CoV-2 and MERS were 79% and 50%, respectively. According to a comparison of the genetic distances of H1N1 and H3N2 with those of SARS-CoV-2 and SARS-CoV, we found that the p-distance of SARS-CoV-2 and Bat SARS-like CoV was nearly 0.13 and the p-distance of SARS-CoV-2 and SARS-CoV was 0.24 in MEGA[28]. Both of these values were lower than the p-distances of H1N1 and H3N2 (0.8) and H1N1 and H7N9 (0.73). As shown in Supplementary Fig. 1, it was obvious that most inter-species genetic distances of Coronaviridae were longer than intra-species distances, i.e., SARS-CoV-2, SARS-CoV, SADS, NL63, MERS, London1, HKU5, HKU4, HKU3, HKU2, and BATS. Conversely, some inter-species genetic distances of Coronaviridae were shorter than the intra-species genetic distances, such as those for OC43, HKU9, HKU5, HKU1, and 229E, which may be the intermediate states of different species or subspecies in the whole evolutionary history of Coronaviridae. The relationship between variants and frequency in different geographical regions has been characterized, and the value of using age information in interpreting variants of functional and selective importance, such as using allele age estimates to power a rapid approach for inferring the ancestry shared between individual genomes in order to quantify genealogical relationships, has been demonstrated[3]. Here, we explored the divergence time of species or sub-species of Coronaviridae, which presented the diversity of such ages within populations separately associated with new functions or important turning points. Interestingly, we explored the dated variants of different species or subspecies and generated an atlas of new ages with SARS-CoV-2 as the reference genome in Supplementary Fig. 2. It was demonstrated that SARS-CoV, HKU3, and BATS were very close to SARS-CoV-2 and far away from OC43 and HKU1 on the S protein, although there were 5 kb insertions of BATS in Orf7a, Orf7b, and Orf8 and 15 kb deletions of OC43, HKU9, and HKU1 in Orf7a, Orf7b, Orf8 and N. All populations show evidence of insertions, deletions or substitutions that have driven the divergence of the whole family of Coronaviridae in response to natural selection.
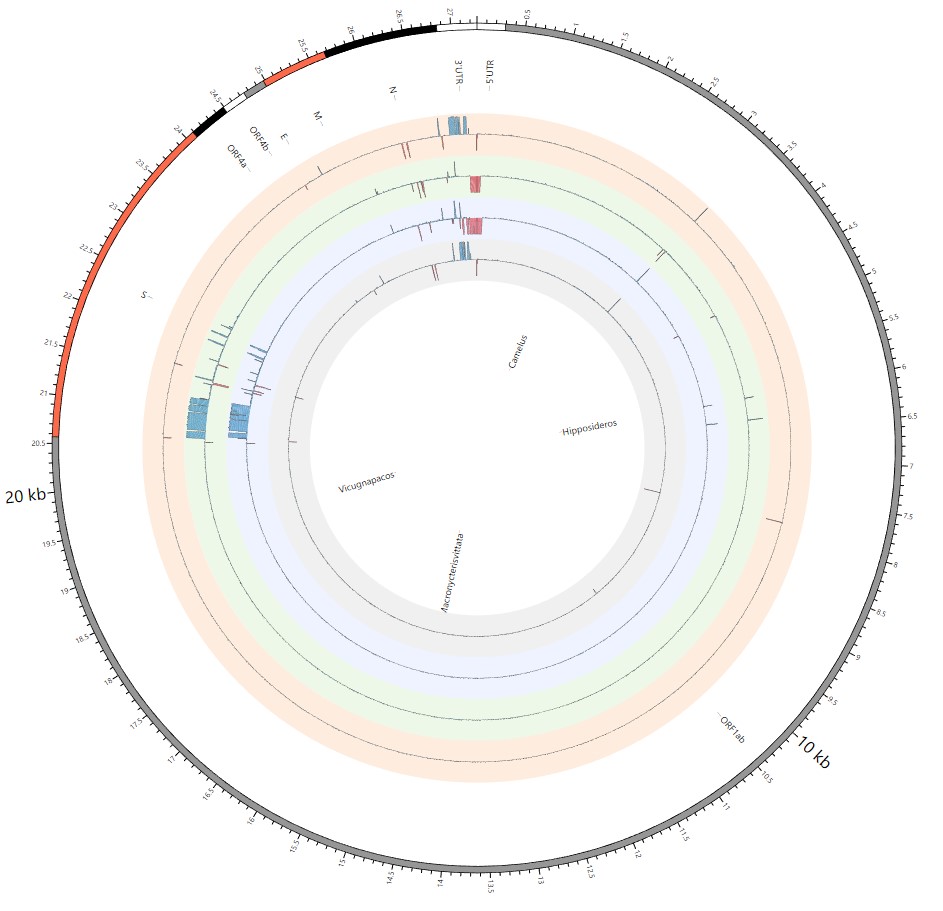
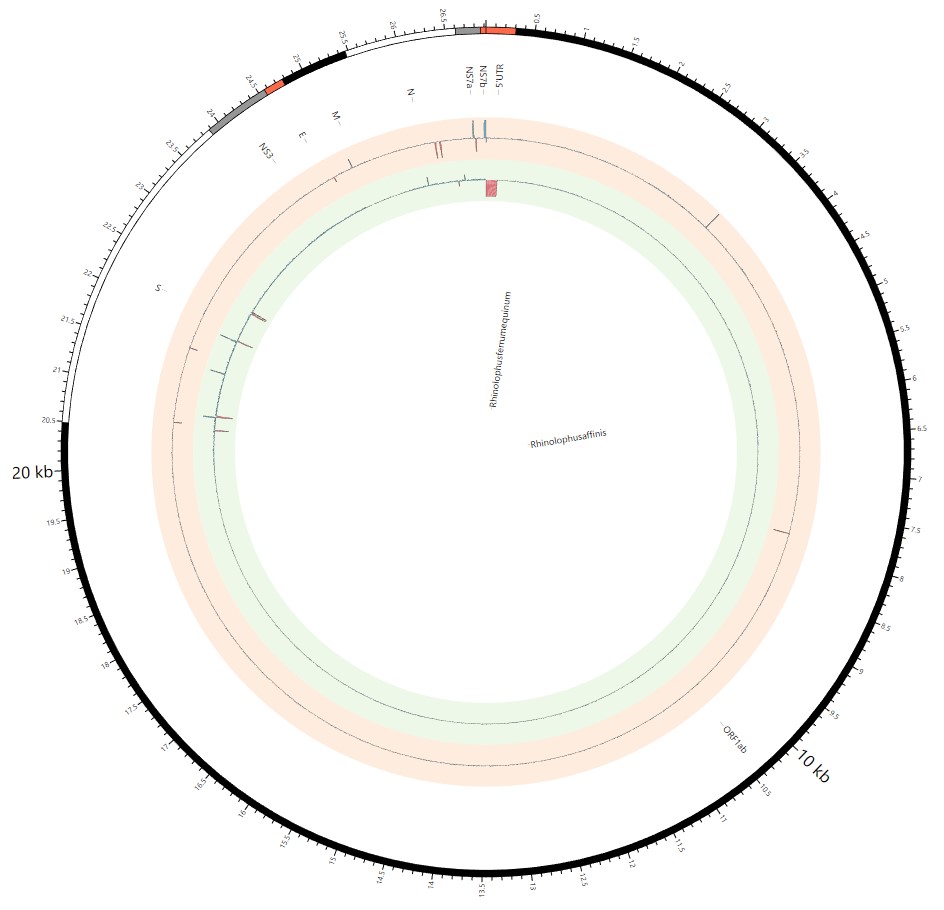
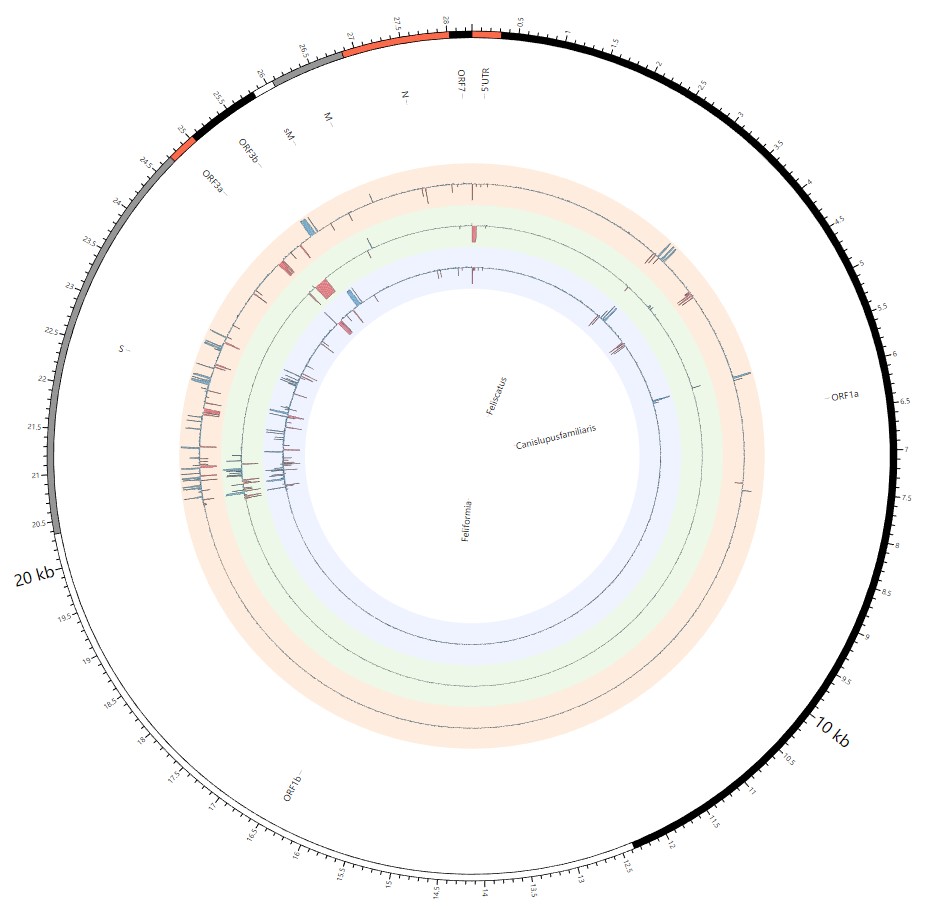
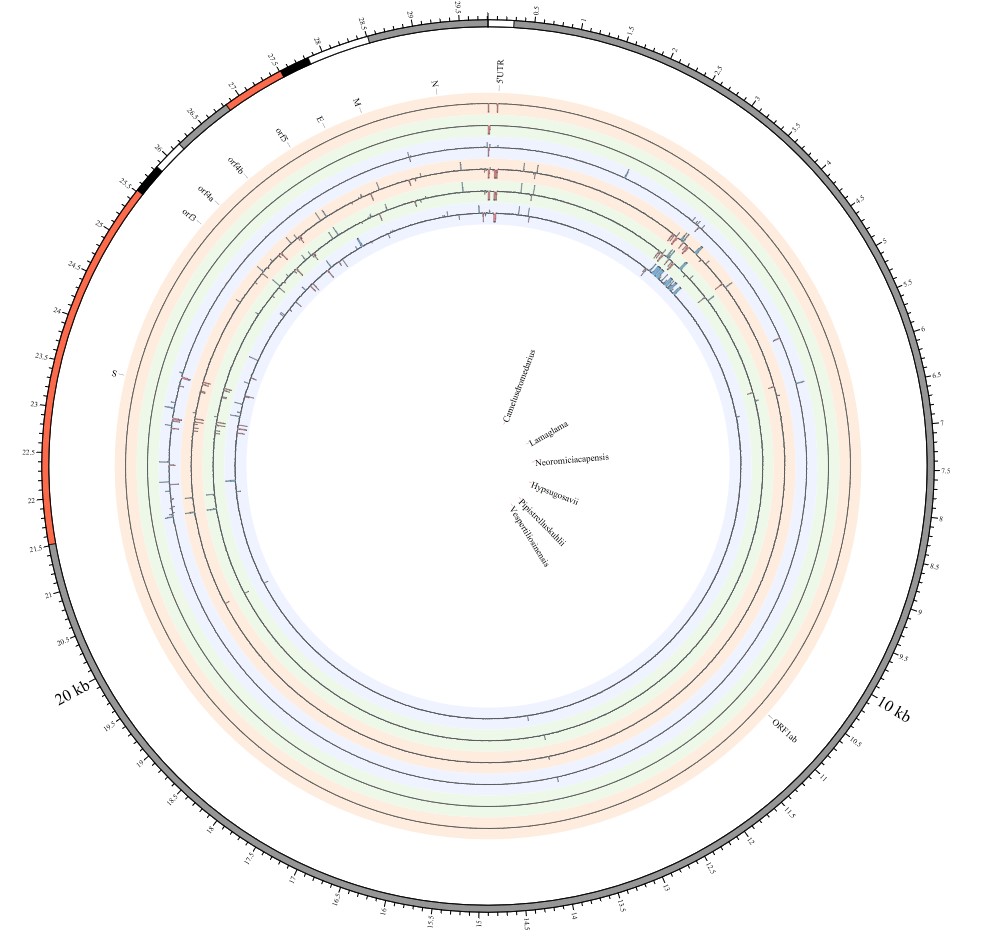
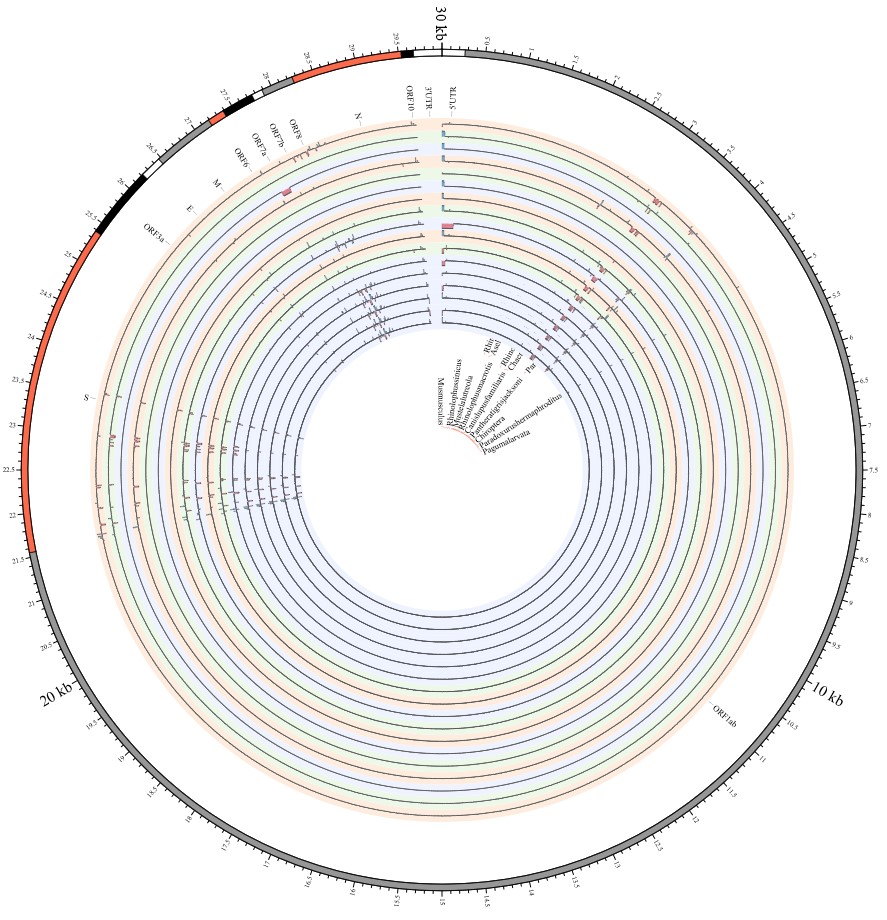
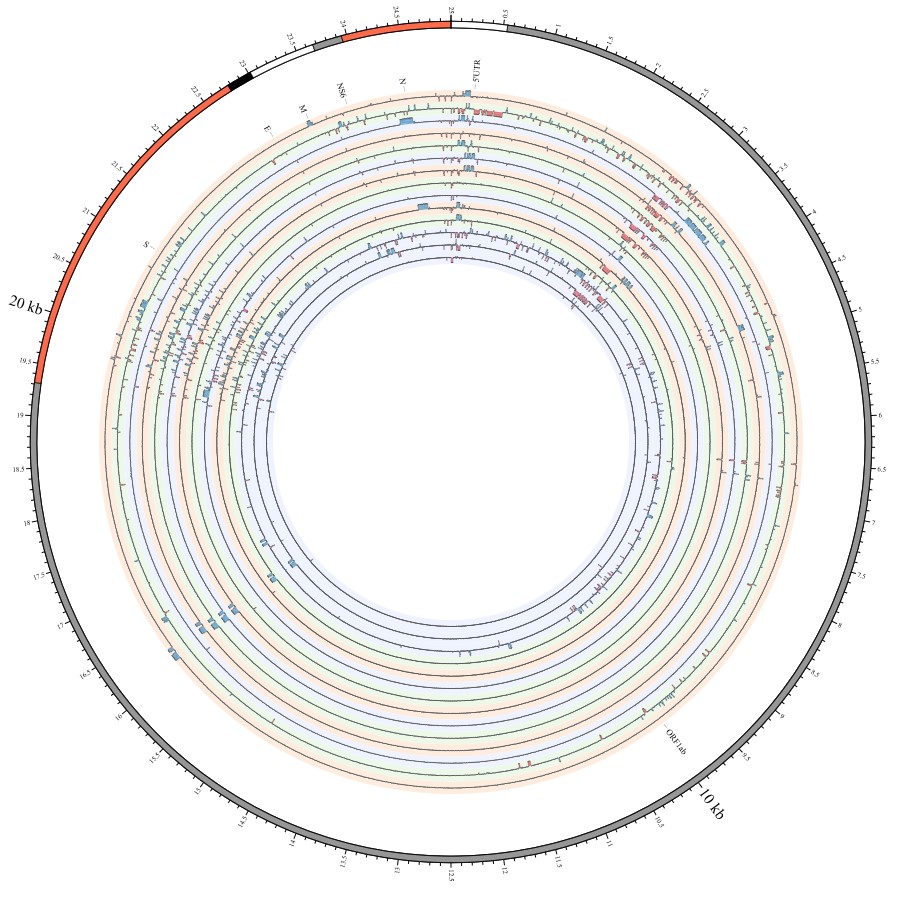
Most strikingly, as shown in Fig. 1 and Supplementary Table 1, the insertions and deletions of whole genome sequences between different hosts should play an important role in host transmission and the shift of Coronaviridae presented by Circos. For instance, human coronavirus 229E in Camelus and Vicugna pacos have S protein sequences similar to those observed in Homo sapiens, while having 500 bp deletions in Hipposideros and Macronycteris vittata. When used as the reference genome, Rhinacovirus in Sus scrofa was similar to that in Rhinolophus ferrumequinum and divergent from that in Rhinolophus affinis in that insertions and deletions all appeared in the S protein, which may be related to host bias. It is likely that accumulations of insertions and deletions of alphacoronavirus, human coronavirus OC43, Middle East respiratory syndrome-related coronavirus, severe acute respiratory syndrome-related coronavirus, Deltacoronavirus, and avian coronavirus emerged on the S protein. The similarity of SARS-CoV-2 S proteins in Rhinolophus sinicus, Rhinolophus macrotis, Canis lupus familiaris, and Panthera tigris jacksoni was very high with the SARS-CoV-2 S protein in Homo sapiens, which means that the ancestral hosts of SARS-CoV-2 in Homo sapiens should be close related to the species as detailed in Supplementary Figs. 3–10. Wildlife host species richness has been proposed as an important predictor of disease emergence. Likewise, host populations with low biodiversity might harbour fewer viruses and an increased risk of emergence. Conversely, high host biodiversity has also been linked to a decrease in disease risk through the ‘dilution effect’[11]. Advances in deep sequencing have made it possible to measure within-host genetic diversity in both acute and chronic influenza infections[29]. Factors such as antigenic selection, antiviral treatment, tissue specificity, spatial structure, and multiplicity of infection may affect how influenza viruses evolve within human hosts[29]. In summary, the more mutations viruses have, the greater the possibility of adaptation allowing them to cross host species barriers, which indicates that increased host diversity will protect against the emergence of pathogens.
The distribution of rates of different mutation types and codon usage bias in different lineages of SARS-CoV-2.
Pathogens have always been a major cause of human mortality, so they impose strong selection pressure on the human genome[30]. Across different lineages of SARS-CoV-2, most nucleotide substitutions were found in the regions of the S gene and N gene as presented in Supplementary Fig. 11, which clearly demonstrates that accumulations of mutations drove the evolutionary history of different lineages of SARS-CoV-2. Then, we demonstrated the richness distribution of different mutation types across the whole genomes, in which mutation rates of C->T, G->T and T->C were dominant in driving the divergence of different lineages of SARS-CoV-2, as shown in Fig. 2a and Supplementary Figs. 12–17. In particular, the mutation rate distributions of C->T were highly enriched in all lineages of SARS-CoV-2, and the mutation rate distributions of G->T were relatively rich in B.1.1.318, B.1.1.529 (Omicron), B.1.617.1 (Kappa), B.1.617.3, B.1.621 (Mu), B.1.640.1, B.1.640.2, C.1.2, C.37 (Lambda), and P.3 (Theta). Conversely, the patterns of A->T, T->G, G->C were relatively rare, and it was clear that some points with high mutation rates in the A->T distribution came from B.1.1.7 (Alpha) and B.1.621 (Mu); several points with high mutation rates in the T->G distribution came from B.1.526 (Lota), B.1.617.1 (Kappa), B.1.617.2 (Delta), and C.36.3; and some points in the G->C distribution came from B.1.525 (Eta), B.1.617.2 (Delta), B.1.617.3, B.1.621 (Mu), B.1.640.1 and B.1.640.2. Therefore, we believe that nucleosomal DNA undergoes fewer C->T mutations in SARS-CoV-2. This DNA is protected by the nucleosomal structure, with viral doublet histones essential for viral infectivity and viral defences leading to multiple host adaptation/transmission. In contrast, non-nucleosomal DNA may play dominant roles in the divergence of various lineages of SARS-CoV-2 in different regions of the world without the protection of nucleosomes.
Furthermore, we presented the recent amino acid substitutions among different SARS-CoV-2 lineages, including B.1.617.2 (Delta), B.1.1.529 (Omicron), B.1.1.7 (Alpha), B.1.351 (Beta), P.1 (Gamma), C.37 (Lambda), B.1.621 (Mu), C.1.2, B.1.525 (Eta), B.1.526 (Lota), B.1.617.1 (Kappa), B.1.617.3, P.3 (Theta), B.1.1.318, C.36.3, B.1.640.1, and B.1.640.2, with a focus on NSP2, NSP3, NSP5, NSP12, NSP13, Spike, NS3, NS8, and N proteins in Fig. 2b and Supplementary Table 1, which have strong effects on the divergence and evolutionary history of different lineages. This is especially true for the Spike protein, which contains a receptor-binding domain (RBD), a fusion domain and a transmembrane domain, and the NSP3 protein that is the N-terminus of coronavirus SARS-CoV non-structural protein 3 (Nsp3) and related proteins. Interestingly, compared with the dominant amino acid substitutions, i.e., NSP12:P323L and S:D614G, there seem to be unique and specific amino acid substitutions in one lineage relative to another lineage. Examples include the NSP2:P129L, NSP2:E272G, NSP2:L462F, S:E154Q, S:I210T, and S:D936H substitutions in the B.1.640.1 lineage; NSP13:V371A, S:P129L, S:D1139H, and NS8:C37R substituted in the B.1.640.2 lineage; NSP2:S358L, and NSP3:E378V substitutions in the B.1.1.318 lineage; NSP3:A41V, NSP3:D821Y, NSP13:D105Y, S:S12F, S:G212V, and S:A899S substitutions in the C.36.3 lineage; S:K2Q, S:L280F, S:G313S, S:A368V, S:D736G, S:E1092K, and S:H1101Y substitutions in the P.3 (Theta) lineage; NSP3:A1T, S:Q779K, S:E1072K, NS8:T26I, and N:P67S substitutions in the B.1.617.3 lineage; NSP13:G206C, NSP13:M429I, S:Q1071H, and NS3:L15F in the B.1.617.1 (Kappa) lineage; NSP13:Q88H, S:D253G, NS3:P42L, N:P199L, N:M234I, S:D253G, NS3:P42L, N:P199L, and N:M234I substitutions in the B.1.526 (Lota) lineage; NSP3:T1198I, S:Q52R, S:P323F, S:Q677H, NS3:T89I, NS3:S92L, NS3:G172C, and N:A12G substitutions in the B.1.525 (Eta) lineage; NSP3:P822S, S:P25L, S:C136F, S:A879T, NS3:T223I, and NS3:D238Y substitutions in the C.1.2 lineage; NSP3:T237A, NSP3:A562T, NSP3:T720I, NSP13:P419S, S:Y146S, S:H147T, S:T205I, S:R346K, NS8:P38S, and NS8:S67F substitutions in the B.1.621 (Mu) lineage; S:P13L, S:G75V, S:V76I, and S:T428I substitutions in the C.37 (Lambda) lineage; S:L18F, S:T20N, S:P26S, S:D138Y, S:S247G, S:E341D, S:S371L, S:K977Q, and S:T1027I substitutions in the P.1 (Gamma) lineage; NSP3:K837N, S:D80A, NS3:L52F, and NS3:S171L substitutions in the B.1.351 (Beta) lineage; NSP3:T183I, NSP3:A890D, S:A570D, S:S982A, S:D1118H, NS8:R52I, NS8:K68Stop, NS8:Y73C, and N:S235F substitutions in the B.1.1.7 (Alpha) lineage; NSP3:K38R, NSP3:M84V, NSP3:V1069I, S:G339D, S:S371L, S:S373P, S:S375F, S:N440K, S:G446S, S:S477N, S:Q493R, S:G496S, S:Q498R, S:Y505H, S:T547K, and S:N764K substitutions in the B.1.1.529 (Omicron) lineage; and NSP3:A488S, NSP12:P227S, and S:P77L substitutions in the B.1.617.2 (Delta) lineage.
Provided that the amino acid composition of the proteomes reflects the action of natural selection to enhance metabolic efficiency, synonymous codon usage bias as a measure of translation rates and shows increases in the abundance of less energetically costly amino acids in highly expressed proteins [31]. Comparison of the relative fixation rates of synonymous (silent) and nonsynonymous (amino acid-altering) mutations provides a means for understanding the mechanisms of molecular sequence evolution[31], and positive selection might be expected to follow viral emergence in a new host species because this event would obviously entail a major boost in the number of susceptible hosts and a concomitant increase in fitness[32]. The compiled codon usage data for different lineages of SARS-CoV-2 are presented in Supplementary Table 1. We summarize the synonymous codon usage of all different lineages of SARS-CoV-2 in Fig. 2c and Supplementary Table 1. In the B.1.640.2 lineage, codon AGU was obviously biased for Ser, codon UUU was stronger for Phe in the B.1.640.1 and P.3 (Theta) lineages, and codon GCU was clearly biased for Ala in the B.1.617.2 (Delta) lineage. That is, a large selective difference between lineages of SARS-CoV-2 was required for strong codon usage bias.
Clock-like prediction of focal outbreak points worldwide to provide warnings.
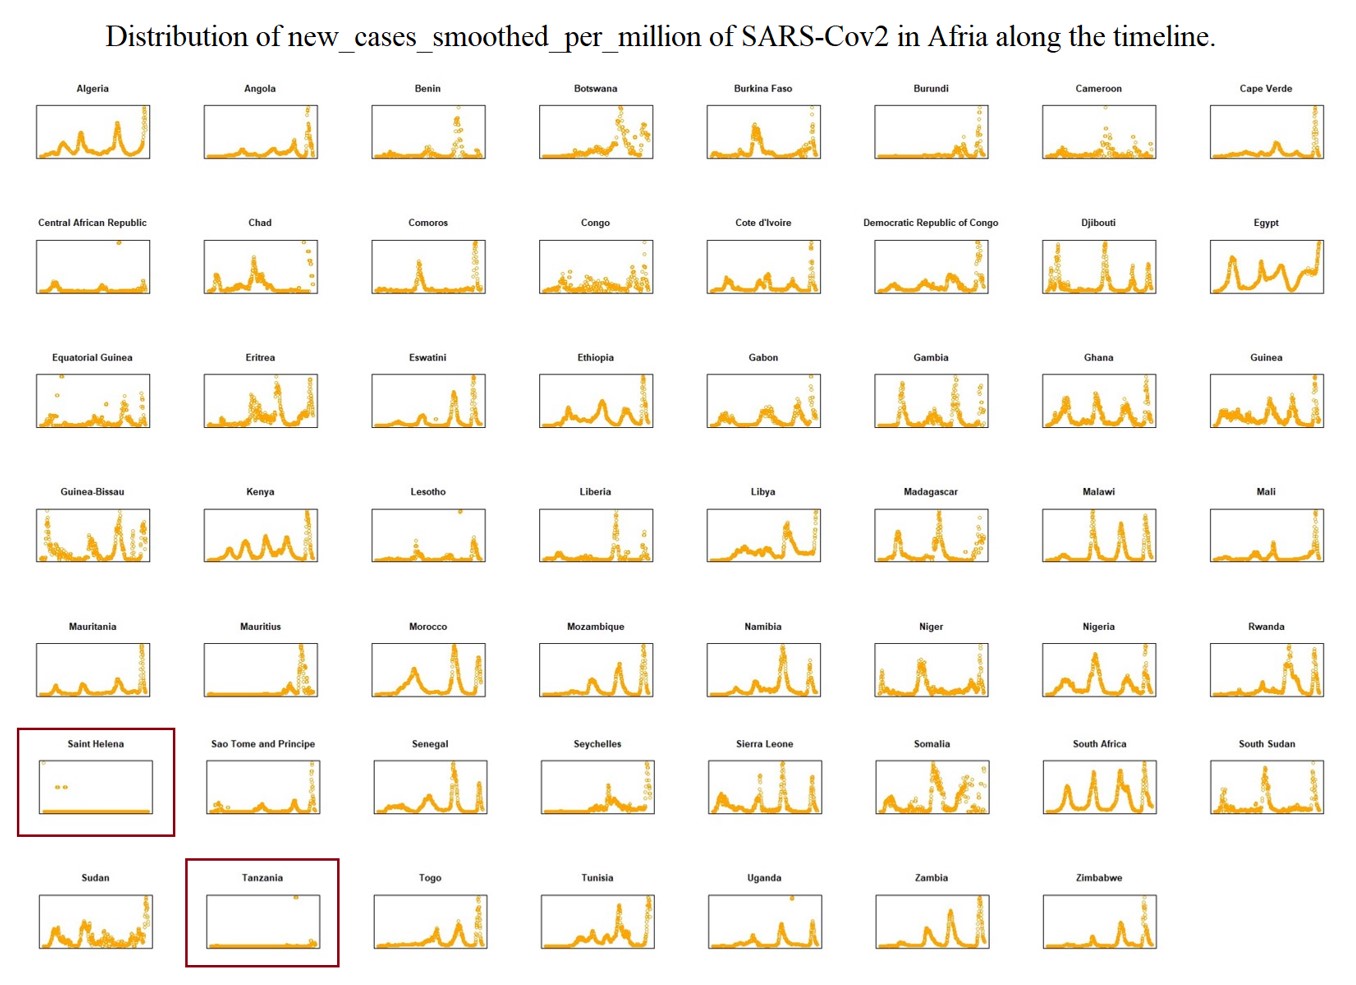
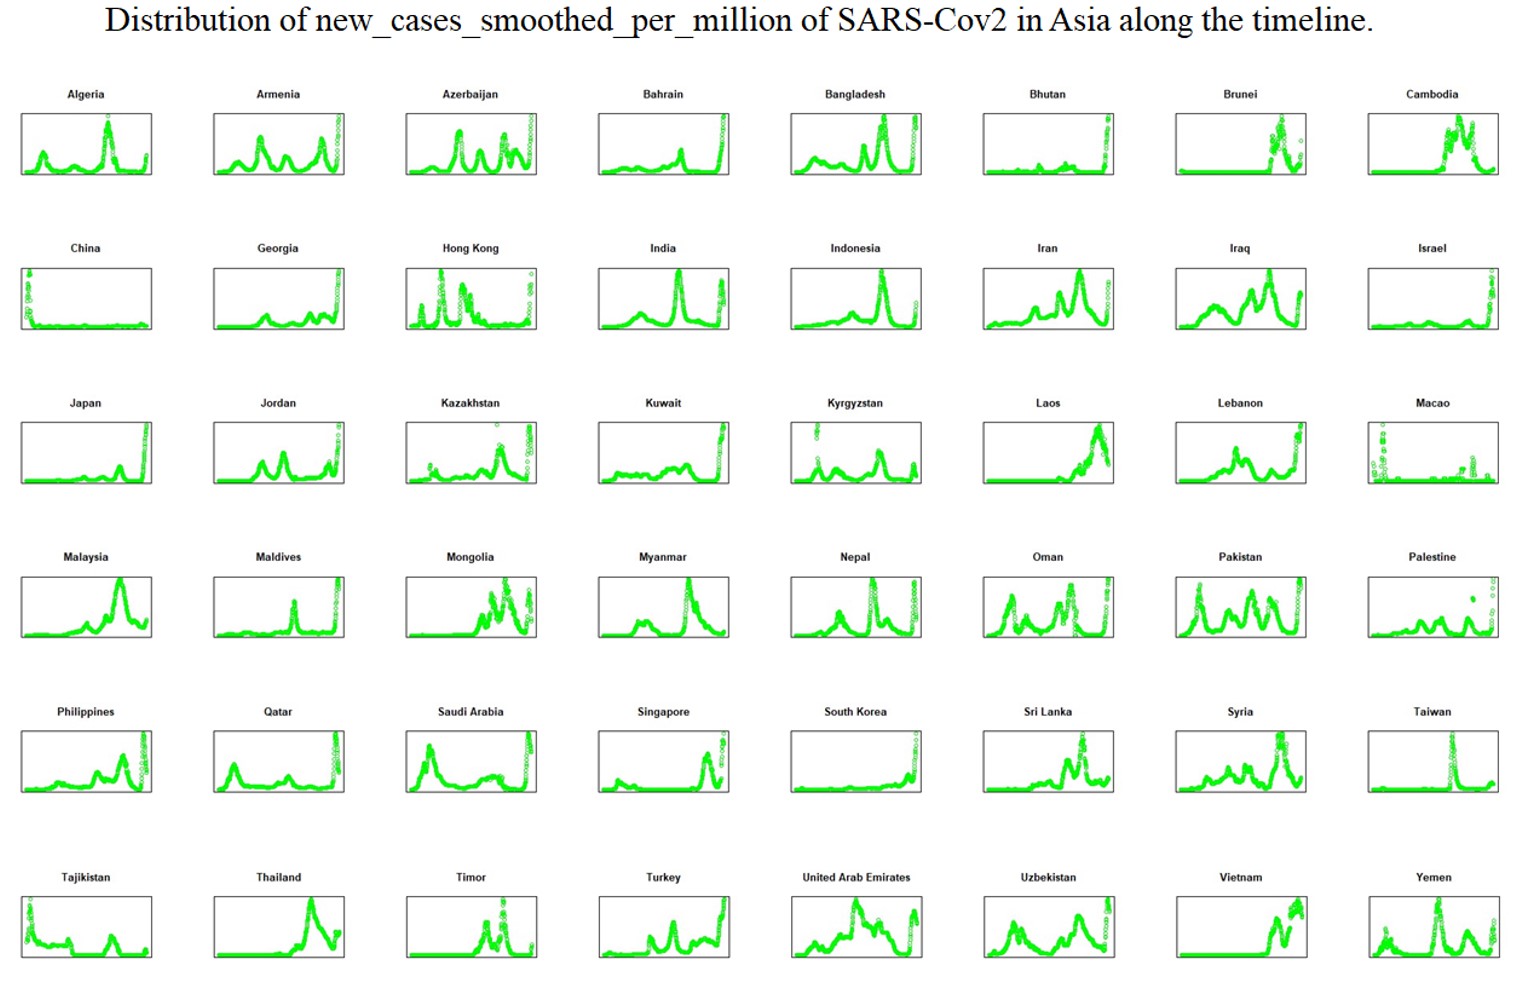
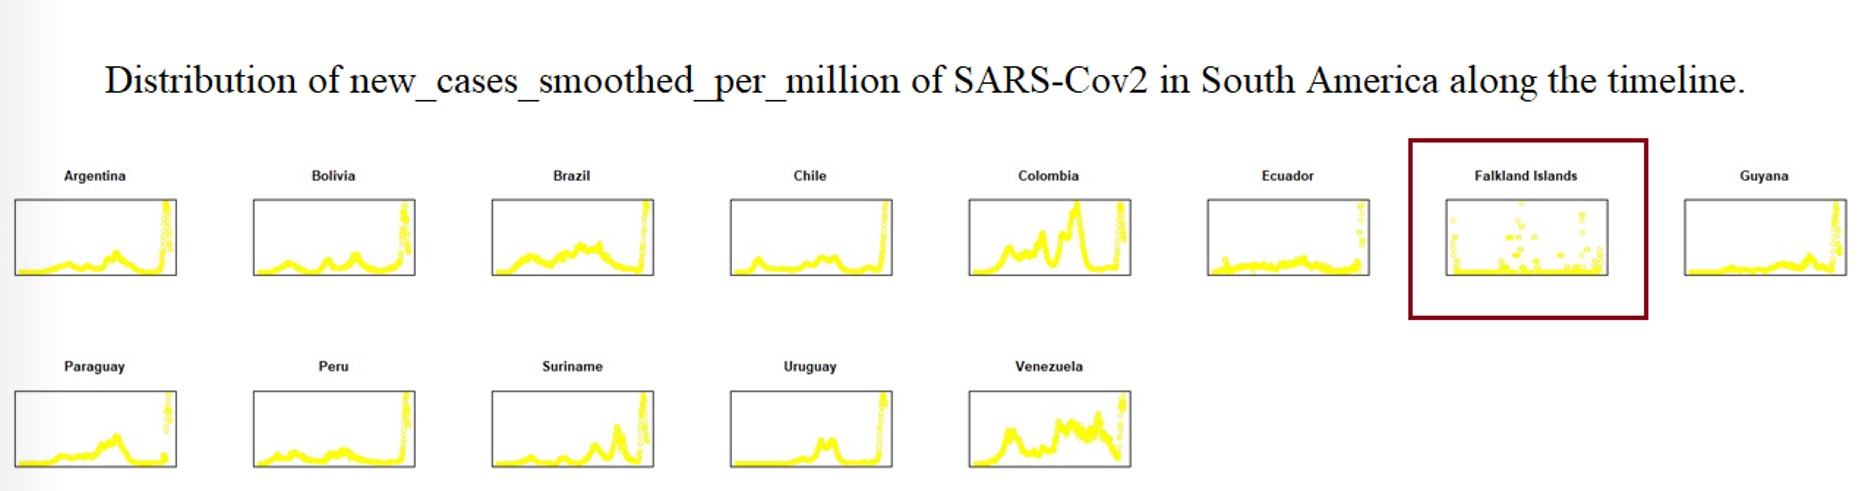
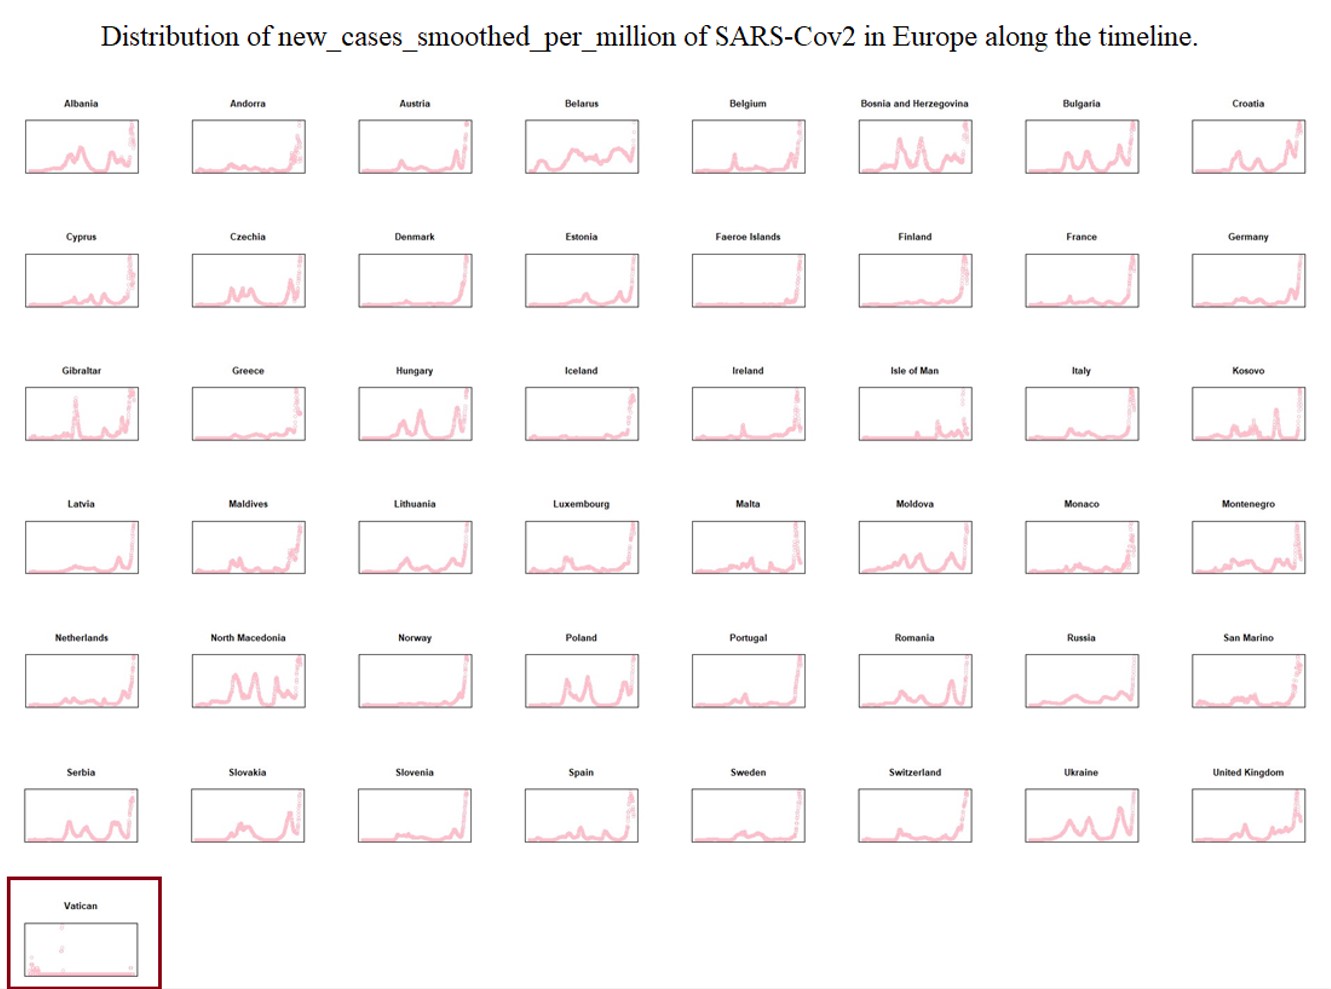
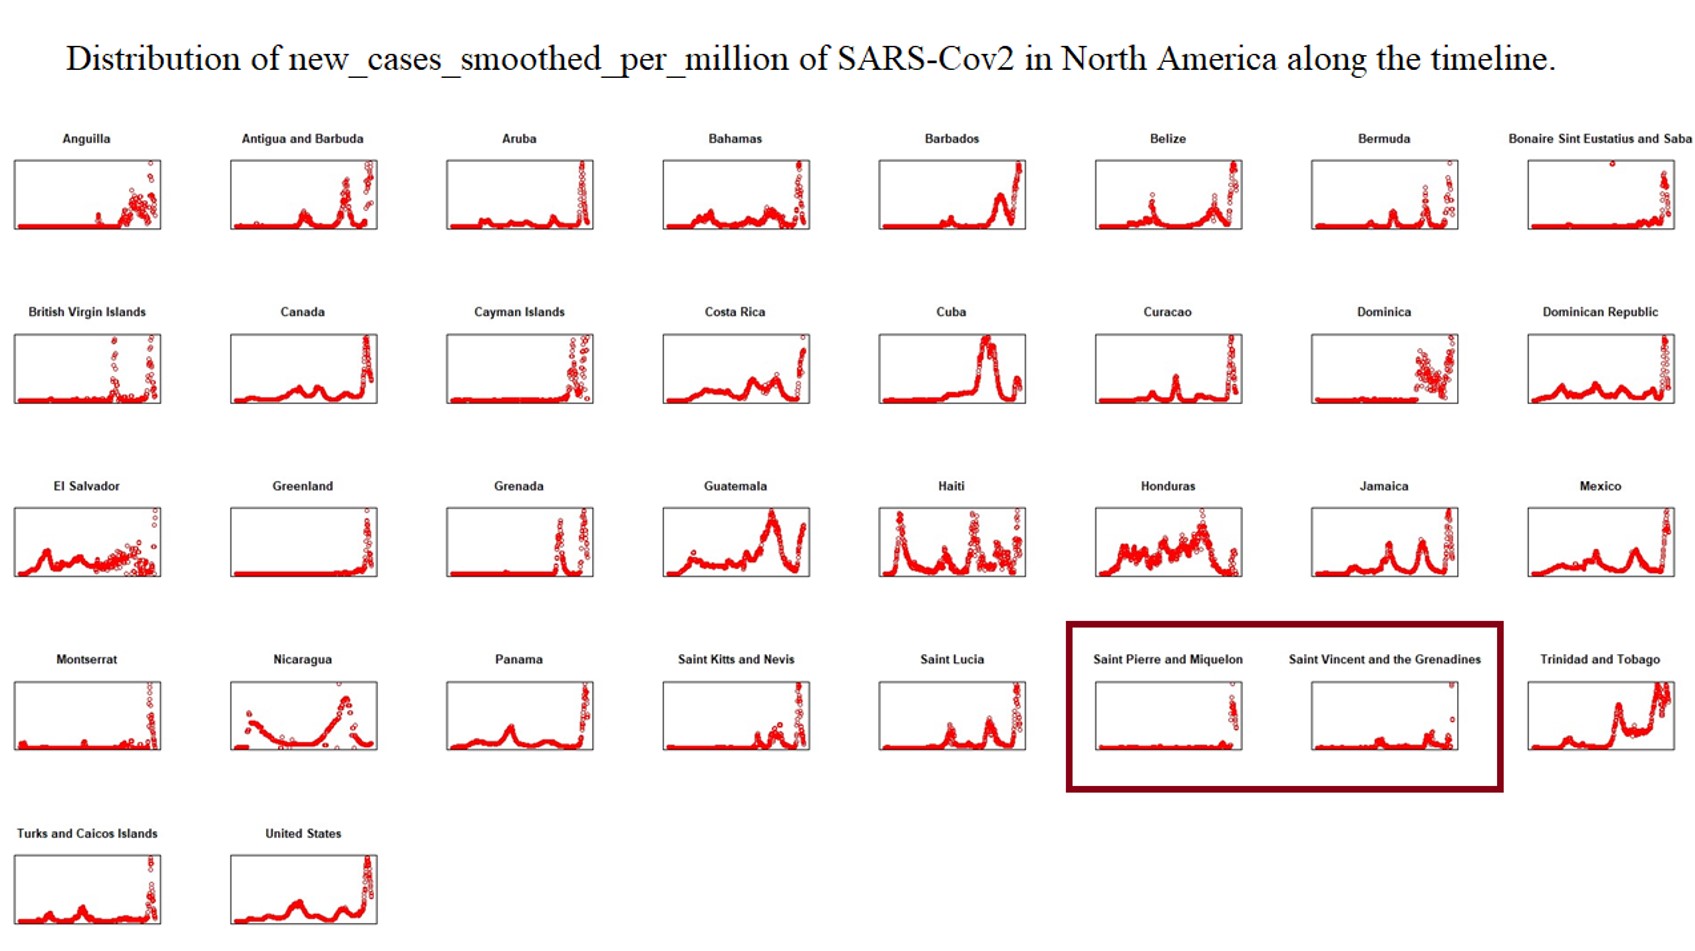
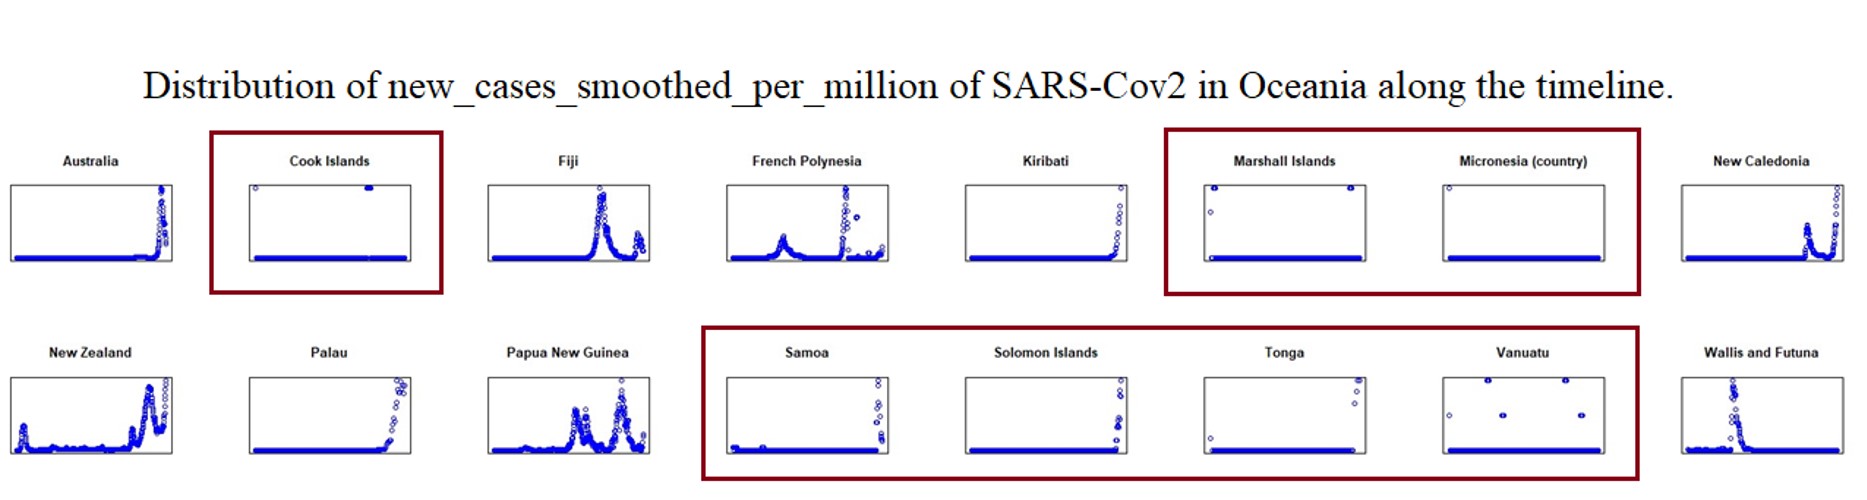
To explain the epidemic outbreak points related to key mutations, we set the Epi-Clock device to predict potential epidemics and assist in the presentation of detailed mutation information for severely affected areas. Therefore, we analysed the whole evolutionary pathway in the timeline of lineages of SARS-CoV-2 presented in Supplementary Table 2; i.e., each lineage followed the same principle in which accumulations of mutations were the driving force of the phylogenetic relationships among different lineages of SARS-CoV, showing information for the earliest publicly collected samples in different regions of the world. At the same time, we summarized the smoothed distribution of new cases per million cases of SARS-CoV-2 in different severely affected areas, such as Africa, Asia, Europe, North America, Oceania, and South America, along the timeline from OWID[33] in Supplementary Figs. 18–24. Interestingly, we found the pattern of an increasing number of other types of substitutions (shown with an asterisk) as the hitchhiking effect progressed, especially in the pre-breakout phase, even though some substitutions were replaced by other dominant genotypes, as shown in the red box in Fig. 3a, Fig. 3b, Supplementary Table 2 and Supplementary Figs. 25–32.
Hypothesized that specific amino acid substitutions would be triggers for outbreaks. To predict potential epidemic outbreaks, we proposed the ZHU algorithm presented in Fig. 4a and tested it on different true sets of SARS-CoV-2 data before outbreaks to search for real significant mutational accumulation patterns related to the outbreak events. As we known, phylogeographic inference methods could also be used to provide insights into the factors driving virus spread, and it reported that an application of generalized linear modelling to explain Ebola virus migration rates between locations as a function of several potential predictors, to infer virus spread during West African Ebola outbreak[26]. Geographic distances and population sizes at the location of origin and destination combined into a gravity model of spread, with virus transmission largely occurring within large population centres and geographic spread being more frequent over shorter distances[26]. However, our prediction of outbreak was only performed by significant amino acids substitutes excluded other epi-factors. To avoid system errors, that is, errors caused by regions varying in other epi-factors such as population density, geographical environment, vaccination coverage rates and national/social rules and norms, we extracted the true sets by the control group in different individual countries or regions as the individual related values of the new cases per million. Then, we separately performed GLM analysis on individual countries/regions to find the optimal mutational patterns as in the training phase.
Very interestingly, it was obvious that amino acid substitution type X13.NSP3_T183I.I was a potential epi-factor in Iran, the Netherlands and Norway. X74.S_S371L.L was significantly correlated with numbers of new cases in Finland, Canada and Brazil, as shown in Fig. 4b. Across N generations of training by GLM and reordering, we found 171 significant substitutions as potential epi-factors within 55 different countries and regions, as demonstrated in Supplementary Table 3. Finally, we successfully presented the performance of the ZHU algorithm on 42 validation sets in Fig. 4c. From most validations, we could accurately predict the potential pre-phase of the outbreak by ZHU prediction. Nevertheless, in only four countries, our model could not be fitted because of unavailable sequencing samples in the outbreak phase, such as in Jamaica, Kyrgyzstan, Libya, and Palestine. By counting the number of true instances, we summarized the precision, recall, and accuracy of Epi-Clock with the true validation sets as presented in Fig. 4d and Supplementary Table 3, where the median interval before outbreaks was 5 days. Distinguished with EpiFactors [22], which included 815 proteins with 95 histones and protamines involved in epigenetic regulation, we have extracted 171 significant amino acid substitutions as potential epi-factors within 55 different countries and regions presented in Supplementary Table 3.