Divergence of the whole Coronaviridae family within different populations and adaptation to cross host species barriers.
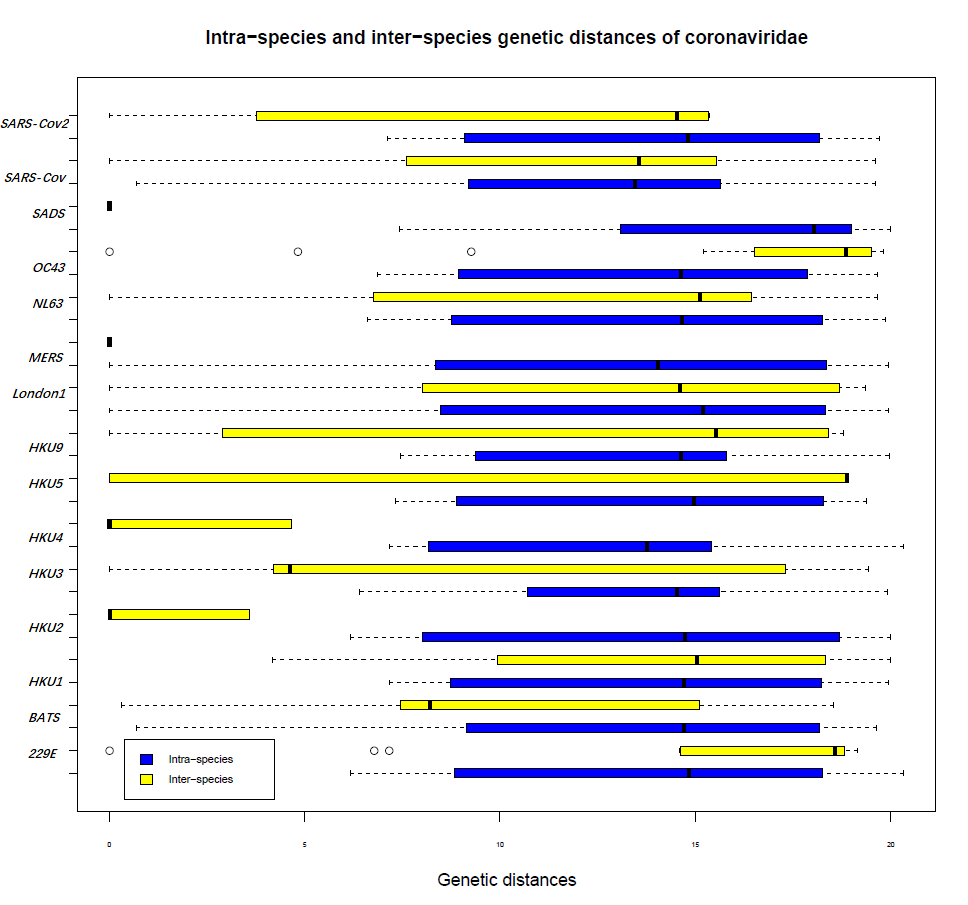
To comprehensively explore the evolution of the whole family of Coronaviridae, we performed a genomic comparison of Coronaviridae to search for new age patterns related to virulence or transmissibility, as shown in Supplementary Fig. 1. In the analysis of intra-species and inter-species genetic distances of whole genome sequences of Coronaviridae, it was obvious that most inter-species genetic distances of Coronaviridae are longer than intra-species distances, i.e., SARS-CoV-2, SARS-CoV, SADS, NL63, MERS, London1, HKU5, HKU4, HKU3, HKU2, and BATS. For instance, the sequencing similarities of SARS-CoV-2 and bat-SL-CovZC45 and SARS-CoV-2 and bat-SL-CovZXC21 are nearly 88%; however, the similarities of SARS-CoV-2 and SARS-CoV and SARS-CoV-2 and MERS are 79% and 50%, respectively. According to a comparison of the genetic distances of H1N1 and H3N2 with those of SARS-CoV-2 and SARS-CoV, we found that the p-distance of SARS-CoV-2 and Bat SARS-like CoV was nearly 0.13 and the p-distance of SARS-CoV-2 and SARS-CoV was 0.24 in MEGA[23]. Both of these values are lower than the p-distances of H1N1 and H3N2 (0.8) and H1N1 and H7N9 (0.73). Conversely, some inter-species genetic distances of Coronaviridae are shorter than the intra-species genetic distances, such as those for OC43 and 229E, which may be the intermediate states of different species or subspecies in the whole evolutionary history of Coronaviridae.
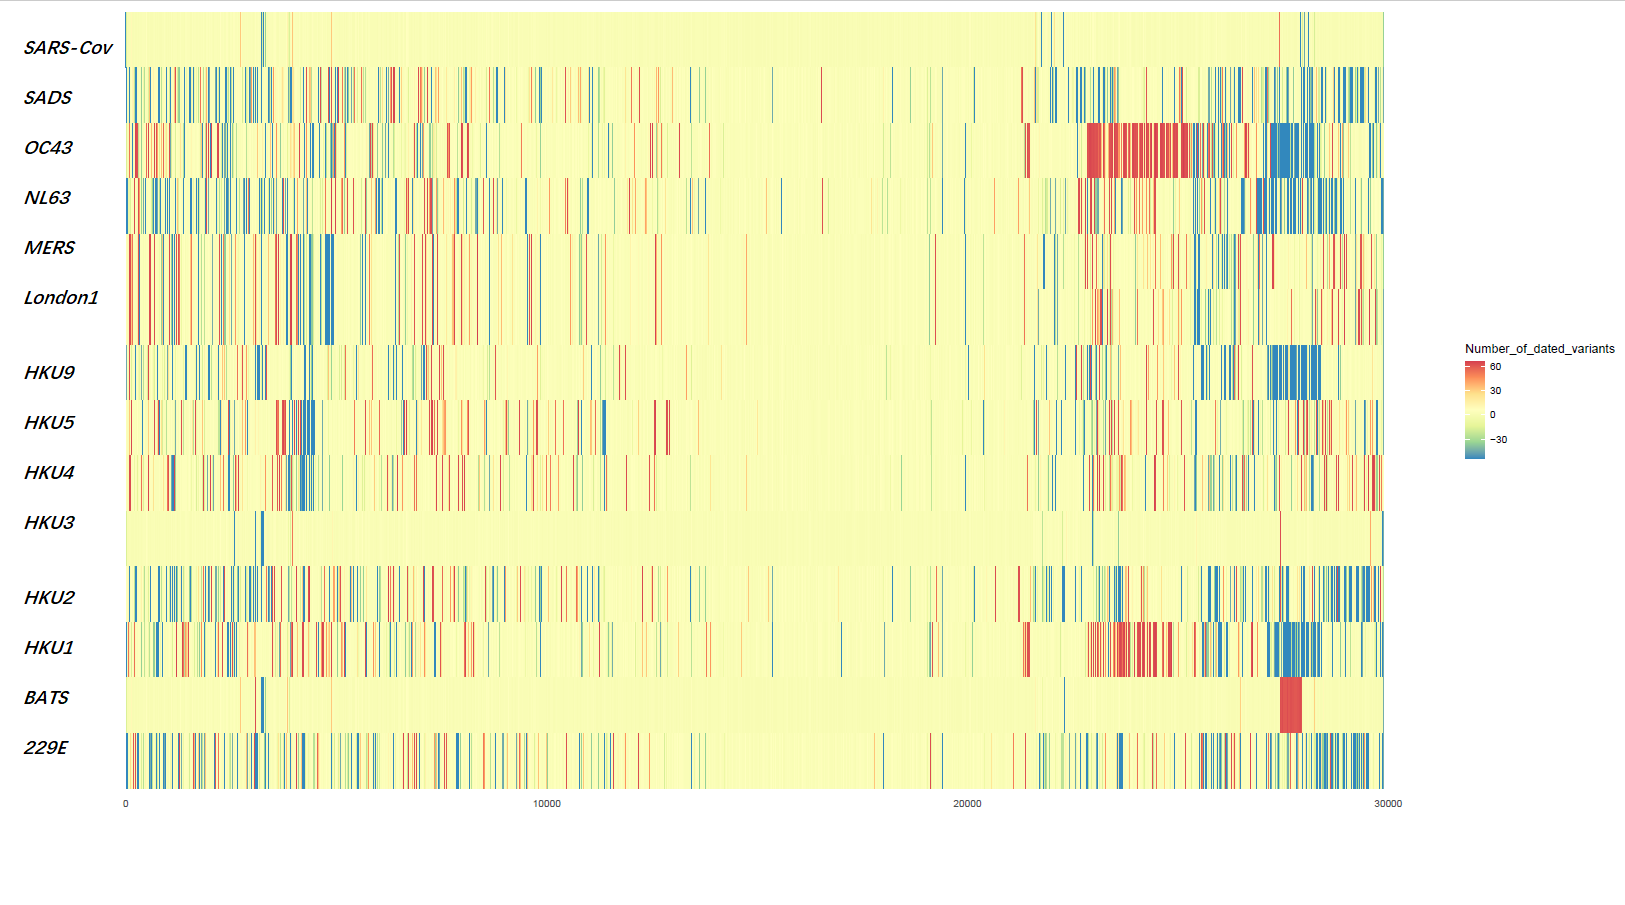
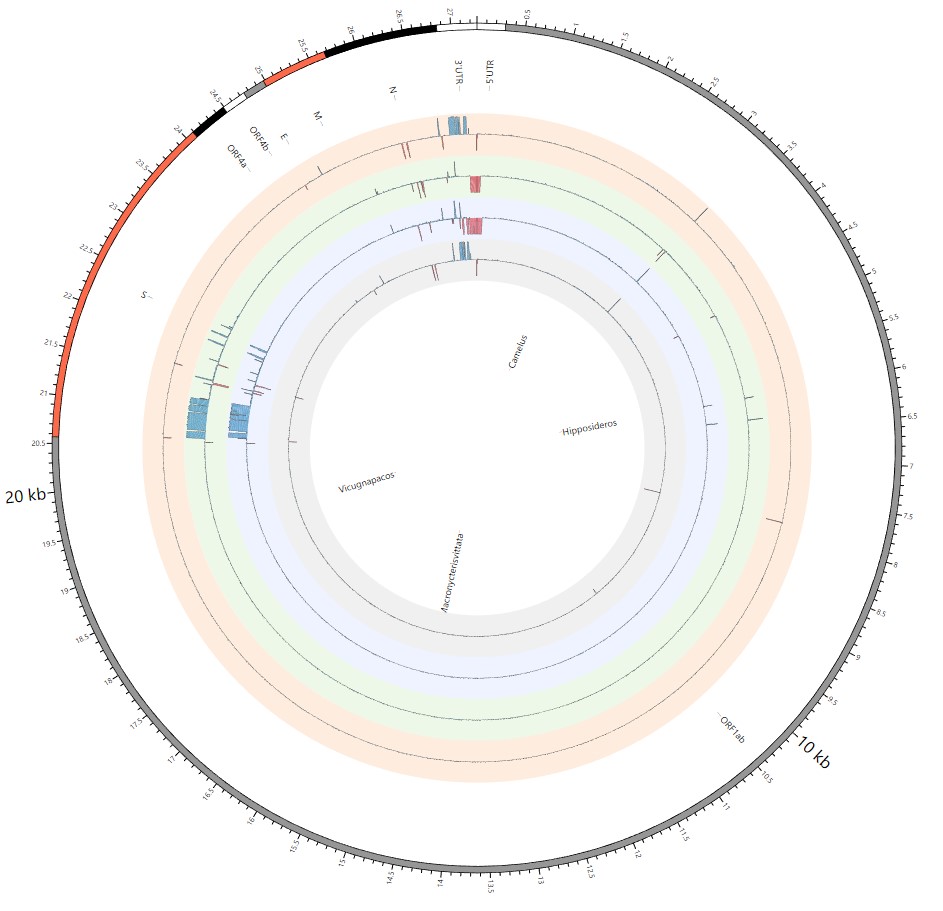
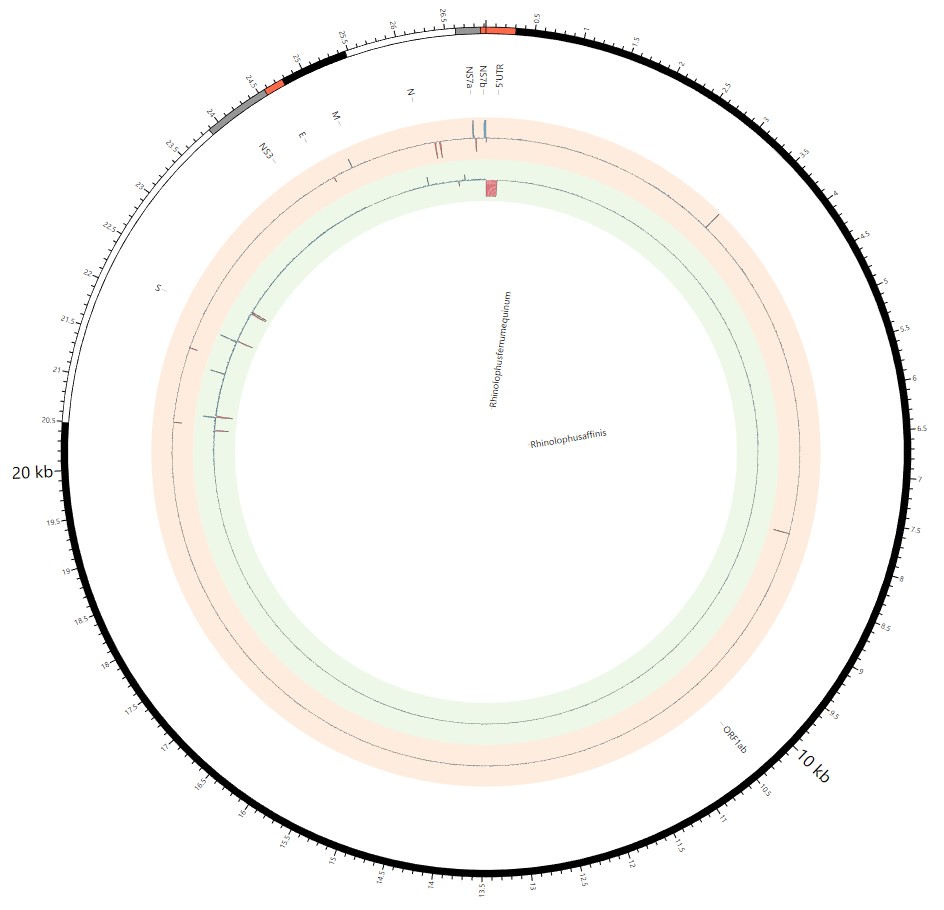
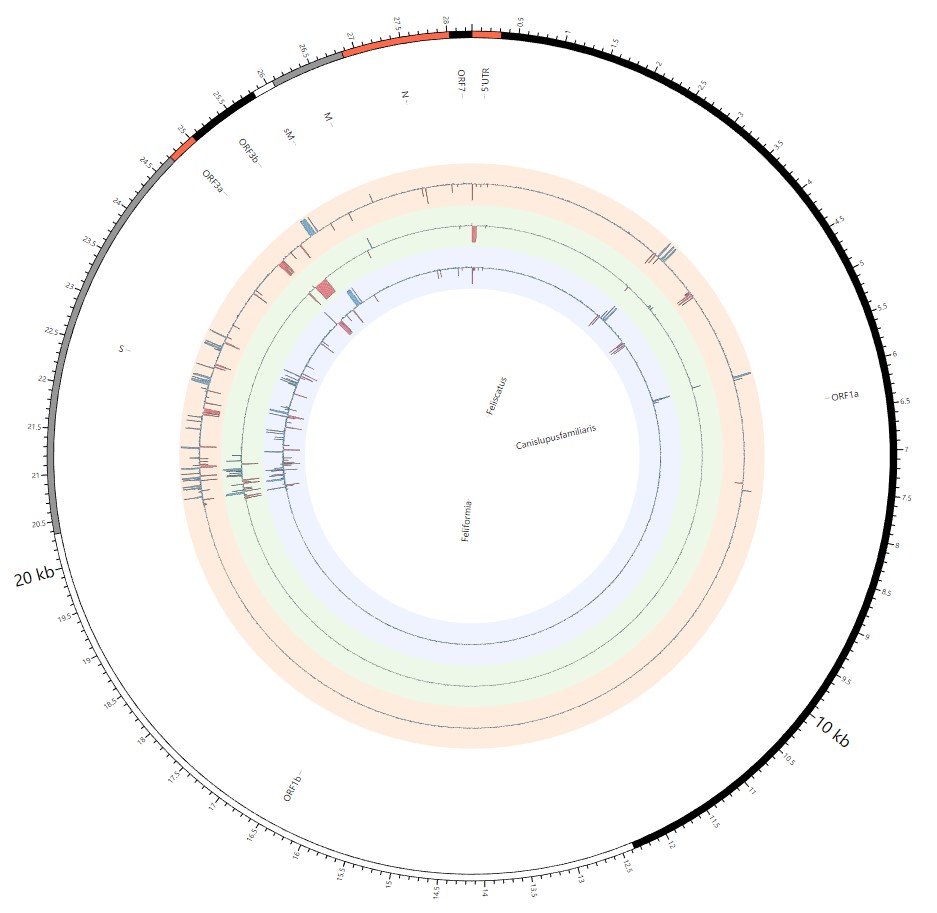
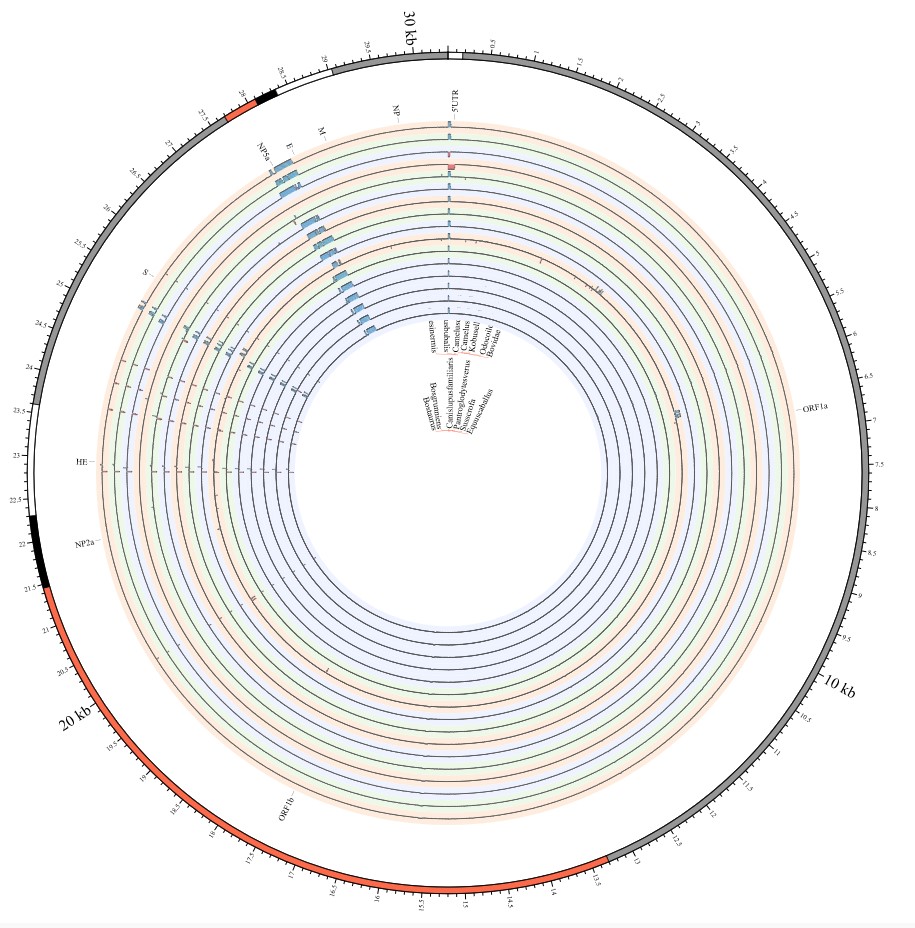
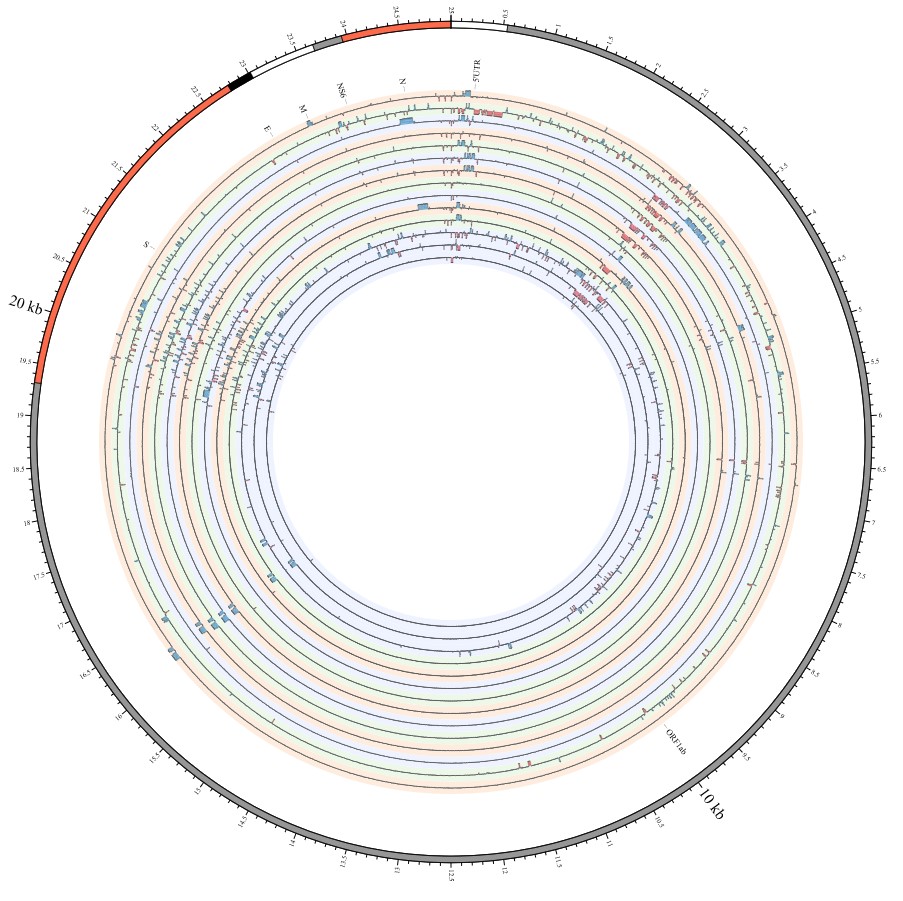
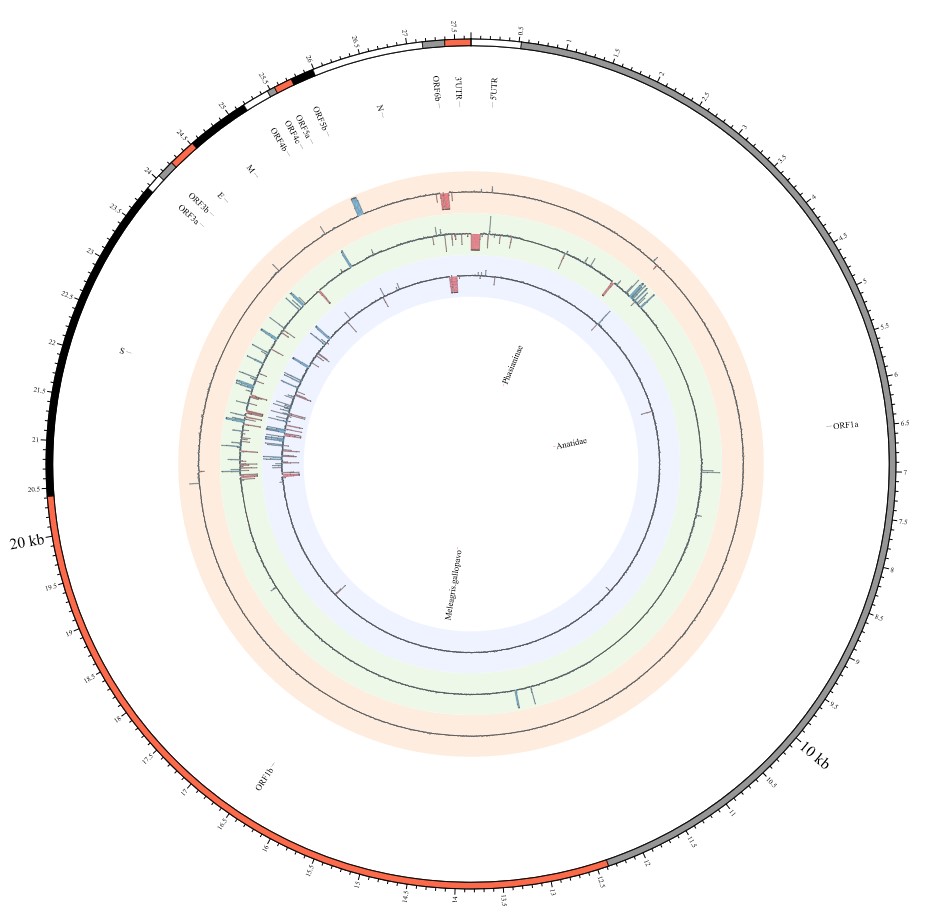
Here, we explore the divergence time of species or sub-species of Coronaviridae, which presented the diversity of such ages within populations separately associated with new functions or important turning points. Interestingly, we explored the dated variants of different species or subspecies and generated an atlas of new ages with SARS-CoV-2 as the reference genome in Supplementary Fig. 2. It was demonstrated that SARS-CoV, HKU3, and BATS are very close to SARS-CoV-2 and far away from OC43 and HKU1 on the S protein, although there are 5 kb insertions of BATS in Orf7a, Orf7b, and Orf8 and 15 kb deletions of OC43, HKU9, and HKU1 in Orf7a, Orf7b, Orf8 and N. Most strikingly, as shown in Fig. 1 and Supplementary Table 1, the insertions and deletions of whole genome sequences between different hosts should play an important role in host transmission and the shift of Coronaviridae presented by Circos. For instance, human coronavirus 229E in Camelus and alpaca (Vicugna pacos) have S protein sequences similar to those observed in Homo sapiens, while having 500 bp deletions in striped leaf-nosed bats (Hipposideros and Macronycteris vittata). When used as the reference genome, Rhinacovirus in piglets (Sus scrofa) was similar to that in wild greater horseshoe bat (Rhinolophus ferrumequinum) and divergent from that in intermediate horseshoe bat (Rhinolophus affinis) in that insertions and deletions all appear in the S protein, which may be related to host bias. It is likely that accumulations of insertions and deletions of alphacoronavirus, human coronavirus OC43, Middle East respiratory syndrome-related coronavirus, severe acute respiratory syndrome-related coronavirus, Deltacoronavirus, and avian coronavirus emerged on the S protein. The similarity of SARS-CoV-2 S proteins in the Chinese rufous horseshoe bat (Rhinolophus sinicus), the big-eared horseshoe bat (Rhinolophus macrotis), dogs (Canis lupus familiaris), and Malayan tiger (Panthera tigris jacksoni) is very high with the SARS-CoV-2 S protein in Homo sapiens, which means that the ancestral hosts of SARS-CoV-2 in Homo sapiens should be closely related to the species as detailed in Supplementary Figs. 3–10. In summary, the more mutations viruses have, the greater the possibility of adaptation allowing them to cross host species barriers, which indicates that increased host diversity of pathogen would accumulatively enlarge the population size of potential hosts with different species or subspecies, and protect against the emergence of pathogens.
The distribution of rates of different mutation types and codon usage bias in different lineages of SARS-CoV-2.
Across different lineages of SARS-CoV-2, 538 nucleotide substitutions such as C1876T(B.1.1.318), A2791G(B.1.1.529), C874T(B.1.1.7), C1055T(B.1.351), C1473T(B.1.525), C1034T(B.1.526), C2999T(B.1.617.1), C3012T(B.1.617.2), C787T(B.1.617.3), C3033T(B.1.621), C535T(B.1.640.1), C1154T(B.1.640.2), C515T(C.1.2), C569T(C.36.3), C3032T(C.37), T702C(P.1), C1714T(P.3) were found in the regions of the NSP2, NSP3, NSP12, NSP13, S, N, NS8, NS3 gene as presented in Supplementary Fig. 11 and the “AA substitutes” sheet of Supplementary Table 1. Then, we demonstrated the richness distribution of different mutation types across the whole genomes, in which mutation rates of C->T, G->T and T->C were dominant in driving the divergence of different lineages of SARS-CoV-2, as shown in Fig. 2a and Supplementary Figs. 12–17. In particular, the mutation rate distributions of C->T are highly enriched in all lineages of SARS-CoV-2, and the mutation rate distributions of G->T are relatively enriched in B.1.1.318, B.1.1.529 (Omicron), B.1.617.1 (Kappa), B.1.617.3, B.1.621 (Mu), B.1.640.1, B.1.640.2, C.1.2, C.37 (Lambda), and P.3 (Theta). Conversely, the patterns of A->T, T->G, G->C are relatively rare, and it was clear that some points with high mutation rates in the A->T distribution derive from B.1.1.7 (Alpha) and B.1.621 (Mu); several points with high mutation rates in the T->G distribution from B.1.526 (Lota), B.1.617.1 (Kappa), B.1.617.2 (Delta), and C.36.3; and some points in the G->C distribution from B.1.525 (Eta), B.1.617.2 (Delta), B.1.617.3, B.1.621 (Mu), B.1.640.1 and B.1.640.2. Therefore, we believe that nucleosomal hereditary material (DNA/RNA) undergoes fewer C->T mutations in SARS-CoV-2, protected by viral doublet histones essential for viral infectivity and viral defences leading to multiple host adaptation/transmission. In contrast, non-nucleosomal deoxyribonucleic acid may play dominant roles in the divergence of various lineages of SARS-CoV-2 in different regions of the world without the protection of nucleosomes.
Furthermore, we present the recent amino acid substitutions among different SARS-CoV-2 lineages, including B.1.617.2 (Delta), B.1.1.529 (Omicron), B.1.1.7 (Alpha), B.1.351 (Beta), P.1 (Gamma), C.37 (Lambda), B.1.621 (Mu), C.1.2, B.1.525 (Eta), B.1.526 (Lota), B.1.617.1 (Kappa), B.1.617.3, P.3 (Theta), B.1.1.318, C.36.3, B.1.640.1, and B.1.640.2, with a focus on NSP2, NSP3, NSP5, NSP12, NSP13, Spike, NS3, NS8, and N proteins in Fig. 2b and Supplementary Table 1, which have strong effects on the divergence and evolutionary history of different lineages. This is especially true for the Spike protein, which contains a receptor-binding domain (RBD), a fusion domain and a transmembrane domain, and the NSP3 protein that is the N-terminus of coronavirus SARS-CoV non-structural protein 3 (Nsp3) and related proteins. Interestingly, compared with the dominant amino acid substitutions, i.e., NSP12:P323L and S:D614G, there seem to be unique and specific amino acid substitutions in one lineage relative to another lineage. Examples include the NSP2:P129L, NSP2:E272G, NSP2:L462F, S:E154Q, S:I210T, and S:D936H substitutions in the B.1.640.1 lineage; NSP13:V371A, S:P129L, S:D1139H, and NS8:C37R substituted in the B.1.640.2 lineage; NSP2:S358L, and NSP3:E378V substitutions in the B.1.1.318 lineage; NSP3:A41V, NSP3:D821Y, NSP13:D105Y, S:S12F, S:G212V, and S:A899S substitutions in the C.36.3 lineage; S:K2Q, S:L280F, S:G313S, S:A368V, S:D736G, S:E1092K, and S:H1101Y substitutions in the P.3 (Theta) lineage; NSP3:A1T, S:Q779K, S:E1072K, NS8:T26I, and N:P67S substitutions in the B.1.617.3 lineage; NSP13:G206C, NSP13:M429I, S:Q1071H, and NS3:L15F in the B.1.617.1 (Kappa) lineage; NSP13:Q88H, S:D253G, NS3:P42L, N:P199L, N:M234I, S:D253G, NS3:P42L, N:P199L, and N:M234I substitutions in the B.1.526 (Lota) lineage; NSP3:T1198I, S:Q52R, S:P323F, S:Q677H, NS3:T89I, NS3:S92L, NS3:G172C, and N:A12G substitutions in the B.1.525 (Eta) lineage; NSP3:P822S, S:P25L, S:C136F, S:A879T, NS3:T223I, and NS3:D238Y substitutions in the C.1.2 lineage; NSP3:T237A, NSP3:A562T, NSP3:T720I, NSP13:P419S, S:Y146S, S:H147T, S:T205I, S:R346K, NS8:P38S, and NS8:S67F substitutions in the B.1.621 (Mu) lineage; S:P13L, S:G75V, S:V76I, and S:T428I substitutions in the C.37 (Lambda) lineage; S:L18F, S:T20N, S:P26S, S:D138Y, S:S247G, S:E341D, S:S371L, S:K977Q, and S:T1027I substitutions in the P.1 (Gamma) lineage; NSP3:K837N, S:D80A, NS3:L52F, and NS3:S171L substitutions in the B.1.351 (Beta) lineage; NSP3:T183I, NSP3:A890D, S:A570D, S:S982A, S:D1118H, NS8:R52I, NS8:K68Stop, NS8:Y73C, and N:S235F substitutions in the B.1.1.7 (Alpha) lineage; NSP3:K38R, NSP3:M84V, NSP3:V1069I, S:G339D, S:S371L, S:S373P, S:S375F, S:N440K, S:G446S, S:S477N, S:Q493R, S:G496S, S:Q498R, S:Y505H, S:T547K, and S:N764K substitutions in the B.1.1.529 (Omicron) lineage; and NSP3:A488S, NSP12:P227S, and S:P77L substitutions in the B.1.617.2 (Delta) lineage.
Provided that the amino acid composition of the proteomes reflects the action of natural selection to enhance metabolic efficiency, synonymous codon usage bias as a measure of translation rates and shows increases in the abundance of less energetically costly amino acids in highly expressed proteins[24]. The compiled codon usage data for different lineages of SARS-CoV-2 are presented in Supplementary Table 1. We summarize the synonymous codon usage of all different lineages of SARS-CoV-2 in Fig. 2c and Supplementary Table 1. In the B.1.640.2 lineage, codon AGU was obviously biased for Ser, codon UUU was stronger for Phe in the B.1.640.1 and P.3 (Theta) lineages, and codon GCU was clearly biased for Ala in the B.1.617.2 (Delta) lineage. Here we summarize the mutation rates across closely related species over short time scales in large effective population. That is, a large selective difference between lineages of SARS-CoV-2 was required for strong codon usage bias.
Clock-like prediction of focal outbreak points worldwide to provide warnings.
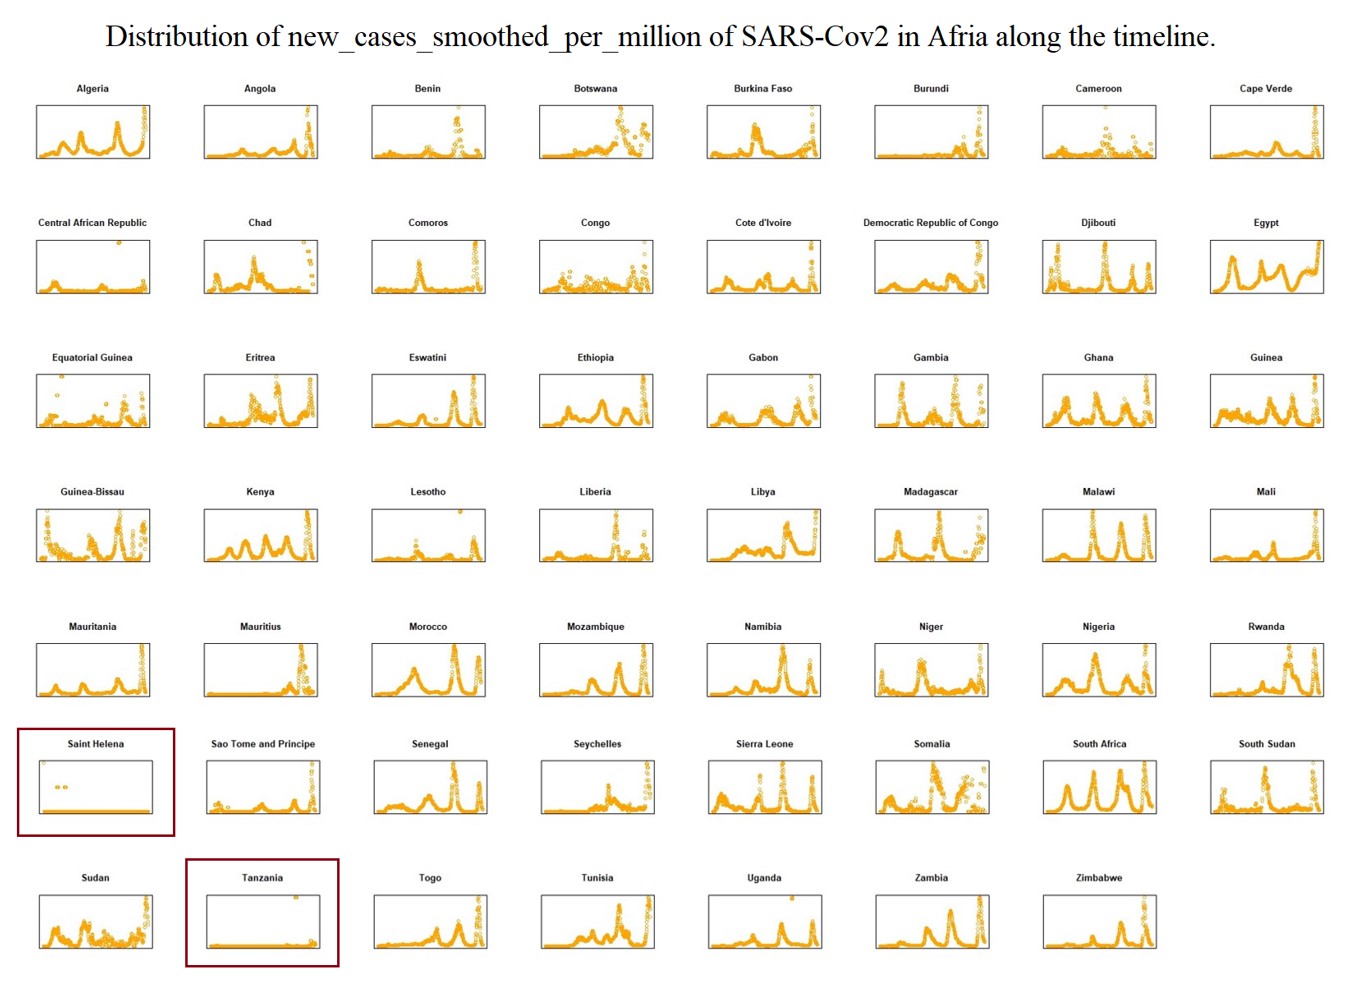
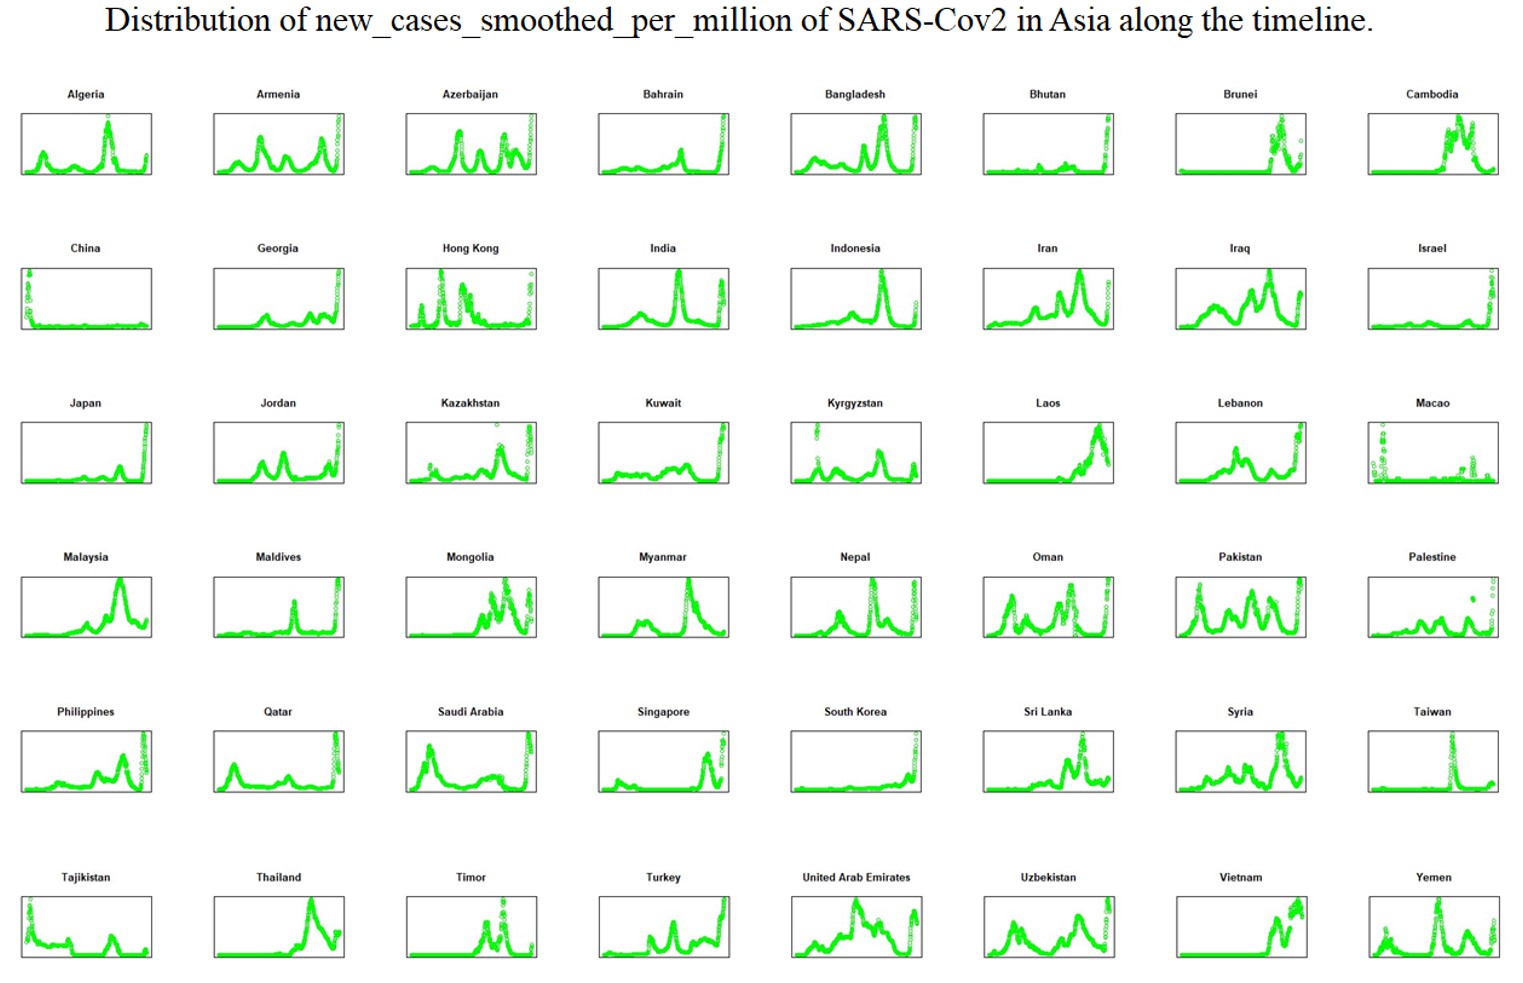
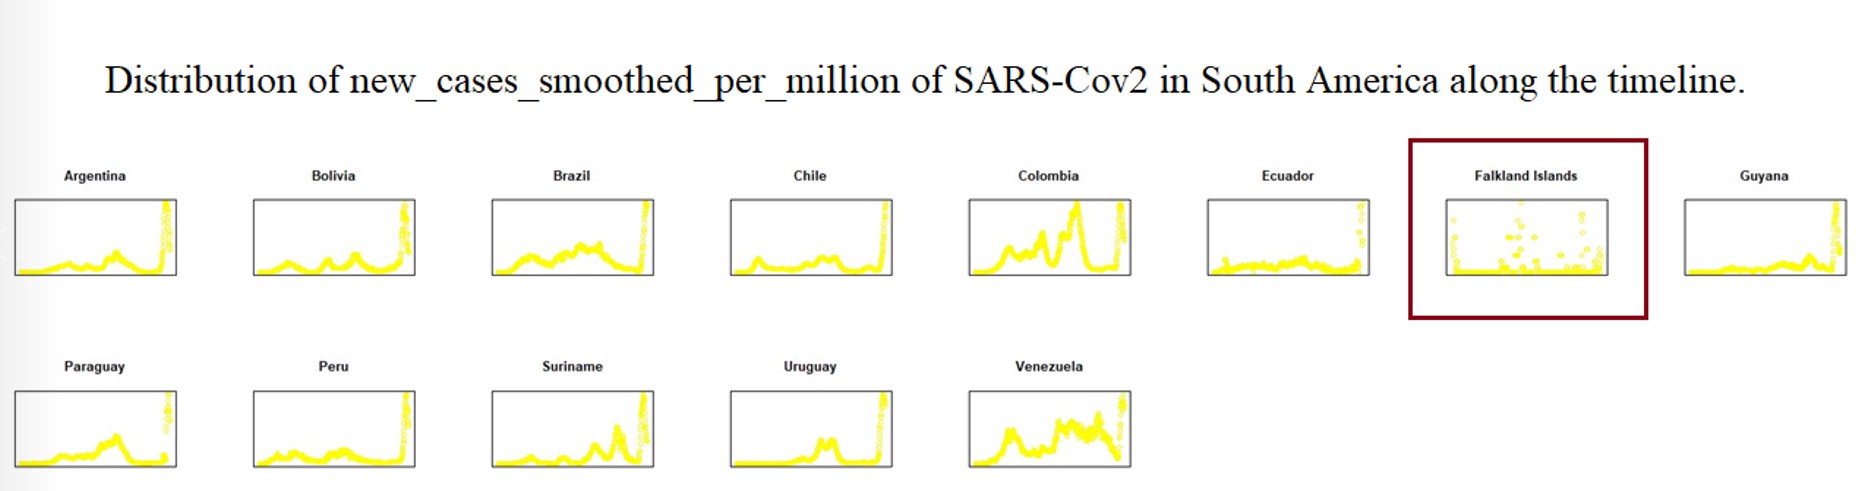
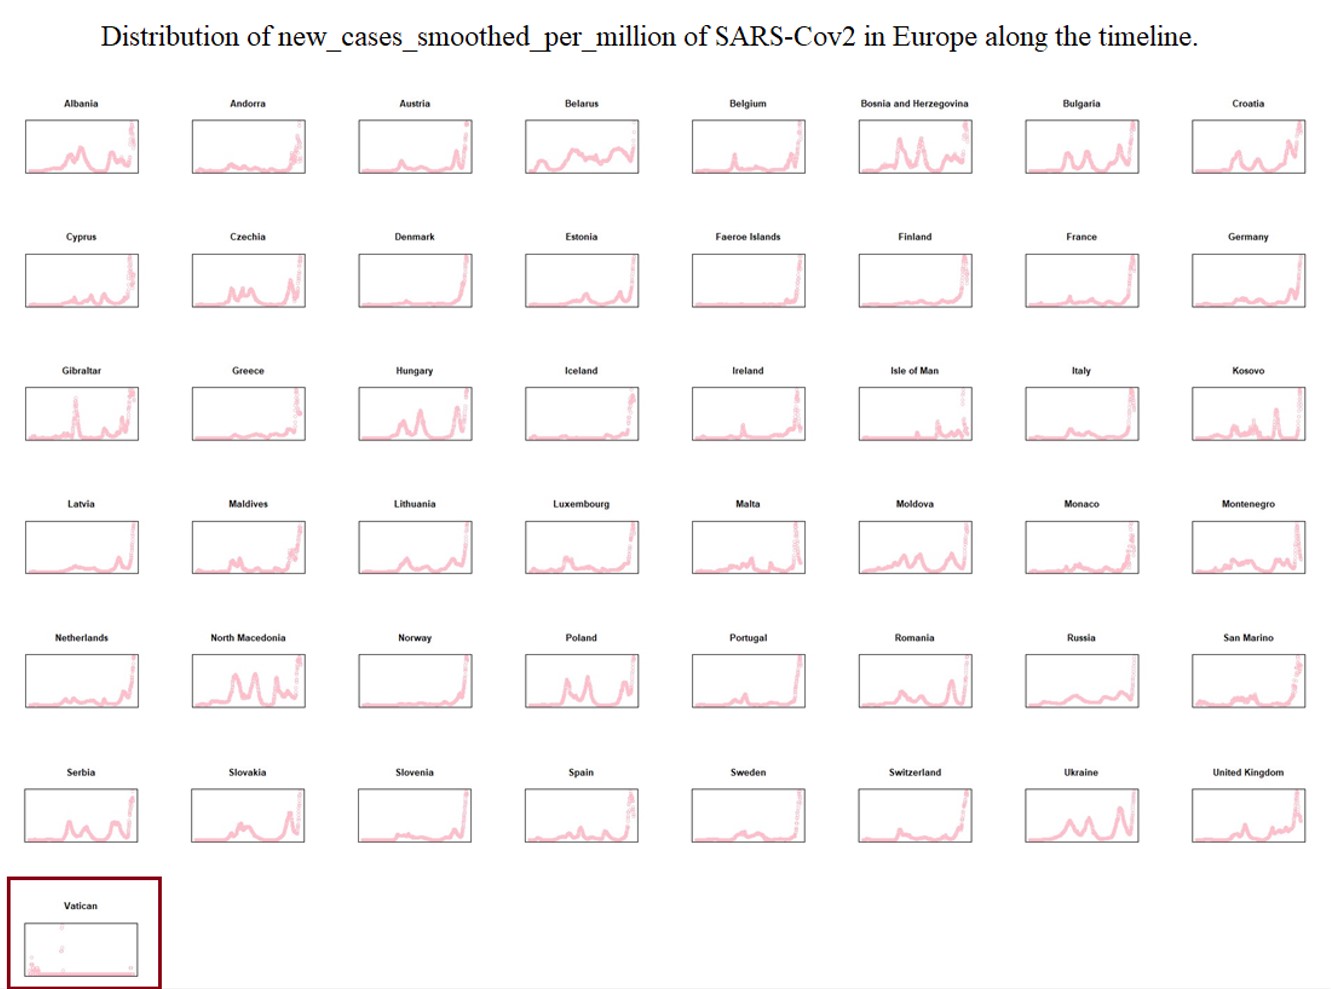
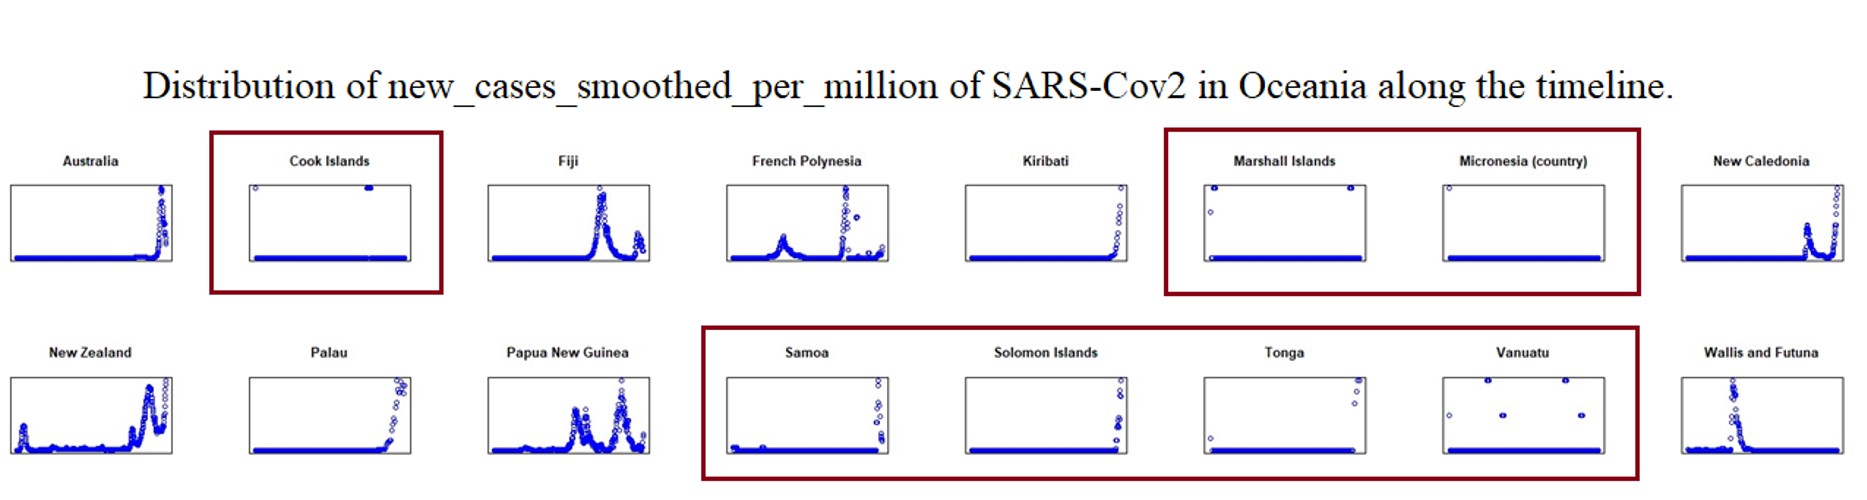
To explain the epidemic outbreak points related to key mutations, we set the Epi-Clock device to predict potential epidemics and assist in the presentation of detailed mutation information for severely affected areas. Therefore, we analysed the whole evolutionary pathway in the timeline of lineages of SARS-CoV-2 presented in Supplementary Table 2; i.e., each lineage shows information for the earliest publicly collected samples in different regions of the world. At the same time, we summarized the smoothed distribution of new cases per million cases of SARS-CoV-2 in different severely affected areas, such as Africa, Asia, Europe, North America, Oceania, and South America, along the timeline from OWID[25] in Supplementary Figs. 18–24. Here we defined the amino acid substitutes according the latest reported data around June 9th 2022. Interestingly, we found the pattern of an increasing number of other types of substitutions (shown with the red asterisk) as the hitchhiking effect progressed, i.e. a few other types increased dominantly especially in the pre-breakout phase, even though some substitutions were replaced by other dominant genotypes (shown with the red box) in Fig. 3a, Fig. 3b, Supplementary Table 2 and Supplementary Figs. 25–32.
We hypothesized that specific amino acid substitutions are triggers for outbreaks. To predict potential epidemic outbreaks, we proposed the ZHU algorithm presented in Fig. 4a and tested it on different true sets of SARS-CoV-2 data before outbreaks to search for real significant mutational accumulation patterns related to the outbreak events. We found 171 statistically significant substitutions (Significance level p < 0.05) as potential epi-factors within 55 different countries and regions. We proposed the ZHU prediction which was similar with the “China's abacus”, to perform the cycling of N generations of training by GLM and reordering according to AIC (The Akaike Information Criterion). Finally, we performed the ZHU prediction based on the weighted intercept estimates provided by the supporting information of true sets, and accessed by 42 validation sets with positive precision, sensitivity, and accuracy, as follows.
However, our prediction of outbreak was only based on significant amino acids substitutes excluded other epi-factors. Very interestingly, it was obvious that amino acid substitution type X13.NSP3_T183I.I was a potential epi-factor in Iran, the Netherlands and Norway. X74.S_S371L.L was significantly correlated with numbers of new cases in Finland, Canada and Brazil, as shown in Fig. 4b. Across N generations of training by GLM and reordering, we found 171 significant substitutions as potential epi-factors within 55 different countries and regions, as demonstrated in Supplementary Table 3. Finally, we successfully presented the performance of the ZHU algorithm on 42 validation sets in Fig. 4c. From most validations, we could accurately predict the potential pre-phase of the outbreak by ZHU prediction. By counting the number of true instances, we summarized the positive precision, sensitivity, and accuracy of Epi-Clock with the true validation sets as presented in Fig. 4d and Supplementary Table 3, where the median interval before outbreaks was 5 days.