A sequence of large earthquakes struck the city of Kumamoto and its surroundings, the central part of Kyushu, in April 2016, which claimed more than 200 fatalities including disaster-related deaths. This earthquake sequence includes Mw7.0 (USGS, 2020) event and several events of Mw6.0 or larger. These earthquakes occurred on and around the Futagawa and Hinagu faults, which are right lateral strike-slip faults with a slightly different strike and meet between Kumamoto City and the Aso caldera (Fig. 1) [e.g. Asano and Iwata, 2016]. The Futagawa fault runs eastward with a strike of N60°E and through the Aso caldera. On the other hand, the Hinagu fault trends in the N30 ~ 40°E direction and extends further south of the Yatsushiro city [Geological Survey of Japan, AIST, 2016]. The first shock of Mw6.5 is considered to have occurred on the part of the Hinagu fault [Shirahama et al., 2016]. Aftershocks are distributed along these faults, but there is difference in pattern of aftershock distribution in western and eastern parts. In eastern part from the epicenter of April 16 shock, aftershocks are aligned tightly along the Futagawa fault, while they are distributed in the fan-shaped area in its west. It is remarkable that there are few aftershocks south of the Futagawa and Hinagu faults. It is also emphasized that northeastern edge of aftershock distribution exceeds the northeastern rim of the Aso caldera.
There are also many reports of surface ruptures off these coseismic faults in the city of Kumamoto and on the western frank of Aso caldera [Goto et al., 2017; Fujiwara et al., 2016; Fujiwara et al., 2017, Toda et al., 2016]. Most of them are considered to be non-tectonic origin. Tsuji et al.(2017) and Fujiwara et al.(2017) reported that surface ruptures in the northern part of Aso caldera were generated by horizontal sliding of blocks or lateral spreading due to strong shaking. Goto et al. (2017) showed detailed distribution of surface ruptures in the Kumamoto Plain. One is the westward extension of the Futagawa fault, which they named the Akitsugawa flexure zone, and other is NW trending multiple traces of surface rupture, Suizenji fault zone, in Kumamoto City. They discussed relationship of them to topography and distribution of pyroclastic deposits of Aso volcano. Deformation due to these surface ruptures were also detected with InSAR measurements [Fujiwara et al., 2016; Fujiwara et al, 2017] and it is important to examine their temporal evolution following the earthquake sequence.
Kumamoto City is famous for its abundant groundwater. A lake, which is located close to the western extension of the Futagawa fault, sudden dried up, which may be associated with movement of Suizenji fault zone that appeared during the Kumamoto earthquake [e.g. Hosono et al., 2018]. Hosono and Masaki (2020) reported hydrochemical changes of groundwater during the postseismic period. Groundwater flow may affect movement on the surface. Therefore, observation of surface movement contributes to the understanding of evolution of groundwater flow system in this area.
The Geospatial Information Authority (hereafter GSI) has been monitoring crustal movements with a continuous GNSS network in Japan, called GSI’s Earth Observation Network (hereafter GEONET), while the Japan Exploration Agency (hereafater JAXA) has been operating a satellite (the Advanced Land Observing Satellite 2, hereafter ALOS-2) equipped with L-band radar (Phased Array L-band SAR 2, hereafter PALSAR-2). The European Space Agency also operates C-band SAR satellites called Sentinel-1. These sensors detected remarkable coseismic deformation of this earthquake sequence. Many authors processed the data provided by these sensors and presented coseismic fault models. According to these studies, the first shock was a right lateral strike slip event on the Hinagu fault [Fukahata and Hashimoto, 2016; Ozawa et al., 2016; Himematsu et al., 2016; Kobayashi et al., 2016]. On the other hand, both Futagawa and Hinagu faults slipped during the Mw7.0 event, but moment release on the Futagawa fault was dominant.
Postseismic deformation usually follows large earthquakes. There are several studies of postseismic deformation following inland earthquakes in Japan mainly using continuous and campaign GNSS data and their origins [e.g. Nakano and Hirahara, 1997; Sagiya et al., 2005; Hashimoto et al., 2007; Ohzono et al., 2012; Meneses-Gutierrez et al., 2019]. These preceding studies speculated afterslip, viscoelatic relaxation and poroelastic rebound for possible mechanism of postseismic deformation, but they did not incorporate complicated geometry of faults or heterogeneous structure of crust due to the limited spatial resolution. In order to discuss generation mechanism of postseismic deformation, especially in relation to crustal heterogeneities, spatial resolution is important, but the density of GNSS stations are not high enough to detect detailed spatial distribution of postseismic deformation. Therefore, we must exploit synthetic aperture radar (hereafter SAR) images. Peltzer et al. (1998) discussed postseismic deformation following the 1992 Landers, Calfornia, earthquake using ERS interferograms and clarified relationship between complicated geometry of coseismic faults and poroelastic response. Geology affects groundwater distribution and flow direction. We wonder if there is correlation between the distribution of pyroclastic deposit and postseismic deformation. Moore et al. (2017) already studied postseismic deformation following the Kumamoto earthquake based on GNSS and InSAR data till the end of 2016. They mainly discussed large scale deformation with reference to the viscoelastic structure beneath Kyushu. In this paper, we discuss finer scale deformation that appeared in the vicinity of coseismic surface ruptures, which may convey invaluable information of property of shallow crust and active faults.
Tectonic Setting
Central Kyushu is unique in Japan, because there is a large graben structure across the island. Aso and Unzen volcanoes sit right in its middle (Fig. 1). Century long geodetic surveys revealed N-S extension which is considered to tear the island. This idea seemed partly consistent with the existence of E-W trending normal faults [Tada, 1984]. Recent continuous GNSS observation, however, does not confirm the dominance of N-S extension [e.g. Nishimura and Hashimoto, 2006]. Now dextral motion is considered to be appropriate across the Futagawa and Hinagu fault system.
Aso volcano is one of the most active volcanoes in Japan and repeated large eruptions many times including at least 4 caldera forming eruptions. The last caldera forming eruption was the largest so far, whose pyroclastic deposit, ASO-4 (~ 90 ka BP) covers northern and central Kyushu [Ono and Watanabe, 1985]. There are thick pyroclastic deposits of Pleistocene to Holocene in the surrounding area of the source faults of the 2016 Kumamoto earthquake sequence. On the other hand, sedimentary rocks of Holocene are found in the Kumamoto Plain. Goto et al.(2017) pointed out that the Suizenji fault zone that appeared during the 2016 earthquake sequence in Kumamoto City is located near the foot of terrace deposit of early – middle-late Late Pleistocence.
SAR Images and Their Processing
We utilized ALOS-2/PALSAR-2 images acquired after the largest earthquake on April 16 in the Kumamoto sequence. JAXA made observations with PALSAR-2 for several different directions and modes, but there are not so many images that were acquired from the same orbits and with high frequencies. Among them, we collected strip-map mode images of high spatial resolution of path 23 (P23) of descending orbit and 130 (P130) and 131 (P131) of ascending orbits. Table 1 lists information of observed images with their parameters of observations. Figures 1 and 2 illustrates footprints of images used in this study and temporal changes in perpendicular baselines, respectively. P23 covers the surrounding area of the Futagawa and Hinagu faults and Aso caldera and are frequently observed. It is because this path covers active volcanoes such as Aso, Kirishima, Sakurajima and Kuchinoerabujima. On the other hand, P131 and P130 covers the Kumamoto plain and Aso caldera, respectively, and there is no overlap between P130 and P131. There are 28, 13 and 7 images for P23, P131 and P130, respectively, during the period from April 18, 2016 to December 10, 2018. Perpendicular baselines are shorter than 400 m, which is good enough for interferometry. We did not use ScanSAR images because of their less frequent observations and lower spatial resolution. We did not use other SAR images acquired by Sentinel-1 or others, because their shorter wavelength of microwave causes decorrelation in vegetated and mountainous areas and with long temporal separations.
We performed 2-pass interferometry for pairs of collected SAR images with Gamma® software [Wegmüller and Werner, 1997]. For descending images (P23), the boundary between northern and southern images runs across the seismogenic zone of the Kumamoto earthquakes. We concatenated them in order to retain continuity of phase according to the procedure by Gamma®. ASTER-GDEM ver.2 is used for the correction of topographic phase and geocoding [Tachikawa et al., 2011]. We fixed the first images acquired after the April 16 earthquake as the master and made interferograms for the pair of this master and following images. Owing to L-band, coherence is high enough even for the pair with two-year long separation. L-band SAR used to suffer from ionospheric disturbances and so does the present case. We exploited the technique developed by Gomba et al. (2016), Furuya et al.(2017), Wegmüller et al. (2018) to reduce ionospheric disturbances. We found ionospheric disturbances both in ascending and descending interferograms and sometimes large ramp in corrected interferograms. Therefore, we flattened ionospheric-corrected interferograms and then filtered them before unwrapping. We used the branch-cut technique for unwrapping of filtered interferograms. We stacked unwrapped interferograms for both ascending and descending orbits and converted them to E-W and U-D components.
Table 1
List of parameters of images used in this study. All images are acquired in strip-map mode with right-looking. Asc. and Desc. are ascending and descending orbits, respectively. Elevation and azimuth toward the satellite are measured from the zenith and clockwise from the north, respectively.
| Path/ Frame | Orbit | First obs. | Last obs. | number of acquisition | Elevation | Azimuth |
| P131 F640 | Asc. | 26/04/2016 | 28/08/2018 | 13 | 47.1° | 260.3° |
| P130 f650 | Asc. | 16/06/2016 | 22/03/2018 | 7 | 53.8° | 259.7° |
| P23 F2950-2960 | Desc. | 18/04/2016 | 10/12/2018 | 28 | 53.8° | 100.3° |
Correction of Ionospheric Disturbances
Before discussing the detected surface deformation, it is worth mentioning the correction of ionospheric disturbances. Ionospheric disturbances that appear in interferograms of L-band SAR are considered to be related to medium-scale travelling ionospheric disturbances (MSTID) [e.g. Saito et al., 1998]. There may be seasonality of MSTID and dependence on local time [Chen et al., 2019]. Observation from ascending and descending orbits are made around mid-night and noon, respectively. Empirically, disturbances appear in ascending interferograms in summer, while those in descending interferograms are recognizable in winter.
Figure 3 shows an example of correction of ascending interferograms of April 26 and June 13, 2016. We observed a large disturbance in the middle of the original interferogram (Fig. 3a). Similar disturbances appear in interferograms of higher and lower frequencies, but there is slight difference between them (Fig. 3b and c). Double differenced interferogram shows spatial variation (Fig. 3d), which leads to an estimate of effect of ionosphere (Fig. 3e). Taking difference between original and ionospheric component, we finally obtained ionosphere-corrected interferogram (Fig. 3f). However, we still recognized significant trend in the azimuth direction. Therefore, we detrended it by fitting polynomial function in two dimensions and filtered it (Fig. 3g). We geocoded filtered ionosphere-corrected interferogram to detect surface deformation (Fig. 3h). In Fig. 3h, there is still a large disturbance that may be attributed to tropospheric disturbance in image of June 21, 2016, because we did not find similar signal in other ionosphere-corrected interferograms (Fig. 5).
An example of descending interferogram is shown in Fig. 4. Empirically, ionospheric disturbances are considered to be not so serious as those in ascending interferograms. However, it is not always right. In original, higher- and lower-frequency interferograms, we recognized more than three cycles of fringes. Double differenced interferogram is almost flat, but we have ionospheric disturbance with fairly long wavelength. Furthermore, ionosphere-corrected interferogram still has large trend of three cycles in the azimuth direction, to which we must apply flattening and filtering techniques.
Observed Line-of-Sight Displacements
Owing to repeated acquisitions of ALOS-2/PALSAR-2, we obtained spatio-temporal variation in LOS displacements after the occurrence of the Kumamoto earthquake sequence. In this chapter, we discuss characteristics of observed LOS displacements from three different viewpoints; i.e. a) spatial distribution of averaged LOS displacements (Figs. 5–9), b) profiles of displacements along selected sections (Fig. 10), and c) time series of LOS displacement at selected points (Fig. 11).
a) Spatial Distribution of Average LOS Change
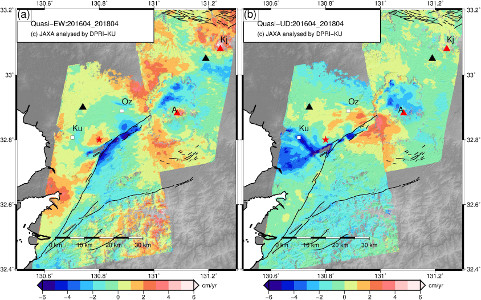
Supplementary Figures S1 – S3 show all flattened filtered non-dispersive components of interferograms for P131-F640, P130-F650, and P23-F2950-2960, respectively. Close-ups of unwrapped interferograms around the source region and Aso caldera are shown in Figs. 5–7, and averaged LOS changes are in Fig. 8. Figure 9 shows quasi-EW and vertical components of average velocity during the period from the first acquisitions to April 2018. Triangles in Fig. 9 are the reference points for the conversion of LOS change rates.
We recognize several spots of significant LOS changes. The most prominent one is LOS change along the Futagawa fault and its western extension. The maximum LOS decrease in both ascending and descending interferograms exceeds 10 cm during 2.5 years near the junction of the Futagawa and Hinagu faults (Figs. 3 and 5). In descending interferograms another spot of large LOS increase is found between the junction and Aso caldera, but not in ascending ones. There is a surface rupture along another fault, Idenokuchi fault [Toda et al., 2016]. It is noteworthy that the area of LOS increase is bounded by the Futagawa and Idenokuchi faults.
On the south side of the Idenokuchi fault, LOS decrease was found in both ascending and descending interferograms. LOS decrease is also recognized on the north side of the Futagawa fault in ascending interferograms. The extent of these LOS decrease is about 10 km in the N-S direction.
We also found significant deformation off Futagawa and Hinagu faults. The most remarkable one is a NW-SE trending zone of LOS increase in descending interferograms in the city of Kumamoto. Large LOS increase was also detected in coseismic interferograms [e.g. Fujiwara et al., 2016]. The zone of this LOS change coincides with the Suizenji fault zone found by Goto et al.(2017). The present results suggest that postseismic deformation also occurred around subsidiary fault that may have not emitted seismic wave. In the westernmost region near the coast of the Ariake sea, we found LOS increase in both ascending and descending interferograms. Therefore, we can expect subsidence there.
Several spots of large LOS increase can be observed in Aso caldera, as well. In the northernmost part of this caldera, coseismic surface ruptures were found [Tsuji et al., 2017; Fujiwara et al., 2017]. We detected significant subsidence along these surface ruptures during the postseismic period, implying persistent slip of these ruptures. Another remarkable motion was found on the northern frank of central cone of the Aso volcano, especially in descending interferograms. Because there are no large LOS changes in ascending interferograms, westward shift is dominant in this motion on the northern frank of the central cone.
We also found another small spot of LOS increase north of Ozu Town, about 10 km north of the Futagawa fault. This zone trends in the WNW-ESE direction, which corresponds to local trend of valley where Pleistocene sedimentary rocks are sandwiched by igneous rocks. We did not see any sign of such deformation in preseismic interferogram (Figure S4). Therefore, this deformation was also caused by strong shaking due to the Kumamoto earthquake sequence.
Quasi-EW and vertical components of postseismic velocities are shown in Fig. 9. Westward shift is remarkable on the south side of Hinagu faults, reaching 6 cm/yr. We see eastward motion of < 2 cm/yr around the epicenter. Interestingly, we found westward motion on the both sides of the Futagawa fault around 130.9°N, which is inconsistent with coseismic right-lateral slip. This zone of westward shift is limited by the Idenokuchi fault on the south. This zone also subsided during two years, but its western part subsided much fastser (~ 4 cm/yr) than eastern part (< 2 cm/yr). The boundaries of these zone of deformation are very sharp, which implies slip near the surface.A belt of subsidence of ~ 5 cm/yr is remarkable in Kumamoto City, which corresponds to Suizenji fault zone of Goto et al.(2017). Further west, we observed subsidence in a fan-shaped zone near the coast. It is interesting that its southern boundary roughly coincides with the western extension of the Futagawa fault. There are a couple of uplift zones; western frank of the Aso caldera and north of the Futagawa fault to the epicenter. Their maximum exceeds 2 cm/yr. In the Aso caldera, there are two notable features. The one is the subsidence of up to 4 cm/yr around the coseismic surface rupture near the northern rim. The other is westward motion with subsidence on the northern frank of the central cones. Its northern boundary seems to be aligned along a line trending NE-SW, which suggests afterslip on unknown buried fault.
b) LOS Displacement Profiles along Selected Sections
It is important to examine temporal variation in LOS changes for the discussion of mechanism of postseismic deformation. For this purpose, we prepared two different views of time series of observed deformation. One is the temporal changes along selected profiles. We sampled LOS change from the area within 0.005°on the both sides of the profile and plotted them shifting according to the time of acquisitions of slave images.We chose 7 profiles which run through interesting spots of deformation discussed in the previous section, in which we can also grasp the characteristics of spatial distribution of deformation, especially discontinuities in deformation. 5 sections are along meridians, while 2 sections are in the E-W direction. We emphasize that correlation between LOS displacement and topography are not recognized though some sections runs in the areas of rough topography.
The Sect. 1 is the westernmost profile of LOS change, which runs off the main strand of Futagawa and Hinagu faults but crosses the area of local LOS increase around the Suizenji fault zone in Kumamoto City. We can see local LOS increase around 32.8°N in both interferograms and another local deformation a little bit north of 32.7°N in descending interferogram. The former corresponds to local subsidence in Kumamoto City, while the latter is signal on the western extension of the Futagawa fault, i.e. the Akitsugawa flexure zone of Goto et al.(2017). These observations suggest that postseismic deformation occurred not only in the vicinity of coseismic faults but off the source. We notice two steps looking closely at the LOS change around 32.8°N in descending interferogram, implying two possible faults there.
The Sect. 2 runs just west of the junction of the Futagawa and Hinagu faults. The LOS increase exceeds 30 cm in descending interferogram, the largest in the entire region under study. We observe sharp changes at the northern boundary of this zone of LOS increase which correspond to the Akitsugawa flexture zone. This pattern of deformation suggests shallow afterslip on a fault. Southern half of the LOS increase zone have gradual change in both interferograms, which implies buried slip of fault. We should recognize that there is discrete shift between far field displacement on the both sides. There may be a large-scale deformation due to deeper source.
The Sect. 3 is a profile running across a smaller local LOS deformation between the Futagawa and Idenokuchi faults. There is spike-like pattern of spatial distribution of LOS changes around 32.8°N. Its width is much narrower than that found in the Sect. 2 and 4. There is also a shift in the far-field displacement, which is evident in descending interferogram.
The Sect. 4 shows temporal evolution of LOS changes along the meridian passing the spot of large LOS change between the Futagawa and Idenokuchi faults. We recognize sharp changes across these two fault and large LOS increase between them. This LOS exceeded 10 cm about 1 year after. It is worth noting that the changes across the Idenokuchi fault is larger and sharper than that across the Futagawa fault, which implies afterslip on the Idenokuchi fault is more active than on the Futagawa fault. We also noted that there is another small step north of the Futagawa fault, suggesting a minor buried slip. There is another discontinuous change around 32.9°N, corresponding to the LOS change north of Ozu Town in Fig. 8(b). We should note convex pattern of the LOS change in ascending interferograms, while LOS change along the profile is almost flat in descending ones. This convex pattern of LOS change becomes noticeable about 200 days after.
The Sect. 5 runs across the Aso caldera. A sharp discontinuity is obvious around 33.0°N, just south of the northern caldera rim. This point corresponds to the surface rupture that was formed during the April 16 shock of Mw7.0 [Fujiwara et al., 2016; Fujiwara et al., 2017; Tsuji et al., 2017]. We can notice the differential motion evolved according to elapsed time. There were several step-like pattern of deformation during the first 100 days, but most of them died out and the largest one continued for 2 years. LOS changes with relatively short wavelength of ~ 2 km can be seen in ascending interferogram in caldera floor and central cones, while long wavelength deformation is detected with local LOS increase centered around 32.9°N in descending interferogram.
The Sect. 6 and 7 are LOS displacement profiles along two parallels. The Sect. 6 runs north of the Futagawa fault and northern part of Aso caldera. A spike-like change of LOS just east of the caldera rim is related to coseismic surface rupture, the same signal in Sect. 5. Another notable deformation is rapid LOS increase around 131.2°E in the vicinity of central cone, which is as large as 10 cm. This change obviously does not correlate with topography. We also recognize difference in level of LOS change between both sides of this zone in both ascending and descending interferograms, implying afterslip on a possible buried fault.
The Sect. 7 crosses local LOS increase in Kumamoto City, junction of the Futagawa and Hinagu faults, and western frank of the Aso caldera. We see a remarkable deformation on the western frank of the caldera in ascending interferogram. This deformation may have been accelerated after the summer of 2016.
c) Time Series of LOS Displacement at Selected Points
The other is the time series of LOS changes at selected points, which is easier to understand the decaying history of deformation. We chose 5 points shown in Fig. 7. Because acquisitions were made frequently from descending orbit (P23) and was less from ascending orbits, we examine only time series of descending interferograms. We sampled LOS change rates in an area of 0.0025° x 0.0025° centered at the selected points and took average.
It is important to note that the LOS changes till the end of May 2016 are dominant during two years at most points. Therefore, we consider that there are a couple of different mechanisms for these postseismic movements.
Point A is located in the middle of local LOS increase in Kumamoto City. LOS changes rapidly decayed till the fall of 2016, though there is a fluctuation in 2017–2018 (Fig. 11a). If we fit exponential decaying function, we obtain characteristic time of only 29 days. Total LOS change amounts to ~ 5 cm.
Point B is located south of the junction of the Futagawa and Hinagu faults, where westward horizontal motion is dominant around this point (Fig. 9a). This point also shows rapid decay with time constant of ~ 50 days and may have reached ~ 6 cm till the winter in 2016, though scatter is a little bit large.
On the other hand, points C ~ E have longer time constant than the previous points. Point C, located in the large LOS increase between the Futagawa and Idenokuchi faults, gradually decayed till the beginning of 2017 with time constant of ~ 230 days. In 2017 it is stable at the level of 8 cm increase of LOS, and fluctuated in 2018. Point D is in the middle of LOS decrease area on the western frank of the Aso caldera. Among 5 points, only this point shows decrease which is considered to be uplift. During the first two weeks, this point moved rapidly, but suddenly was decelerated. Then it continues to move in the same direction with slow decay rate of characteristic time of ~ 610 days.
Point E shows a similar pattern of temporal change to Point C. Characteristic time is almost the same (~ 210 days). Because these two points are located ~ 20 km away from each other, it may be hard to expect the possible mechanical link but it is just a coincidence.
We add daily precipitation at the JMA Kumamoto station in Fig. 11(g). Kumamoto area suffered from heavy rain mainly in summer during these 3 years, but the correlation with temporal change in LOS change is not clear at all points.
Trial of Afterslip Model
There are wide varieties of spatial and temporal characteristics in observed postseismic deformation and it may be difficult to explain them with one mechanism. Because we detected several sharp changes across some coseismic surface ruptures, it is important to examine first to what extent afterslip model can explain observed LOS change rates. For this purpose, we constructed a fault model with 21 segments that is distributed along the Futagawa, Hinagu and Idenokuchi faults to observed LOS change rate with afterslip model as the first trial. On the basis of spatial distribution of observed LOS changes, we added westward extension of the Futagawa fault (Akitsugawa flexure zone), NW trending segments in Kumamoto City (Suizenji fault zone) and NE trending segments in the Aso caldera. We basically assumed vertical faults except Idenokuchi and Suizenji faults. For Idenokuchi fault, 60° is assumed for dip referring to Toda et al. (2016). We slightly change strike of Idenokuchi fault from 235° to 239° in order to fit surface trace. For Suizenji fault zone, we chose N145°E and 65° for strike and dip, respectively, based on the discussion by Goto et al. (2017). Parameters are listed in Table 2. We fixed length and width of each segment 5 km and 3 km, respectively, and assumed all segments reach the surface. Using dislocation model by Okada (1985), we estimated both strike and dip slip components on these segments.
Figure 12 shows estimated slip of these 21 segments and synthetic LOS changes for P131-F640 and P23-F2950-2960. Supplementary Figure S4 compares down-sampled LOS change rate used in this modeling (Figure S5(a)) and synthetic one (Figure S5(b)). Residuals are shown in Figure S5(c).
The overall features can be qualitatively explained with this model, but synthetic LOS change rates are smaller than the observed ones. LOS change rates along the Hinagu fault are reproduced well. Right lateral slip of up to 15 cm/yr (Segment #10 ~ 15). On the other hand, slips on Futagawa fault (#1 ~ 7) are not so large as that of Hinagu fault, except the westernmost segment #7. Large slip rate of segment #7 may be attributed to LOS increase on the coast of the Ariake Sea. It is curious that some segments of Futagawa fault have left lateral motion (#5 ~ 6). Idenokuchi fault also has left lateral slip of 4 ~ 6 cm/yr. These results may be required by the observed LOS decrease on both sides of these faults. Area of LOS decrease on both sides of Futagawa fault extends about 20 km south and 10 km north. This wide zone of deformation cannot be explained by fault with a width of ~ 5 km. Much wider fault is required to fit the observed LOS change rate if we assume only afterslip on two fault zones. LOS changes around the Suizenji fault zone in Kumamoto City can be partly explained, though magnitude of synthetic LOS change is a little bit smaller. It is clear that two or more faults is required based on profiles along Sect. 1 and 7 (Fig. 10(b) and (n)).
LOS changes in Aso caldera can be explained by assumed faults, though the amount of synthetic LOS change rate is a little bit smaller again. Considering the extent of observed LOS change, slip may be penetrating much deeper.
Total geodetic moment of 21 segments model is 1.02 × 10¹⁷Nm, which corresponds to Mw5.3.
Table 2
Parameters of model faults. LAT and LON are latitude and longitude of the left corner of the fault, respectively. L, W and H are length, width and depth of upper margin in km, respectively. In this study, we assume 5 km, 5 km for length and width, respectively, and all fault reach the surface. Strike is measured clockwise from north in degree. Mo is geodetic moment in Nm with rigidity of 30 GPa.
| # | Lat | Lon | Stirke | Dip | UH(cm/yr) | UD(cm/yr) | U(cm/yr) | Rake | Mo(Nm) |
| Futagawa Fault and its western extension | | | | | | | |
| 1 | 32.73 | 130.7 | 60 | 90 | -4.2 ± 2.1 | 2.5 ± 1.2 | 4.9 | 150 | 3.65E + 16 |
| 2 | 32.75247 | 130.7463 | 60 | 90 | -0.4 ± 1.3 | -3.3 ± 0.7 | 3.3 | 263 | 2.47E + 16 |
| 3 | 32.77493 | 130.79263 | 60 | 90 | -1.9 ± 1.1 | -6.0 ± 0.7 | 6.3 | 252 | 4.70E + 16 |
| 4 | 32.79737 | 130.83898 | 60 | 90 | -6.8 ± 1.4 | -2.7 ± 0.8 | 7.2 | 198 | 5.37E + 16 |
| 5 | 32.8198 | 130.88535 | 60 | 90 | 6.2 ± 2.0 | -4.6 ± 1.0 | 7.7 | 323 | 5.81E + 16 |
| 6 | 32.8422 | 130.93175 | 60 | 90 | 0.3 ± 2.3 | 4.6 ± 1.1 | 4.6 | 86 | 3.47E + 16 |
| 7 | 32.73 | 130.7 | 240 | 90 | -10.1 ± 2.7 | -2.6 ± 1.5 | 10.5 | 195 | 7.86E + 16 |
| Idenokuchi fault | | | | | | | |
| 8 | 32.825 | 130.929 | 239 | 60 | 6.0 ± 2.0 | -1.4 ± 1.0 | 6.1 | 346 | 4.60E + 16 |
| 9 | 32.80183 | 130.88314 | 239 | 60 | 4.3 ± 1.1 | -0.9 ± 0.7 | 4.4 | 348 | 3.31E + 16 |
| Hinagu Fault | | | | | | | |
| 10 | 32.797 | 130.838 | 209 | 90 | 2.5 ± 1.2 | -3.1 ± 0.6 | 4.0 | 309 | 2.99E + 16 |
| 11 | 32.75767 | 130.81208 | 209 | 90 | -10.8 ± 1.8 | 0.7 ± 0.7 | 10.8 | 176 | 8.13E + 16 |
| 12 | 32.71833 | 130.78618 | 209 | 90 | -9.7 ± 2.1 | -0.3 ± 1.4 | 9.8 | 182 | 7.31E + 16 |
| 13 | 32.67899 | 130.7603 | 209 | 90 | -14.7 ± 3.1 | 0.1 ± 1.1 | 14.7 | 180 | 1.10E + 17 |
| 14 | 32.63964 | 130.73445 | 209 | 90 | -7.8 ± 2.6 | -1.6 ± 1.2 | 8.0 | 192 | 6.00E + 16 |
| 15 | 32.60029 | 130.70862 | 209 | 90 | -6.1 ± 3.4 | 2.9 ± 1.9 | 6.7 | 155 | 5.04E + 16 |
| Suizenji fault | | | | | | | |
| 16 | 32.8733 | 130.667 | 145 | 65 | 2.2 ± 2.7 | -0.7 ± 1.6 | 2.3 | 343 | 1.69E + 16 |
| 17 | 32.83646 | 130.6977 | 145 | 65 | 0.7 ± 2.6 | -3.4 ± 1.4 | 3.4 | 282 | 2.58E + 16 |
| 18 | 32.79962 | 130.72837 | 145 | 65 | -0.3 ± 2.2 | -1.5 ± 1.2 | 1.5 | 258 | 1.15E + 16 |
| Fault in Aso Caldera | | | | | | | |
| 19 | 32.8647 | 130.978 | 29 | 90 | -7.7 ± 1.9 | -0.9 ± 0.8 | 7.7 | 186 | 5.80E + 16 |
| 20 | 32.90403 | 131.00397 | 29 | 90 | -10.1 ± 1.9 | -2.9 ± 0.8 | 10.6 | 196 | 7.91E + 16 |
| 21 | 32.94335 | 131.02995 | 29 | 90 | 0.1 ± 1.7 | -1.7 ± 0.8 | 1.7 | 274 | 1.28E + 16 |