2.1 Materials
Ruscogenin, 98%, from J&K® (Beijing China).Flux of Evans blue dye-labeled albumin (EB-albumin, Sigma, USA).
2.2 Animals
All animal care and experimental procedures were carried out according to the current European Communities Council‐ECC guidelines for the care of laboratory animals and ethical guidelines for investigations of experimental pain in conscious animals. Animal studies were reported in compliance with the ARRIVE guidelines. Male C57BL/6J mice (20–25 g; 8 weeks; specified pathogen free) were provided by the Model Animal Research Centre of Yangzhou University (Yangzhou, Jiangsu, China) and kept in cages containing standard bedding, with at least five mice per cage. Mice were housed in a specific pathogen‐free facility with 12 h light/dark cycle [07 to 19 h, temperature (22 ± 2°C), humidity (40–70%), controlled ventilation] and with sterile water and irradiated food available ad libitum. Animals were allowed to acclimatize to their housing environment for at least 7 days prior to experimentation and to the experimental room for 1 h before experiments.
2.3 Drug treatments
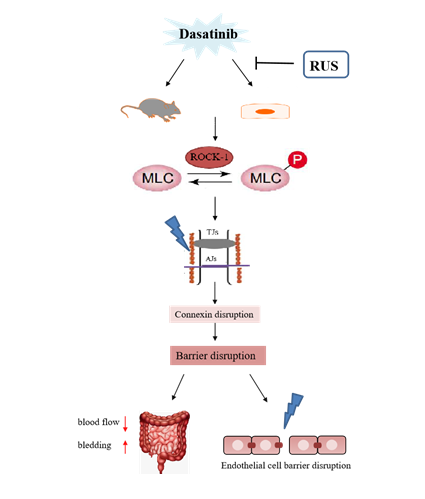
Ruscogenin was weighed and dissolved in absolute ethanol to prepare a mother liquor. When used, the corresponding concentration was adjusted with physiological saline. Dasatinib was dissolved in physiological saline at a concentration of 140 mg/kg and administered intragastrically.30 minutes after the administration of Ruscogenin, Dasatinib was administered by gavage.After 30 minutes, the mice were killed.
2.4 Blood flow monitoring
Before administering Dasatinib, mice were given Ruscogenin in 30 min, and 2 hours later anesthetized by Pelltobarbitalum Natricum. The small intestine was removed and placed on a Doppler flowmeter for scanning to obtain images.
2.5 Western blot analysis
Western blotting analysis was performed as previously described. The cells was lysed and centrifuged. Equal amounts of proteins (40 μg) were examined using 10% SDS-PAGE and subsequently transferred to PVDF membranes (Millipore, USA) using electrophoresis. The membrane was blocked with 5% BSA for 1.5 h and incubated overnight at 4 °C with primary antibodies against ZO-1 (1:200,Abcam,USA ), VE-cadherin(1:1000,Santa,USA) Occludin(1:200,Abcam,USA ), ROCK1 (1:500, Santa, USA), MLC (1:1000, CST, USA), phospho-MLC (1:1000, CST, USA),β-actin (1:10000,Bioworld,USA), followed byincubation with peroxidase-conjugated secondary antibodies (1:8000, Bioworld, Louis Park, USA) and visualization using enhanced chemiluminescence (ECL,Vazyme Biotech, Nanjing, China). The results were quantified using the Image Lab™ software (version 4.1, Bio-Rad, California, USA).
2.6 Histology and immunohistochemistry
The excised vessel was dehydrated with 40% sucrose, embedded in optimal cutting temperature (OCT) and frozen at −80°C. The jejunum was sectioned into slices of 4μm of thickness with a cryotome (Leica, Mannheim, Germany). Specimens were washed in PBS and stained with Haematoxylin and Eosin (H&E). For immunohistochemical staining, slides were incubated with primary antibodies at 4°C overnight. Alexa Fluor 488‐/594‐labelled antibodies were used as secondary antibodies. The nuclei were stained with DAPI(Beyotime Biotechnology, Shanghai, China). Pathological changes in jejunumwere observed under a fluorescence microscope (Leica, Mannheim, Germany).
2.7 Cell culture
HUVECs were purchased from the ZhongQiaoXinZhou Co. Ltd. (Shanghai, China) and cultured in RPMI 1640 (Invitrogen, Carlsbad, CA, USA) supplemented with 10% fetal bovine serum (FBS, Sigma, St. Louis, MO, USA), 100 U/ml penicillin and 100U/ml streptomycin (Ameresco, OH, USA) at 37 °C in a humidified atmosphere of 5% CO2 and 95% air.
2.8 Dasatinib-induced disruption of HUVECs barrier
In the control group, serum-free RPMI-1640 medium was added to the chamber for 2 h. Dasatinib (final concentration 150 nM) was added to the model group for 2 h. The administration group was added with 0.01, 0.1, 1 μM RUS for 1 h, and then 150 nM Dasatinib was added for 2 h.
2.9 Statistical analysis.
All results are expressed as the means±SD. Statistical analysis was performed using Student’s two-tailed t test for comparison between two groups and one-way analysis of variance (ANOVA) followed by Dunnett’s test when the data involved three or more groups. P<0.05 was considered statistically significant. All analyses were performed using GraphPad Prism Version 5.01 (GraphPad Software Inc.USA).