3.1 HDGF expression in pan-cancer samples
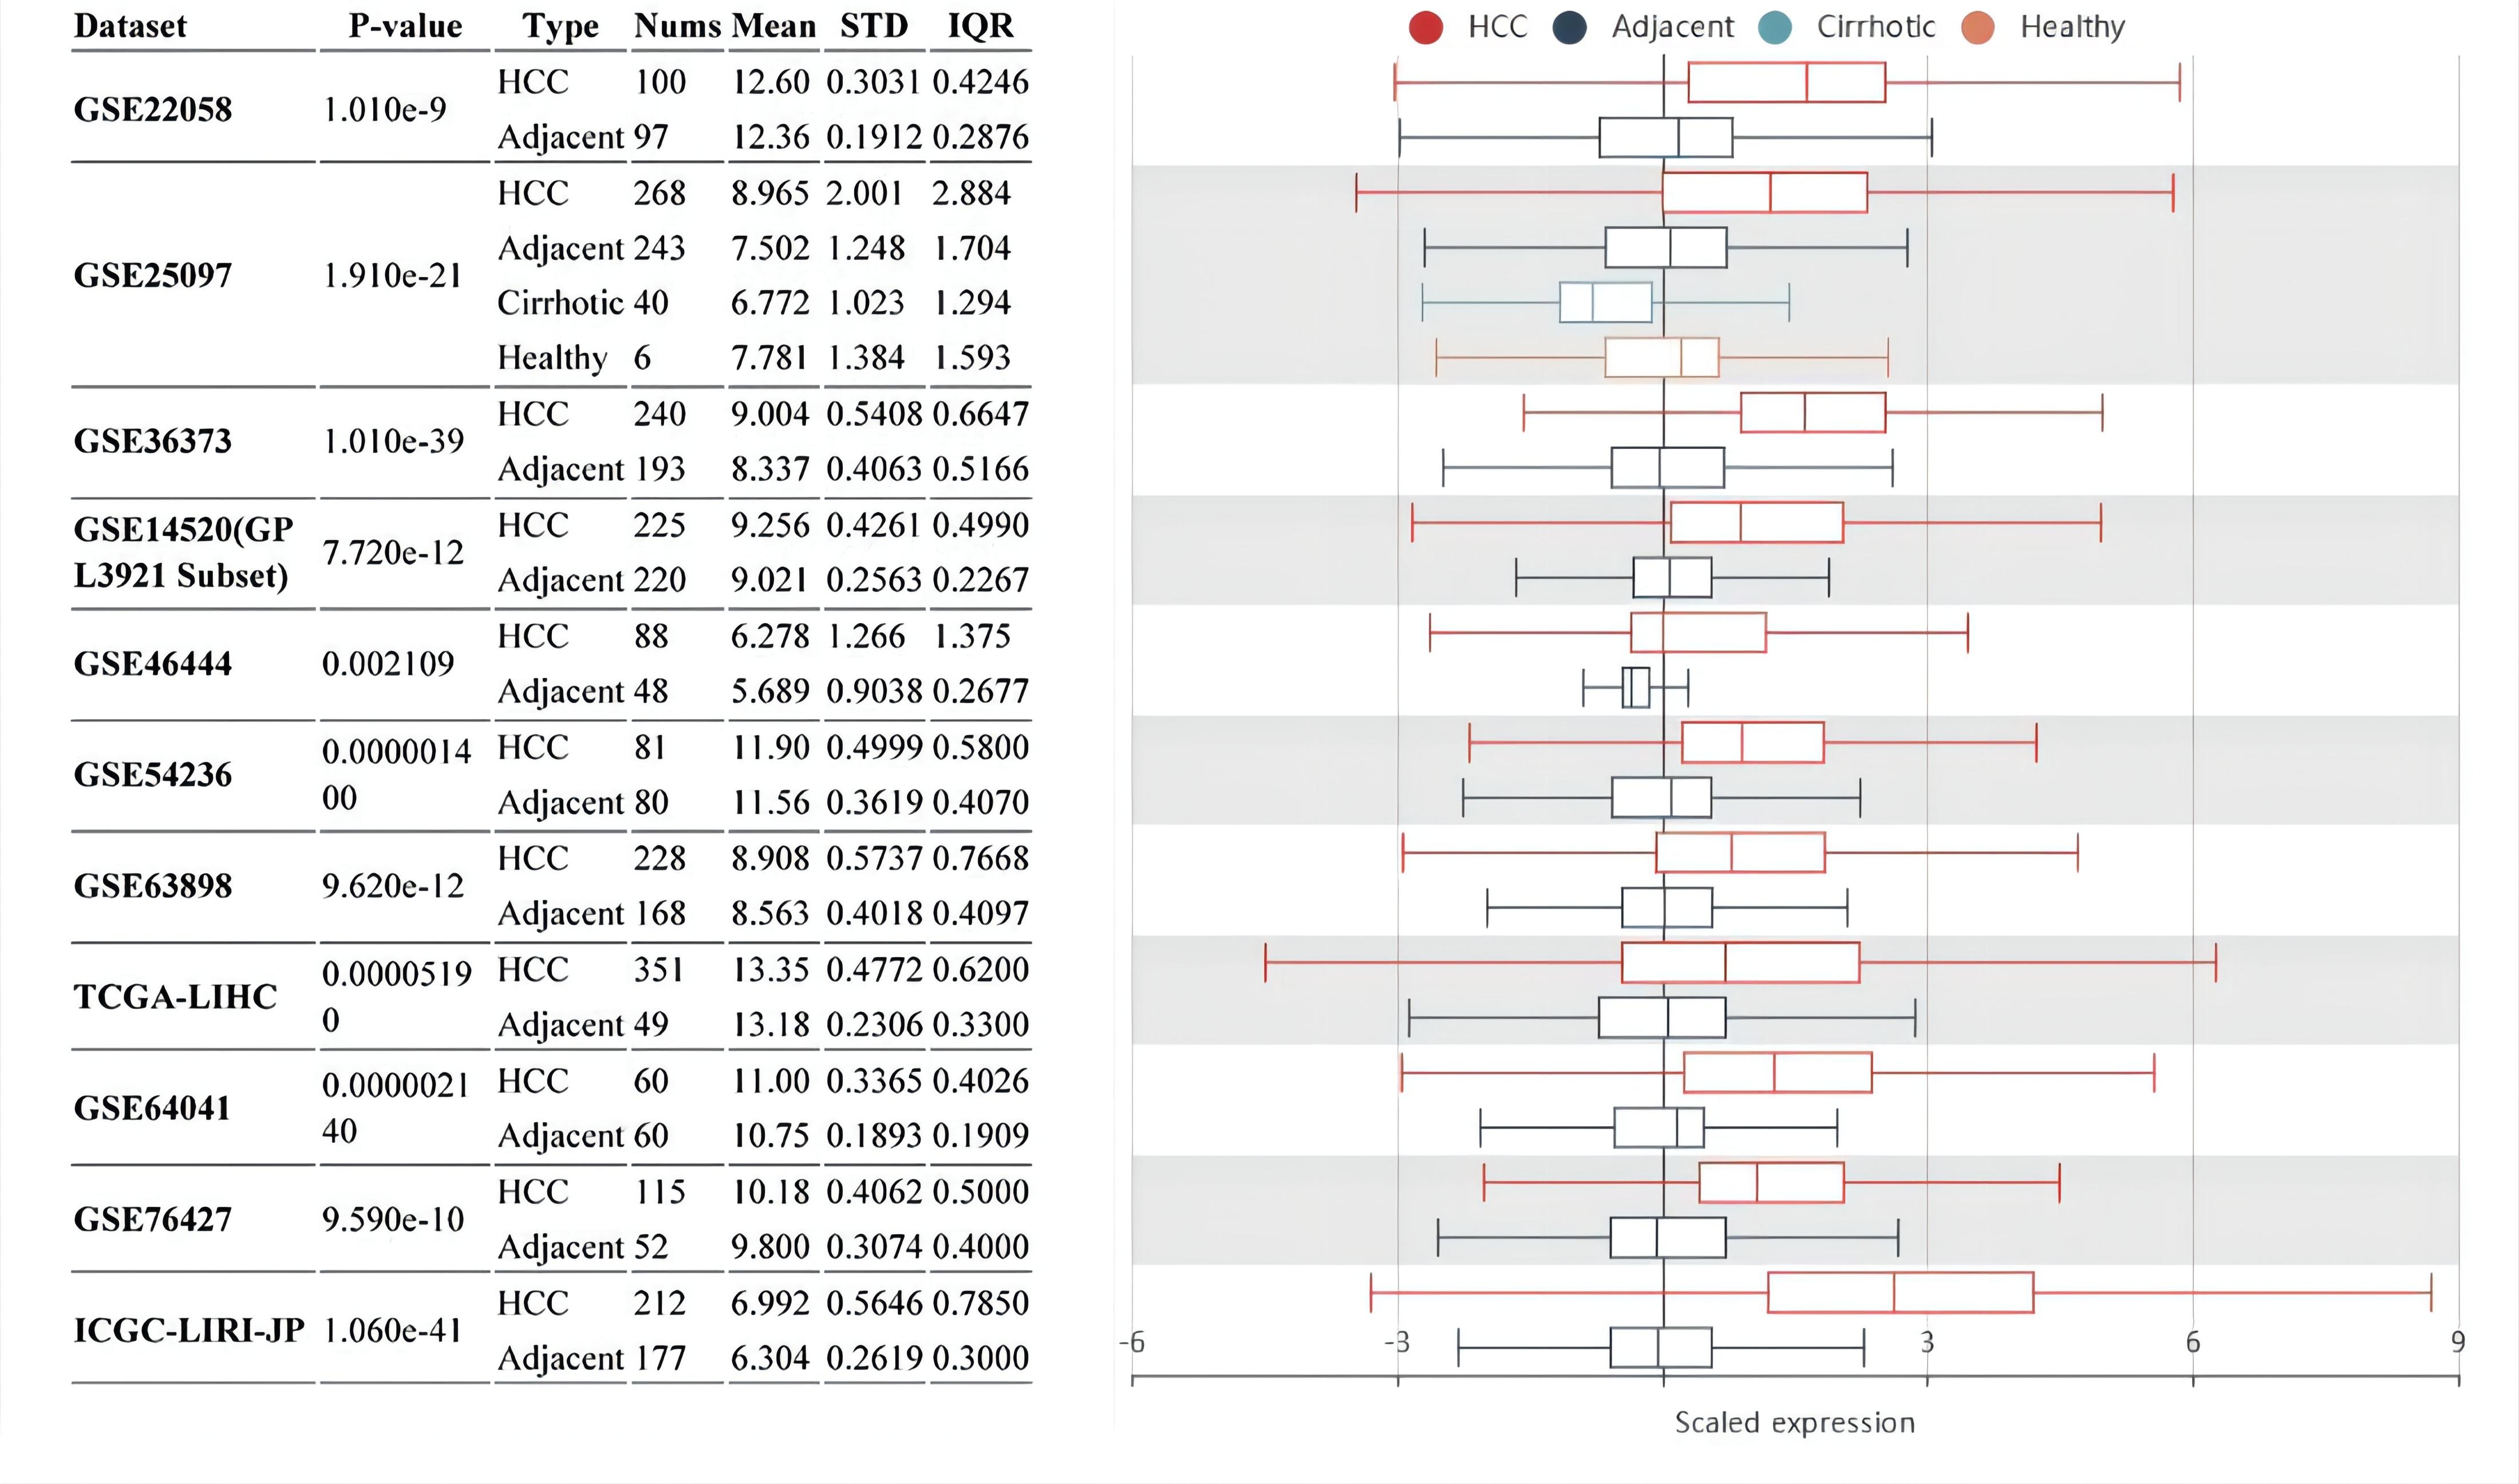
Our evaluations of differential HDGF expression in pan-cancer samples (Fig. 1A and B) revealed that this protein is overexpressed in 31 cancer types when compared to their normal adjacent tissues, and an additional 16 cancer types when evaluated in the absence of paired tissues. These cancers included bladder, ovarian, and colon cancer (p < 0.001). Additionally, Figures 1C and D clearly show that HDGF expression is significantly increased in HCC samples while our ROC curves, produced using the TCGA-GTEx-LIHC data, demonstrate the diagnostic value of HDGF in HCC producing a sensitivity of 81.9% and specificity of 91.92% (Fig. 1E, AUC of 0.914, 95% CI, 0.890–0.939). These observations were then validated using an additional 11 datasets from the HCCDB (Fig. S1).
3.2 Relationship between HDGF expression and clinical presentation in HCC
Given the clear relationship between increased HDGF expression and HCC disease, we then went on to divide our dataset into high and low HDGF expression groups and then evaluated the effects of this expression on the clinical characteristics of these groups (Table S1). Notably, these evaluations revealed that there were significant differences in the T stage, pathological stage, histological grade and AFP status of these two groups.
In addition, we found that HDGF expression (Fig. 2) had no significant impact on T stage, N stage, and M stage classification (Fig. 2A‒C, p > 0.05), but made a significant difference in the histological grade of these samples, with the high expression group including many more samples at the G3 and G4 stages (Fig. 2D, p < 0.001). Evaluations of the fibrosis score revealed that the HDGF expression level in the 3/4 and 5/6 groups was significantly higher than that of the 0 and 1/2 control groups (Fig. 2E, p = 0.018). The differences in AFP level were even more pronounced, with the expression of HDGF in the AFP >400 ng/mL group being significantly increased when compared to the control group (Fig. 2F, p <0.001). Adjacent hepatic tissue inflammation was also shown to have some relationship with HDGF expression as both the mild and severe groups presented with more HDGF expression than the control group (Fig. 2G, p = 0.042). Vascular invasion was similarly linked with HDGF expression in HCC with vascular invasion being more common in high HDGF samples (Fig. 2H, p = 0.046). These observations were also supported by the fact that those patients with HCC with higher HDGF expression levels tended to present with a worse OS when compared to the low expression group (Fig. 2I, p = 0.001).
3.3 Correlation between HDGF expression and prognosis
As indicated by our KM curves, patients with HCC with high expression of HDGF exhibited significantly shorter OS, DSS and PFI (Fig. 3A‒C, p = 0.001, p = 0.001, and p = 0.011). However, given the fact that we wanted to evaluate the predictive value of HDGF for prognosis we then went on to produce a series of time-dependent ROC curves which revealed that the under the ROC curve (AUC) values (0.704, 0.661, and 0.647) for 1-, 3- and 5-year OS time (Fig. 3D), (0.734, 0.679, and 0.644) for 1-, 3- and 5-year DSS time (Fig. 3E) and (0.623, 0.553, and 0.636) for 1-, 3- and 5-year PFI time (Fig. 3F) all indicate that HDGF has the potential to function as a good predictor for HCC prognosis.
We then went on to explore the prognostic value of HDGF in HCC in more detail using both univariate and multivariate Cox regression analyses (Table S2). Our univariate Cox regression indicated that T stage (T3 and T4 vs. T1 HR = 2.949, p <0.001), M stage (M1 vs. M0 HR = 4.077, p = 0.017), pathological stage (Stage III vs. Stage I, HR = 2.734, p <0.001; Stage IV vs. Stage I, HR = 5.597, p = 0.004), tumor status (with tumor vs. tumor free, HR = 2.317, p < 0.001) and HDGF (HR = 1.871, p <0.001) were all potential prognostic factors for HCC. While subsequent multivariate Cox regression analysis indicated that tumor status (HR = 1.783, p = 0.016) and HDGF expression levels (HR = 1.893, p = 0.008) acted as independent prognostic factors for OS in patients with HCC. However, these same multivariate Cox regression analyses revealed that HDGF expression levels were not an independent risk factor for DSS and PFI (p > 0.05).
3.4 Functional and immune analysis of HDGF
Differences in the transcriptional profiles of the high and low HDGF expression groups were used to identify various DEGs in the hope of better understanding its mechanistic effects. These evaluations identified a total of 1919 DEGs meeting the inclusion criteria, log2(FC) ≥1 and FDR ≤ 0.05, 1153 of which were upregulated, and 766 downregulated (Fig. 4A). We then went on to annotate the top 5 upregulated (LGALS14, HMGA2, SST, CEACAM7, and MAGEA4) and downregulated DEGs (ANGPTL7, MT1B, PCSK1, PITPNM2-AS1, AC107396.1) within the volcano plot (Fig. 4B). Results of GO/KEGG analysis revealed a close association between HDGF and detoxification of copper ions, stress response to copper ions, detoxification of inorganic compounds, Neuroactive ligand-receptor interactions, and mineral absorption (Fig. 4C‒E).
Subsequent GSEA showed a positive correlation between HDGF expression and several other pathways (Fig. 4F‒K), including the Rho-GTPases (NES = 2.161, p.adjust = 0.018, FDR = 0.012), GPCR (NES = 1.529, p.adjust = 0.018, FDR = 0.012), and Neuronal signaling pathways (NES = 1.877, p.adjust = 0.018, FDR = 0.012) as well as those regulating the cell cycle (NES = 2.806, p.adjust = 0.018, FDR = 0.012) and the TP53 signaling pathway (NES = 1.830, p.adjust = 0.018, FDR = 0.012).
Given this we went on to further explore the relationship between HDGF and tumor immunity using infiltration analysis. These evaluations showed that HDGF was closely associated with TIME with our Spearman’s correlation coefficients and p-values for HDGF and Stromal (−0.228, p <0.001), and Immune score (−0.187, p <0.001) recorded in Fig. 5A. These evaluations also confirmed that there was a strong correlation between HDGF expression and cytotoxic, plasmacytoid dendritic cells (pDC), Neutrophils, DC, T cells, Tgd, and Th2 cell infiltration (Fig. 5B, p < 0.001). Both our individual scatter plots (Fig. 5C‒E) and group comparisons (Fig. 5F‒H) confirmed the negative correlation between HDGF and both cytotoxic (r = −0.337, p < 0.001) and pDC (r = −0.224, p < 0.001) cell infiltration and confirmed the positive correlation between HDGF expression and Th2 cells (r = 0.243, p < 0.001) infiltration.
3.5 Effects of DNA methylation on HDGF expression
It is worth noting that both genome instability and increased oncogene expression are frequently associated with abnormal promoter demethylation. Given this, we went on to evaluate the relationship between increased HDGF expression and DNA demethylation using the TCGA-LIHC dataset in an effort to understand the potential regulation of this protein (Fig 7). Pearson correlation results indicate a negative correlation between HDGF expression and its gene methylation level especially around the three CpGs, TSS-2080 bp (Fig. 6A, r = −0.190, p < 0.001), TSS-740 bp (Fig. 6E, r = −0.240, p < 0.001) and TSS-396 bp (Fig. 6F, r = −0.102, p = 0.049), located upstream of its transcriptional start site (TSS). However, several other results were shown to be nonsignificant, suggesting that while aberrant demethylation is likely one of the primary mechanisms regulating HDGF expression in HCC it is not the only mechanism in place.