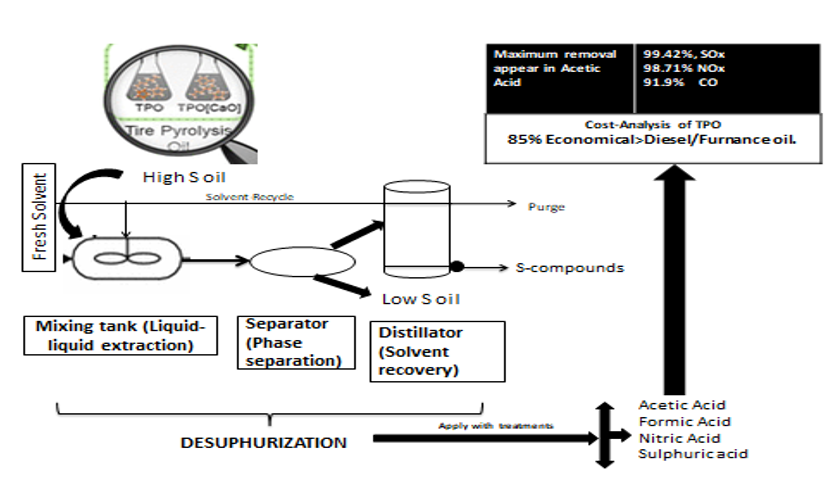
The need of sustainable energy source arises with the time due to the reduction of the other energy sources like diesel, petroleum etc. Application of tyre oil in place of diesel hinders due to the high level of impurities, emissions and bad odor. This study comprises of removal of these impurities and reduction in emissions by oxidative desulfurization of TPO at laboratory scale. Different treatments are prepared of different concentrations (15, 20 and 25%) of acid and H2O2 mixtures such as acetic acid/H2O2, formic acid/H2O2), 8% H2SO4 and 20% HNO3 at varying temperature conditions. Emissions of crude TPO, desulfurized TPO and diesel measured by burning it into enclosed cylindrical iron container at small scale without mixing any other fuel. In Acetic acid treatment maximum reduction of the SOx emission occur at 45ºC. This treatment removes 99.42%, 98.71% and 91.9% of SOx, NOx and CO respectively for 1:2 with 20% conc. In formic acid treatment, removes the significant amount of SOx, NOx and CO (99.71%, 71.69% and 83.2% respectively) for 2:1 ratio with 25% conc. Viscosity of the treated samples varied significantly from 1.96cSt for nitric acid to 87.65cSt for formic acid/H2O2. Calorific values of samples are lower at the lowest emissions of SOx. The oxidative desulfurization of crude TPO is effective for the reduction of the sulfur content, hazardous gaseous and improve fuel and air quality. Cost analysis of crude TPO shows that the use of TPO in power generation is 85% more economical than the diesel and furnace oil.
Research Article
Desulfurization of Tyre Pyrolysis Oil (TPO) for fuel production using different acids and H2O2 Mixtures.
https://doi.org/10.21203/rs.3.rs-2131984/v1
This work is licensed under a CC BY 4.0 License
Version 1
posted
You are reading this latest preprint version
Desulfurization
Tyre Pyrolysis Oil (TPO)
Nitrogen Oxides (NOx)
Sulphur Oxides (SOx)
The major force which push the society to find the new alternative for the source of power generation is the reduction in the fossil fuels (Vihar et al., 2015). We can generate the oil from tyres as they are produced from non-biodegradable and artificial polymers. These polymers have harmful effect to the environment (Idris et al., 2018; Serefentse et al., 2019; Ighalo et al., 2021). Tyre oil is produced by the pyrolysis process. This oil is more concerned because it have higher calorific value ranges from 35–43 MJ/kg that is enough for producing power in engines (Hita et al., 2016). Oil derived after pyrolysis cannot be used directly before removing the impurities through effective treatment. Oil is used in boilers and combustion engines after the effective removal of sulfurous compounds (Umeki et al, 2016). Operating parameters of pyrolysis such as temperature, heating rate, type of catalysts and pressure exerted significant impact on the waste tyre characteristics (Wang et al., 2019).
Desulfurization can be stated as the process in which the amount of sulfur reduced from the oil obtained after the pyrolysis of waste tyre (Aydın & İlkılıç, 2012 ; Toteva and Stanulov, 2019). There are three types of desulfurization; HDS is the process in which the tyre oil treated with hydrogen under high pressure and temperature (Liu et al., 2017). Hydrogen react with sulfur to convert it into hydrogen sulfide (H2S) (Jantaraksa et al., 2015 ; Osayi et al., 2018). ODS is the extraction of the sulfurous compounds perform by the oxidative agent at low temperature and pressure (S. Ahmad & Ahmad, 2013;Gao et al., 2018; Julião et al., 2020). BDS is a process in which Sulfur removed by microorganisms without breaking it into its heterocyclic compounds. Fuel value is not reduced by this process (Rahpeyma et al., 2017). Adsorptive desulfurization (ADS) also used as purification technique of tyre oil (Al-Lal et al., 2015). Sulfur can be converted into the sulfide by using adsorptive agents (Cu and Ag zeolites) (Tan et al., 2017).
Oxidative desulfurization has greater attention due to the highest conversion rate and effective removal of sulfur up to 90%. The process of removal of sulfur from the tyre oil performed by acetic acid (Chen et al., 2010) and using hydrogen per oxide as a catalyst. Acetic acid show best results with 1:2 ratio with highest conversion of dibenzothiofen (DBT) (Aydın & İlkılıç, 2012 ;Ye et al., 2020). H2O2 give a layer to the fuel which is important to note. This process required a full attention to improve the oxidative desulfurization and performance to achieve the low-sulfur fuel (Khan et al., 2016). The fuel is separated by solvent extraction method in which immiscible liquids are separated. Sulfoxides or sulfones can be separated from oxidative oil by using acetic acid and H2O2 mixture as a solvent (Chen et al., 2010 ; Gao et al., 2018; Tahir et al., 2021).
The combustion of tyre oil produces CO, SOx, NOx and CO2. This emission can be decrease after the purification of tyre oil by oxidative desulfurization (Tabinda et al., 2018). Combustion of fuel that contains sulfurous compounds produce sulfate aerosols, sulfur oxides, particulate matter that contain sulfate in it (Mark et al., 2018). Sulfur amount present in the liquid extracted tyre is only 1%, while the remaining converted into gas in the form of H2S. The sulfur content of tyre oil lower than the commercial diesel (İlkılıç & Aydın, 2011). These emissions cause Acid rain, Smog that effect human respiratory system (Mark et al., 2018). Incomplete combustion of tyre fuel (TF) also lead to the emission of CO that is deadly harmful to the organisms (İlkılıç & Aydın, 2011 ; Chen et al., 2021).
Emissions of NOx are higher in TPO that clearly showed that the amount of nitrogen is higher in the TPO throughout operating range. As the amount of CN increases the NOx emissions are lower that means variations in CN values affect the NOx emissions for TPO (Vihar et al,, 2015). Emissions of NOx and SOx are determined in relation with excessive amount of oxygen (Murugan et al., 2008). Combustion of fuels that contain the sulfurous compounds omit great quantity of SOx with the harmful influence on human health, environment and economy of the country as well (Betiha et al., 2018).
Viscosity is the property of a liquid to resist the flow. Viscosity of a tyre fuel is between 2-6cSt among all the other oils. Higher viscosity values not only hinders the flow but also affect the burning of the TPO in the combustion engine (Ahmad et al., 2016). Calorific value is the energy content of that fuel, which measure the energy release by the combustion of the fuel. Calorific values affected by the oxidative desulfurization as the SOx emission decrease the calorific values also decrease due to the conversion of compounds during the process (Khan et al., 2016).
The objectives of the study are purification of TPO by using different acid mixtures to reduce the emissions of SOx. Determination of Calorific values from the samples which have least SOx values and Cost Analysis of TPO with diesel.
2.1. Oxidative Desulfurization:
The process which converts the sulphur into oxidized from to separate it by solvent extraction technique is called ODS. Different organic and inorganic acid mixture use to separate the layer. There are following mixture use to extract the sulfur from the crude TPO: Acetic Acid (CH3COOH) + Hydrogen per Oxide (H2O2) and Formic Acid (CHOOH) + Hydrogen per Oxide (H2O2) with the concentration of 15, 20 and 25% for the ratios of 1:1, 1:2 and 2:1. 20% Nitric Acid (HNO3) and 8% Sulfuric Acid (H2SO4). These mixtures of acid react as a solvent. Heating temperature for the concentrations are 40, 45 and 50ºC with shaking time of 2 hour at 600rpm. Settling time for the separating of layer was 4–18 hour. Separate the layer and store for further analysis.
Kinetic viscosity and calorific values of treated TPO, crude TPO and diesel is determined. Gaseous emissions like CO, CO2, NOx and SOx exhausted by burning of oil. The main focus of the research is to choose the most effective purification method for crude TPO.
2.2. Kinematic Viscosity:
Ostwald viscometer was used to determine the viscosity of the sample that was also called as capillary viscometer. In first step viscosity of the reference liquid determine through viscometer and the sample viscosity determined through this reference liquid. Working principle of viscosity meter is a function of viscosity and density of liquid. Density of the sample determined through the specific gravity bottle and stop watch through their flow time. Determination of density of reference and test liquid through the Gravimetric method (Muhammad Usman et al., 2013; Zhang et al., 2021).
7–9 ml sample poured into the viscometer till the bulb filled half. Then sample sucked up through sucker up to the mark A. after the completion of suction pressure was released to flow the liquid through the mark A to the mark B bellow the bulb. Time was recorded for each flow and following formula was applied for the calculation of kinematic viscosity (Barnes et al, 1989 ; Enes et al., 2021).
Kinematic viscosity = dynamic viscosity/density

Where, ηs is kinematic viscosity of sample, ηw is kinematic viscosity of water, ts is flow time of sample in capillary, ρs is density of sample, tw is flow time of water in capillary and ρw is density of water.
2.3. Gaseous emissions:
Sample tyre oil, diesel and treated oil with acids mixtures and acids are burned directly without any mixing of other fuels. An enclosed cylinder used for the burning of tyre sample and treated samples to prevent the any interfering f metrological factors like humidity, wind speed or rain. In enclosed cylinder emissions are channelized to the upper hole of container for measurements. The height of the cylinder was 3–4 feet. 4-6ml sample burned in the cylinder and emissions measured by flue gas analyzer Optima 7 mru from the samples.
2.4. Calorific value:
Calorific values of samples determined by the bomb calorimeter. 0.5 ml amount of sample filled in crucible. In inner terminal of the bomb a piece of copper wire was stretched and a cotton piece attached to the terminal on the other end that is dipped into the oil. 25 atmospheric pressure is filled in the bomb using oxygen cylinder and the vessel filled with the 2.5 litter water to cover the bomb completely. Tightly closed bomb place into the calorimeter and digital thermometer adjusted. Stirring of water started and after that every 5 minute change in temperature was noted until the rate of change decrease. Maximum values noted and stop stirring and removed the bomb from vessel. Stay for 30 mint to remove the mist and release of pressure through valve. Following was the formula used to determine the calorific values of samples (Puni, R., 2011.).
G.C.V = We + (M × Cp × ΔT)/W
G.C.V = gross calorific value (cal/g), W = weight of air dried sample (g), We = Water equivalence of apparatus (g), M = mass of water = density of water × volume (g), Cp = specific heat of water (1cal/g) and ΔT = maximum rise in temperature (T1-T2) (oC)
2.4. Cost analysis and price description:
For energy cost analysis we visit the pyrolysis plant and analyze the total expenses and expenses per day during the pyrolysis process. As the cost determined we also determine the production and sale cost of the products. Total capital cost for the plant is 12.5 million with 20 years life-time. One engineer is on the duty for the whole day to keep the maintenance. Engineer charged 60,000–70,000 Rs per month. One labor person is present for the addition of feedstock in the plant and removal of the products and by-products. He charged 20,000–30,000 Rs/month. There are three products produced from the pyrolysis process in form of liquid (tyre oil), solid (carbon and steel) and gas (CH4). 34% tyre oil produced after the removal of water (Oliveira Neto et al., 2019).
Hydrogen per oxide was used with acetic acid and formic acid as a mixture with different ratios because this acid have strong abilities to oxidize the variety of compounds and it have 47% active oxygen in it (Tabinda et al., 2018). Gaseous emissions from the treated samples at different concentrations (15, 20, 25%) at different temperatures (40, 45, 50ᵒC) with different ratios for acetic and formic acid (1:1, 1:2, 2:1) compared with untreated TPO and diesel oil (Table 1).The results showed the reduction in the gaseous emissions (SOx, NOx, CO and CO2) after the process of desulphurization. All reaction treatments showed less gaseous emissions except for 20% nitric acid but these emissions did not exceeds from the emissions of crude TPO. CO2 removed completely for some conditions but some for not due to the combustion process. Among all the reaction conditions acetic acid showed best results for the removal of SOx, NOx and CO2 from the crude TPO and best results observed at 1:2 ratio with 20% concentration at 45ᵒC. Increase in the emissions of O2 observed after the treatments. TPO often contain 1.65-4% sulphur in it (Han et al., 2018). Sulfur is the crosslinking agent added to the pyrolysis process (Quek & Balasubramanian, 2013). SOx and NOx emissions are three times higher in TPO 350 and 309 respectively as compared to the diesel fuel (Williams et al., 1998; Han et al., 2018). Tabinda et al stated that desulphurization reduce the sulphur content from 4–0.2% and reduction in the sulphur content reduced the SOx emissions up to 96% (Tabinda et al., 2018). Formic acid and H2O2 shows the best reduction in the emissions at 2:1 ratio with 25% conc. at 45ᵒC. Sulphuric acid treatment shows best results at 40ᵒC with 25% con. same for nitric acid treatment except for concentration that is 20%. The effective treatment of Crude TPO stated in the Table 1.
|
Treatments |
Parameters |
||||||||||||
|---|---|---|---|---|---|---|---|---|---|---|---|---|---|
|
Ratios |
Temp. (ᵒC) |
Conc. (%) |
SOX (ppm) |
NOx (ppm) |
CO (ppm) |
CO2 (ppm) |
O2 (%) |
Viscosity (cSt) |
|||||
|
Diesel oil |
3 |
120 |
201 |
2.98 |
14.2 |
2.13 |
|||||||
|
Crude Tyre Pyrolysis Oil (TPO) |
350 |
309 |
1502 |
4.56 |
18.7 |
1.58 |
|||||||
|
CH3COOH/H2O2 mixture treatments |
|||||||||||||
|
1:1 |
40 |
15 |
45 |
60 |
420 |
Nil |
19.3 |
8.57 |
|||||
|
20 |
34 |
101 |
310 |
Nil |
19 |
3.02 |
|||||||
|
25 |
38 |
90 |
290 |
Nil |
19.5 |
6.41 |
|||||||
|
45 |
15 |
55 |
110 |
510 |
Nil |
18.2 |
2.92 |
||||||
|
20 |
60 |
53 |
470 |
Nil |
18.5 |
3.54 |
|||||||
|
25 |
45 |
75 |
260 |
Nil |
18.0 |
6.89 |
|||||||
|
50 |
15 |
40 |
89 |
312 |
Nil |
18.9 |
2.93 |
||||||
|
20 |
47 |
30 |
600 |
Nil |
18.7 |
24.07 |
|||||||
|
25 |
50 |
204 |
540 |
Nil |
19.2 |
3.44 |
|||||||
|
1:2 |
40 |
15 |
25 |
210 |
110 |
Nil |
19.8 |
24.79 |
|||||
|
20 |
2 |
14 |
121 |
Nil |
19.2 |
33.28 |
|||||||
|
25 |
31 |
69 |
678 |
Nil |
19.5 |
5.22 |
|||||||
|
45 |
15 |
34 |
12 |
270 |
Nil |
19.0 |
42.53 |
||||||
|
20 |
2 |
4 |
78 |
Nil |
20.1 |
4.26 |
|||||||
|
25 |
15 |
80 |
120 |
Nil |
20.5 |
8.82 |
|||||||
|
50 |
15 |
30 |
130 |
150 |
Nil |
19.8 |
54.01 |
||||||
|
20 |
34 |
210 |
210 |
Nil |
19.5 |
4.21 |
|||||||
|
25 |
32 |
114 |
123 |
Nil |
19.2 |
10.16 |
|||||||
|
2:1 |
40 |
15 |
50 |
88 |
759 |
Nil |
18.4 |
7.096 |
|||||
|
20 |
38 |
103 |
166 |
Nil |
18.6 |
2.19 |
|||||||
|
25 |
45 |
240 |
199 |
Nil |
19.2 |
6.43 |
|||||||
|
45 |
15 |
35 |
212 |
249 |
Nil |
20.1 |
2.76 |
||||||
|
20 |
33 |
50 |
100 |
Nil |
19.5 |
3.75 |
|||||||
|
25 |
31 |
14 |
212 |
Nil |
18.9 |
3.45 |
|||||||
|
50 |
15 |
45 |
79 |
496 |
Nil |
19.2 |
18.489 |
||||||
|
20 |
35 |
90 |
213 |
Nil |
18.5 |
6.635 |
|||||||
|
25 |
34 |
65 |
227 |
Nil |
19.2 |
3.79 |
|||||||
|
CHOOH/H2O2 mixture treatments |
|||||||||||||
|
1:1 |
40 |
15 |
101 |
210 |
1192 |
Nil |
14.5 |
8.77 |
|||||
|
20 |
108 |
120 |
2056 |
1 |
13.6 |
5.21 |
|||||||
|
25 |
85 |
140 |
1204 |
Nil |
13.8 |
7.804 |
|||||||
|
45 |
15 |
145 |
170 |
2031 |
1 |
13.5 |
4.16 |
||||||
|
20 |
130 |
230 |
1840 |
Nil |
13.9 |
13.24 |
|||||||
|
25 |
102 |
345 |
1400 |
Nil |
14.2 |
5.71 |
|||||||
|
50 |
15 |
75 |
201 |
850 |
Nil |
15.6 |
4.41 |
||||||
|
20 |
125 |
256 |
730 |
Nil |
19.5 |
14.98 |
|||||||
|
25 |
115 |
111 |
1524 |
1 |
21.7 |
4.82 |
|||||||
|
1:2 |
40 |
15 |
75 |
35 |
267 |
Nil |
20.2 |
65.85 |
|||||
|
20 |
45 |
210 |
980 |
Nil |
19.5 |
46.42 |
|||||||
|
25 |
60 |
130 |
1202 |
Nil |
19.2 |
23.37 |
|||||||
|
45 |
15 |
105 |
267 |
890 |
Nil |
21.2 |
38.88 |
||||||
|
20 |
59 |
153 |
245 |
Nil |
20.5 |
48.94 |
|||||||
|
25 |
76 |
206 |
456 |
Nil |
19.8 |
16.18 |
|||||||
|
50 |
15 |
110 |
56 |
520 |
Nil |
19.5 |
87.65 |
||||||
|
20 |
101 |
37 |
620 |
1 |
18.2 |
78.21 |
|||||||
|
25 |
120 |
340 |
240 |
Nil |
18.0 |
68.61 |
|||||||
|
2:1 |
40 |
15 |
67 |
99.19 |
178 |
Nil |
17.5 |
5.12 |
|||||
|
20 |
68 |
93.95 |
262 |
Nil |
18.2 |
10.17 |
|||||||
|
25 |
39 |
91.23 |
282 |
1 |
16.4 |
2.55 |
|||||||
|
45 |
15 |
42 |
93.17 |
215 |
1 |
11.1 |
11.11 |
||||||
|
20 |
62 |
87.64 |
452 |
Nil |
12.5 |
3.25 |
|||||||
|
25 |
1 |
87.48 |
258 |
Nil |
13.7 |
4.29 |
|||||||
|
50 |
15 |
66 |
97.83 |
342 |
Nil |
17.8 |
17.11 |
||||||
|
20 |
68 |
97.35 |
259 |
Nil |
18.5 |
3.13 |
|||||||
|
25 |
2 |
90 |
243 |
0.26 |
19.5 |
5.32 |
|||||||
|
8%H2SO4 treatments |
|||||||||||||
|
8% |
40 |
15 |
35 |
101 |
530 |
0.45 |
19.2 |
2.87 |
|||||
|
20 |
32 |
70 |
240 |
0.24 |
18.6 |
4.74 |
|||||||
|
25 |
20 |
21 |
199 |
0.69 |
19.5 |
2.51 |
|||||||
|
45 |
15 |
60 |
180 |
600 |
0.33 |
19.4 |
7.14 |
||||||
|
20 |
45 |
150 |
340 |
0.56 |
17.5 |
2.61 |
|||||||
|
25 |
75 |
26 |
364 |
0.33 |
19.5 |
4.22 |
|||||||
|
50 |
15 |
205 |
83 |
340 |
0.66 |
16.3 |
2.17 |
||||||
|
20 |
250 |
350 |
760 |
0.54 |
17.2 |
5.82 |
|||||||
|
25 |
230 |
280 |
680 |
0.32 |
18.3 |
2.63 |
|||||||
|
20%HNO3 treatments |
|||||||||||||
|
20% |
40 |
15 |
95 |
375 |
1208 |
1 |
19.2 |
2.09 |
|||||
|
20 |
80 |
230 |
413 |
1 |
18.5 |
4.42 |
|||||||
|
25 |
85 |
350 |
1001 |
1 |
19 |
2.52 |
|||||||
|
45 |
15 |
150 |
200 |
900 |
1 |
17.6 |
4.57 |
||||||
|
20 |
122 |
100 |
850 |
1 |
18.2 |
1.96 |
|||||||
|
25 |
101 |
48 |
597 |
1 |
17 |
2.79 |
|||||||
|
50 |
15 |
160 |
210 |
1400 |
1 |
17.5 |
4.68 |
||||||
|
20 |
145 |
108 |
1574 |
1 |
17.6 |
2.59 |
|||||||
|
25 |
180 |
184 |
1634 |
1 |
17 |
6.16 |
|||||||
Table.2. Percentage removal of SOx and NOx in treatments using acid mixtures and acids
|
Sr. no |
Treatment |
Ratio |
Percentage reduction in SOx (%) |
Percentage reduction in NOx (%) |
|
1 |
Acetic acid/ H2O2 with 20% at 45ºC |
1:2 |
99.42 |
98.71 |
|
2 |
Formic Acid/ H2O2 with 25% at 45ºC |
2:1 |
99.71 |
71.69 |
|
3 |
8% H2SO4 with 25% at 40ºC |
- |
94.28 |
93.20 |
|
4 |
20% HNO3 with 20% at 40ºC |
- |
77.14 |
25.71 |
NOx = Nitrogen oxides; SOx = Sulphuric Oxides.
Table.3. Calorific values of treated samples with least gaseous emissions
|
Treated Samples |
Ratios |
Temperature (ºC) |
Concentration (%) |
Calorific value (MJ/Kg) |
|
Diesel |
- |
Room Temperature |
- |
44.5 |
|
Pyrolysis oil |
- |
Room Temperature |
- |
43.50 |
|
Acetic acid + H2O2 |
1:1 |
40 |
20 |
42.90 |
|
1:2 |
45 |
20 |
41.10 |
|
|
2:1 |
45 |
25 |
42.60 |
|
|
Formic acid + H2O2 |
1:1 |
50 |
15 |
42.40 |
|
1:2 |
40 |
20 |
43.30 |
|
|
2:1 |
45 |
25 |
40.40 |
|
|
8% H2SO4 |
- |
40 |
25 |
43.20 |
|
20% HNO3 |
- |
40 |
25 |
43.40 |
Table.4. Energy cost analysis of tyre pyrolysis oil
|
Type of cost |
Unit |
Tyre oil |
|
Total capital cost |
Rs |
16.051466 million |
|
Capital cost |
Rs/Day |
2229.37 |
|
Expenses |
||
|
Operation expenses |
Rs/Day |
500 |
|
Feed stock expenses |
Rs/Day |
0.4 million |
|
Maintenance expenses |
Rs/Day |
1500 |
|
Labor expenses |
Rs/Day |
3000-4000 |
|
Taxes |
Rs/Day |
1209.35 |
|
Total expenses |
Rs/Day |
0.41043 million |
|
Profit |
Rs/Day |
55000-65000 |
|
Total production |
Rs/Day |
0.468million |
|
Oil production |
liter/Day |
6000-7000 |
|
Production cost |
Rs/liter |
35-45 |
Rs = Rupees.
Oxidative desulphurization:
Desulfurization effects the emissions of SOx, NOx, and CO after the treatment with different conc. at different temperature. According to Liu et al the with the increase in the conc. of H2O2 emissions of SOx decrease and the extraction of the sulfur through solvent extraction is increase (Liu et al., 2017). Emissions of the gasses decrease with the increase of concentrations (Fig. 1, 2, 3 &4). Sulfur present in the crude TPO converted into the SO3 and SO2 and emitted through exhaust. SO2 doesn’t influence the emissions of other gasses (Rang et al., 2006 ; ). Emissions of SOx, NOx and CO decrease at all concentration but the most effective conc. are 20 and 25% at 40 and 45 ºC that means these conc. and temperature treatments effect the desulfurization in best manner to reduce the SOx emissions after combustion.
Reduction in the SOx emissions is due to the conversion of compounds into less hazardous compounds and absorption into the solvent to remove these compounds from the TPO (Kozak & Merkisz, 2005 ; Hossain et al., 2019). Treatments which are effectively reduced the SOx emission can also be effective to reduce the NOx emissions. Some treatments show higher emission of NOx due to the fuel bond nitrogen (FBN). NOx emissions are affected by air/fuel ratio as the higher air/fuel ratio decrease the emissions. While the FBN increase the emissions of NOx. Ignition delay also contribute in the larger emission of NOx (Vihar et al., 2015). Emissions of CO is increased at low temperature due to the incomplete burning. Time and Air are the most important factors as the insufficient time and air unable to oxidize the CO into CO2 (Arpa & Yumrutas, 2010 ; Bhaskar et al., 2022)
This study revealed that the most efficient and effective treatment with respect to the desulfurization and reduction of the SOx and NOx emissions was the 20% acetic acid with 45ºC temperature (table 2). Pyrolysis process removed the sulphur content from the TPO upto 83.75% and further removal in the sulphur content is achieved with the oxidative desulphurization. The more powerful oxidizing agents are also more corrosive and reactive like peroxy acids. The reaction mixture formed from the formic acid/H2O2 and acetic acid/H2O2. Peroxy acids are polar compounds so they have ability to separate the layer formed after the reaction. For H2O2 Martin et al. stated that it was a strong oxidizing agent having 47% of mass unit active oxygen (2010). Advantage of using H2O2 as oxidizing agent is that the reaction proceeds at very mild conditions and no surplus heating required. It can oxidize the variety of organic compounds (Arpa & Yumrutas, 2010 ; Fu et al., 2022).
Viscosity:
Viscosity of the treated sample has vast ranges in case of formic acid and acetic acid sulfuric acid and nitric acid treatments. Table 1 represents the all treated samples values for all the treatments. Diesel oil viscosity ranges up to 2-6cSt (Aydın & İlkılıç, 2012). As the sample treated with acetic acid/H2O2 fall within the range as the diesel. At 40ºC with 20% concentration viscosity is 2.19cSt while at 45ºC with 15% conc. for 2:1 ratio while the highest value is 42.53cSt at 45ºC with 15% conc. for 1:2 ratio. The lowest value of viscosity in formic/H2O2 treatment is 2.55cSt at 40ºC with 25% conc. for 2:1 ratio while the highest value in the treatment are incredibly high for the 1:2 ratio. Viscosity of the 8% H2SO4 treatments is fall within the range of diesel. The lowest value of viscosity at 50ºC with 15% concentration that is 2.17cSt and for nitric acid minimum value of viscosity is at 45ºC with 20% conc. is 1.96cSt that is less than the diesel lowest value (2cSt).
Decrease in the viscosity is due to the increased amount of CH3COOH in the mixture. Formation of larger molecule due to the heating can contribute in the high viscosity of the fuel (Hossain & Davies, 2013 ; Perez et al., 2022). Increase in the amount of viscosity is due to the poor settling of the suspended particles in the sample that is result in form of sludge separation. Lower viscosity is better for the efficient engine performance and have efficient mixing of air/fuel ratio. Decrease in the viscosity is due to the removal of aromatic compounds from the fuel (Ahmad et al., 2016 ; Liu and Zhang, 2022). As viscosity not affect the emissions of SOx, NOx, and CO in the samples but it affect the efficiency of the engine when it is use in comparison with diesel. Viscosity of the fuel can be lower by pre-heating before entering the fuel in the engine (Miteva et al., 2016).
Calorific values:
The calorific value of crude TPO (43.50MJ/kg) is excellent as compared to the values of diesel (44.5MJ/kg) that it shows that the oil have almost equal extent to diesel to produce energy (Singh et al., 2019).
Table 3 represents the calorific values for the conditions where less SOx emissions observed. For the acetic acid/H2O2 treatment calorific value is highest for 2:1 at 45ºC with 25% conc. This highest value is lower than the calorific value of crude TPO. Formic acid/H2O2 treatment is show highest value for 1:2 at 40ºC with 20% concentration but this value is also lower than the crude TPO. 8% H2SO4 treatment calorific value is consider insignificant because it have very low difference from crude TPO while the 20% HNO3 shows the highest calorific values among all the treatments.
From the above calorific values we can stated that the SOx emissions affect them. As the increase in Sulfur removal from the fuel decreases the calorific values of the treated samples and where the Sulfur removal is not significant the calorific values of the samples are high and insignificant. This relationship of SOx emissions and calorific value help us to analyze that desulfurization effects the calorific values of the treated samples (Aydın & İlkılıç, 2012 ; Zhong et al., 2022). NOx emission does not affect the calorific values as the emissions of SOx. Change in calorific values in sequence with NOx emissions is not considerable. However the process of desulfurization affects the calorific values as the calorific values in all treated samples decrease than the crude TPO (Quek & Balasubramanian, 2013 ; Teoh et al., 2022). So we can conclude that the desulfurization lower the calorific value of TPO.
Energy cost analysis:
Fuel cost analysis is performed for the cost analysis under financial expenses and benefits during the production of the product. Cost analysis is not affected by the output of the products.
Figure shows the expenses and benefits on the pyrolysis plant. The ratio of profit is far higher as compared to operational cost of project. It has not only economical but also its one of sustainable practice. It not only served as an opportunity but also serves as an option to get rid of solid waste. All that needed is capacity building, governmental supervision and private enterprisers and interest groups to serve the purpose.
Recent sale price of the diesel in markets is 113.24Rs/liter. Price of diesel is much higher than the price of crude TPO as it have sold in market at 45-55Rs/liter. From the above economic analysis we can state that the crude TPO is more economical than the diesel and furnace oil. Price of pyrolysis oil is 85% less than the price of diesel oil (Wongkhorsub & Chindaprasert, 2013 ; Damiri, 2022).
Pyrolysis process produces different products and by-products such as oil, carbon black and methane gas. These products useful in the different industries as the TPO is used in industry in place of furnace oil, carbon black in shoe industry and methane gas used to generate the energy in pyrolysis process. Pyrolysis process have some unusual by products such as carbon credit and energy. These carbon credits are claimed by the company after certification in the governmental certifying agency (Neto et al., 2019).
Untreated TPO have a high amount of sulfur content that is greater than 1%. For the treatment of crude TPO Oxidative desulfurization selected among all the processes of desulfurization. Oxidative desulfurization remove the sulfur content by oxidizing the fuel. Parameters selected for the measurement are SOx, NOx, CO, CO2 and O2 emit during the burning. Reduction of the Sulfur content measured by the SOx emissions in exhaust. Variations in all gasses measured along with physical parameters such as viscosity and calorific value. Four types of acid treatment such as formic acid/H2O2, acetic acid/ H2O2, 8%H2SO4 and 20%HNO3. For acetic and formic acid with H2O2 mixture, different ratios such as 1:1, 1:2 and 2:1 are used. All treatments carried out at different temperature (40ºC, 45ºC and 50ºC) with different conc. (15%, 20% and 25%) of fuel and acids. In acetic acid among all the treatment ratios, 1:2 acid mixture ratio with 20% conc. at 45ºC was showed best removal of pollutants from it not only SOx but other pollutants such as NOx, CO and CO2. Formic acid shows best result for 2:1 ratio at 45ºC with 25% conc. This treatment is not only lower SOx emissions but also other gasses such as NOx and CO emissions remove 99.42%, 98.71% and 91.9%s respectively. Sulfuric acid and nitric acid treatments are also effective for the desulfurization of the crude TPO. Viscosity of the treated sample increases with the removal of sulfur content from it. So the fluctuation in the values of viscosity is due to the decrease in the SOx emissions from it. Calorific values are also decrease with the decrease in the emission of SOx from the treated samples. Desulfurization of crude TPO prove effective for the removal of hazardous gasses that is refer to the removal of sulfur content from it. Hence it proved that oxidative desulfurization improves the quality and resultant air emissions after burning it into the enclosed cylinder and influence the physical parameters of the treated samples. Economic analysis of crude TPO shows that it is more economically beneficial than the diesel and furnace oil. Crude TPO is 85% more economical than the diesel and furnace oil.
Ethical Approval
“There is no human or animal subject involved hence ethical approval is not required”.
Consent to Participate
“There is no individual involved in the study hence consent to participate is not required”.
Consent to Publish
“There is no individual involved in the study hence consent to publish is not required”.
Author contributions
[All authors] contributed to the study’s conception and design. Sample collection, Lab, and data analysis were performed by [Dr. Amtul Bari Tabinda, Nida Bawar]. The first draft of the manuscript was written by [Mahnoor Nadeem, Rizwan Rasheed]. The technical guidance and manuscript review was done by [Dr. Abdullah Yasar, Dr. Amtul Bari Tabinda]. All authors commented on previous versions of the manuscript. All authors read and approved the final manuscript.”
Funding
“The authors declare that no funds, grants, or other support were received during the preparation of this manuscript”.
Competing interests
“The authors have no relevant financial or non-financial interests to disclose”.
Availability of data and materials
“All data generated or analyzed during this study are included in this published article (and its supplementary information files)”.
- Ahmad, S., Ahmad, M., Imran, Naeem, K., Humayun, M., Sebt-E-Zaeem, S., & Faheem, F. (2016). Oxidative desulfurization of tire pyrolysis oil. Chem. Ind. Chem. Eng. Q, 22(3), 249–254. https://doi.org/10.2298/ciceq150609038a
- Ahmad, S., & Ahmad, M. I. (2013, December 13). Desulfurization of Oils; Produced from Pyrolysis of Scrap Tires. Nord. J. Engl. Stud. 6(1), https://doi.org/10.24949/njes.v6i1.43
- Al-Lal, A.-M., Bolonio, D., Llamas, A., Lapuerta, M., & Canoira, L. (2015). Desulfurization of pyrolysis fuels obtained from waste: Lube oils, tires and plastics. Fuel 150, 208–216. https://doi.org/10.1016/j.fuel.2015.02.034
- Arpa, O., & Yumrutas, R. (2010). Experimental investigation of Gasoline-Like Fuel obtained from waste lubrication oil on engine performance and exhaust emission. Fuel. Process. Technol., 91(2), 197–204. https://doi.org/10.1016/j.fuproc.2009.09.018
- Aydın, H., & İlkılıç, C. (2012). Optimization of fuel production from waste vehicle tires by pyrolysis and resembling to diesel fuel by various desulfurization methods. Fuel 102, 605–612. https://doi.org/10.1016/j.fuel.2012.06.067
- Aydın, H., & İlkılıç, C. (2015). Analysis of combustion, performance and emission characteristics of a diesel engine using low sulfur tire fuel. Fuel 143(143), 373–382. https://doi.org/10.1016/j.fuel.2014.11.075
- Barnes, H. A. (1989). An Introduction to Rheology: Volume 3 (K. Walters, Ed.; 1st ed.). Elsevier Science.
- Betiha, M. A., Rabie, A. M., Ahmed, H. S., Abdelrahman, A. A., & El-Shahat, M. F. (2018). Oxidative desulfurization using graphene and its composites for fuel containing thiophene and its derivatives: An update review, Egypt. J. Pet., 27(4), 715–730. https://doi.org/10.1016/j.ejpe.2017.10.006
- Bhaskar, S., Matthews, S. J., Jones, M. I., & Baroutian, S. (2022, September). Oxidised plasma-sprayed transition metal – Reusable supported catalysts for organic waste treatment.
- J. Ind. Eng. Chem., 113, 488–501. https://doi.org/10.1016/j.jiec.2022.06.024
- Calorific value of Liquid Fuel. (n.d.). Scribd. Retrieved September 30, 2022, from https://www.scribd.com/doc/67810928/Calorific-Value-of-Liquid-Fuel
- Campos-Martin, J. M., Capel-Sanchez, M. C., Perez-Presas, P., & Fierro, J. L. G. (2010). Oxidative processes of desulfurization of liquid fuels. J. Chem. Technol. Biotechnol., 85(7), 879–890. https://doi.org/10.1002/jctb.2371
- Chen, T.-C., Shen, Y.-H., Lee, W.-J., Lin, C.-C., & Wan, M.-W. (2010). The study of ultrasound-assisted oxidative desulfurization process applied to the utilization of pyrolysis oil from waste tires. J. Clean. Prod., 18(18), 1850–1858. https://doi.org/10.1016/j.jclepro.2010.07.019
- Damiri, O. A. (2022, March 7). Economic and Environmental Benefits Adoption of pyrolysis process of Scrap Tires in Palestine. Retrieved September 23, 2022, from https://repository.najah.edu/handle/20.500.11888/16864
- de Luna, M. Ds. G., Futalan, C. M., Dayrit, R. A., Choi, A. E. S., & Wan, M.-W. (2018). Evaluation of continuously mixed reactor configurations in the oxidative-adsorptive desulfurization of diesel fuel: Optimization and parametric studies. J. Clean. Prod., 203, 664–673. https://doi.org/10.1016/j.jclepro.2018.08.287
- Cengiz, E., Babagiray, M., Emre Aysal, F., & Aksoy, F. (2022, May). Kinematic viscosity estimation of fuel oil with comparison of machine learning methods. Fuel, 316, 123422. https://doi.org/10.1016/j.fuel.2022.123422
- Fu, Y., Yin, Z., Qin, L., Huang, D., Yi, H., Liu, X., Liu, S., Zhang, M., Li, B., Li, L., Wang, W., Zhou, X., Li, Y., Zeng, G., & Lai, C. (2022, January). Recent progress of noble metals with tailored features in catalytic oxidation for organic pollutants degradation. J. Hazard. Mater., 422, 126950. https://doi.org/10.1016/j.jhazmat.2021.126950
- Gao, S., Li, J., Chen, X., Abdeltawab, A. A., Yakout, S. M., & Yu, G. (2018a, July). A combination desulfurization method for diesel fuel: Oxidation by ionic liquid with extraction by solvent. Fuel, 224, 545–551. https://doi.org/10.1016/j.fuel.2018.03.108
- Gao, S., Li, J., Chen, X., Abdeltawab, A. A., Yakout, S. M., & Yu, G. (2018, July). A combination desulfurization method for diesel fuel: Oxidation by ionic liquid with extraction by solvent. Fuel, 224, 545–551. https://doi.org/10.1016/j.fuel.2018.03.108
- Han, J., Li, W., Liu, D., Qin, L., Chen, W., & Xing, F. (2018). Pyrolysis characteristic and mechanism of waste tyre: A thermogravimetry-mass spectrometry analysis. J. Anal. Appl. Pyrolysis., 129, 1–5. https://doi.org/10.1016/j.jaap.2017.12.016
- Hita, I., Arabiourrutia, M., Olazar, M., Bilbao, J., Arandes, J. M., & Castaño, P. (2016). Opportunities and barriers for producing high quality fuels from the pyrolysis of scrap tires. Renew. Sust. Energ. Rev., 56, 745–759. https://doi.org/10.1016/j.rser.2015.11.081
- Hossain, A. K., & Davies, P. A. (2013). Pyrolysis liquids and gases as alternative fuels in internal combustion engines – A review. Renew. Sust. Energ. Rev., 21, 165–189. https://doi.org/10.1016/j.rser.2012.12.031
- Hossain, M., Park, H., & Choi, H. (2019). A comprehensive review on catalytic oxidative desulfurization of liquid fuel oil. J. Catal., 9(3), 229. https://doi.org/10.3390/catal9030229
- Idris, R., Chong, C. T., & Ani, F. N. (2019). Microwave-induced pyrolysis of waste truck tyres with carbonaceous susceptor for the production of diesel-like fuel. J. Energy Inst. 92(6), 1831–1841. https://doi.org/10.1016/j.joei.2018.11.009
- Ighalo, J. O., Iwuozor, K. O., Ogunfowora, L. A., Abdulsalam, A., Iwuchukwu, F. U., Itabana, B., Bright, O. C., & Igwegbe, C. A. (2021, December). Regenerative desulphurisation of pyrolysis oil: A paradigm for the circular economy initiative. J. Environ. Chem., 9(6), 106864. https://doi.org/10.1016/j.jece.2021.106864
- İlkılıç, C., & Aydın, H. (2011). Fuel production from waste vehicle tires by catalytic pyrolysis and its application in a diesel engine. Fuel Process. Technol., 92(5), 1129–1135. https://doi.org/10.1016/j.fuproc.2011.01.009
- Jantaraksa, N., Prasassarakich, P., Reubroycharoen, P., & Hinchiranan, N. (2015). Cleaner alternative liquid fuels derived from the hydrodesulfurization of waste tire pyrolysis oil. Energ. Convers. Manag., 95, 424–434. https://doi.org/10.1016/j.enconman.2015.02.003
- Julião, D., Gomes, A. C., Pillinger, M., Lopes, A. D., Valença, R., Ribeiro, J. C., Gonçalves, I. S., & Balula, S. S. (2020). Desulfurization of diesel by extraction coupled with Mo-catalyzed sulfoxidation in polyethylene glycol-based deep eutectic solvents. J. Mol. Liq. 309, 113093. https://doi.org/10.1016/j.molliq.2020.113093
- M. Kozak, & J. Merkisz. (2005). The mechanics of fuel sulphur influence on exhaust emissions from Diesel engines. Teka Komisji Motoryzacji I Energetyki Rolnictwa, 05. http://yadda.icm.edu.pl/yadda/element/bwmeta1.element.agro-e00302a8-e19b-40a9-b0b0-a741b62f0773
- Liu, Q., & Zhang, X. (2022). Highly efficient separation of phenolic compounds from low-temperature coal tar by composite extractants with low viscosity. J. Mol. Liq., 360, 119417. https://doi.org/10.1016/j.molliq.2022.119417
- Liu, R., Dou, S., Yu, M., & Wang, R. (2017). Oxidative desulfurization of fuel oil catalyzed by magnetically recoverable nano-Fe 3 O 4 /SiO2 supported heteropoly compounds. J. Clean. Prod., 168, 1048–1058. https://doi.org/10.1016/j.jclepro.2017.09.097
- Muhammad Usman, K., Pam, G., & Kulla, D. (2013). Physico-Chemical Properties of Bio-diesel from Wild Grape Seeds Oil and Petro-Diesel Blends. Am. J. Eng. Res., 2, 291–297.
- Murugan, S., Ramaswamy, M. C., & Nagarajan, G. (2008). Performance, emission and combustion studies of a DI diesel engine using Distilled Tyre pyrolysis oil-diesel blends. Fuel Process. Technol., 89(2), 152–159. https://doi.org/10.1016/j.fuproc.2007.08.005
- Osayi, J. I., Iyuke, S., Daramola, M. O., Osifo, P., Van Der Walt, I. J., & Ogbeide, S. E. (2018, March 6). Evaluation of pyrolytic oil from used tires and natural rubber (Hevea brasiliensis). Chem. Eng. Commun., 205(6), 805–821. https://doi.org/10.1080/00986445.2017.1422493
- Perez, F. M., Gatti, M. N., Nichio, N. N., & Pompeo, F. (2022). Bio-additives from glycerol acetylation with acetic acid: Chemical equilibrium model. Results Eng., 15, 100502. https://doi.org/10.1016/j.rineng.2022.100502
- Quek, A., & Balasubramanian, R. (2013, May). Liquefaction of waste tires by pyrolysis for oil and chemicals—A review. J. Anal Appl Pyrolysis, 101, 1–16. https://doi.org/10.1016/j.jaap.2013.02.016
- Rang, H., Kann, J., & Oja, V. (2006). ADVANCES IN DESULFURIZATION RESEARCH OF LIQUID FUEL. Oil Shale, 23(2), 164. https://doi.org/10.3176/oil.2006.2.09
- Serefentse, R., Ruwona, W., Danha, G., & Muzenda, E. (2019). A review of the desulphurization methods used for pyrolysis oil. Procedia Manuf, 35, 762–768. https://doi.org/10.1016/j.promfg.2019.07.013
- Singh, R. K., Mondal, S., Ruj, B., Sadhukhan, A. K., & Gupta, P. (2019). Interaction of three categories of tyre waste during co-pyrolysis: Effect on product yield and quality. Joint Area Action Plan, 141(104618), 104618. https://doi.org/10.1016/j.jaap.2019.05.007
- Ss, R., M, M., & J, R. (2017). Biodesulfurization of Dibenzothiophene by Two Bacterial Strains in Cooperation with Fe3O4, ZnO and CuO Nanoparticles. J. Microb. Biochem, 09(02). https://doi.org/10.4172/1948-5948.1000346
- Tabinda, A. B., Arshed, F., Yasar, A., Afzaal, M., & Iqbal, A. (2019). Comparative analysis of desulphurization methods of tyre pyrolysis oil (TPO). Int. J. Eng. Res. Technol, 16(8), 4013–4018. https://doi.org/10.1007/s13762-018-1898-1
- Tahir, S., Qazi, U. Y., Naseem, Z., Tahir, N., Zahid, M., Javaid, R., & Shahid, I. (2021, December). Deep eutectic solvents as alternative green solvents for the efficient desulfurization of liquid fuel: A comprehensive review. Fuel, 305, 121502. https://doi.org/10.1016/j.fuel.2021.121502
- Tan, P., Xie, X.-Y., Liu, X.-Q., Pan, T., Gu, C., Chen, P.-F., Zhou, J.-Y., Pan, Y., & Sun, L.-B. (2017). Fabrication of magnetically responsive HKUST-1/Fe3O4 composites by dry gel conversion for deep desulfurization and denitrogenation. J. Hazard. Mater, 321, 344–352. https://doi.org/10.1016/j.jhazmat.2016.09.026
- Teoh, Y., Yaqoob, H., How, H., Le, T., & Nguyen, H. (2022, April). Comparative assessment of performance, emissions and combustion characteristics of tire pyrolysis oil-diesel and biodiesel-diesel blends in a common-rail direct injection engine. Fuel, 313, 123058. https://doi.org/10.1016/j.fuel.2021.123058
- Toteva, V., & Stanulov, K. (2019, December 23). Waste tires pyrolysis oil as a source of energy: Methods for refining. Prog. Rubber Plast. Recycl., 36(2), 143–158. https://doi.org/10.1177/1477760619895026
- Umeki, E. R., de Oliveira, C. F., Torres, R. B., & Santos, R. G. dos. (2016). Physico-chemistry properties of fuel blends composed of diesel and tire pyrolysis oil. Fuel 185, 236–242. https://doi.org/10.1016/j.fuel.2016.07.092
- Vihar, R., Seljak, T., Rodman Oprešnik, S., & Katrašnik, T. (2015). Combustion characteristics of tire pyrolysis oil in turbo charged compression ignition engine. Fuel 150, 226–235. https://doi.org/10.1016/j.fuel.2015.01.087
- Wang, M., Zhang, L., Li, A., Irfan, M., Du, Y., & Di, W. (2019). Comparative pyrolysis behaviors of tire tread and side wall from waste tire and characterization of the resulting chars. J. Environ. Manage, 232, 364–371. https://doi.org/10.1016/j.jenvman.2018.10.091
- Williams, P. T., Bottrill, R. P., & Cunliffe, A. M. (1998). Combustion of Tyre pyrolysis oil. Process Saf. Environ. Part B, 76(4), 291–301. https://doi.org/10.1205/095758298529650
- Ye, G., Gu, Y., Zhou, W., Xu, W., & Sun, Y. (2020, January 22). Synthesis of Defect-Rich Titanium Terephthalate with the Assistance of Acetic Acid for Room-Temperature Oxidative Desulfurization of Fuel Oil. ACS Catal, 10(3), 2384–2394. https://doi.org/10.1021/acscatal.9b04937
- Zhang, G., Chen, F., Zhang, Y., Zhao, L., Chen, J., Cao, L., Gao, J., & Xu, C. (2021). Properties and utilization of waste tire pyrolysis oil: A mini review. Fuel Process. Technol., 211, 106582. https://doi.org/10.1016/j.fuproc.2020.106582
- Zhong, Y., Xu, J., Pan, Y., Yin, Z., Wang, X., Zhou, Y., & Huang, Q. (2022, February). Combustion characteristics of aromatic-enriched oil droplets produced by pyrolyzing unrecyclable waste tire rubber. Fuel Process. Technol., 226, 107093. https://doi.org/10.1016/j.fuproc.2021.107093
supplemental files are in the availability of data and materials