Studies’ quality assessment and publication bias.
Simultaneously to the primary data extraction the risk of studies’ bias was evaluated as proposed by QUADS-2 tool (Table 1.). In case of 5 studies (55,56%) the risk of bias in the patients selection domain was assessed as high, due to case-control design (4 studies) and exclusion of patients without “confident clinical diagnosis”. Regarding the applicability in this domain we found control groups’ composition in 2 studies (22,23%) as bias-prone, since in two cases they comprised, to some extent, of acute pancreatitis and extra-pancreatic cases [29,31]. Normally acute pancreatitis is clinically easily distinguishable from PDAC, thus its enrollment to the control group doesn’t seem to be fully justified. In the other case the bias is attributed to the inclusion of the pancreatic neuroendocrine tumors in the cancer group [26]. Lastly, the study by Gu et al. [25] included exclusively PDAC patients undergoing chemotherapy. It was not stated clearly whether the sample taken for the diagnostic purposes was obtained before the commencement of chemotherapy in every case, thus we assessed the risk as unclear.
In the index test domain two studies have unclear bias risk, as the authors do not state clearly whether the test interpretation was “blinded” to the results of reference test. Additionally in one case the authors used two distinct assays to measure Ca125 levels [25-27]. In one case we assess the applicability of index test as low, since the authors used two different cut-off points for Ca125 [28].
In the remaining domains and applicability concerns we evaluated the bias risk as low.
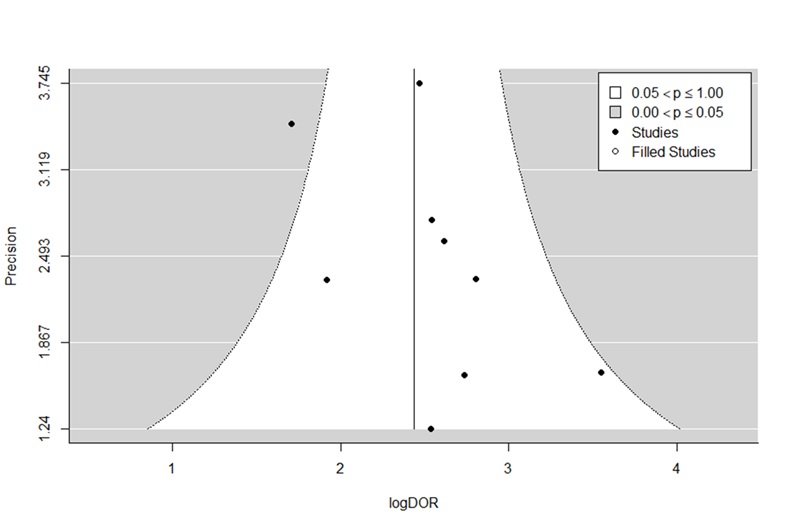
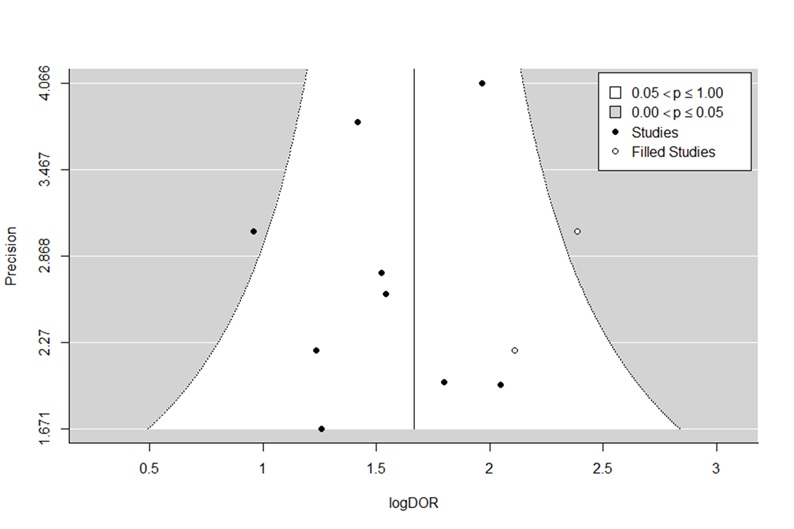
The funnel plots are shown in Supplementary Figure 1 and 2. The performed trim and fill method excluded the plot asymmetry for both biomarkers (p = 0,14 for CA19-9 and p = 0,11 for Ca125).
Meta-analysis
We identified 230 potential articles through various literature databases. After removing duplicates and irrelevant ones, 22 studies remained. These were screened by abstract and/or full-text for the eligibility. After reviewing them basing on our criteria, finally 9 studies were included to the meta-analysis [14, 25-32]. The detailed flow diagram is depicted in Figure 1.
The conducted meta-analysis included 4 European studies, 1 from the United States and 4 Asian studies. 5 studies were designed as cohort studies, while 4 of them had case-control design (Table 2). They included overall 1599 patients, of whom 975 had PDAC (61%), while the control group consisted of 624 patients (39%). 261 of them had chronic pancreatitis, 102 other benign pancreatic diseases/other benign diseases [25, 31], 77 acute pancreatitis, 50 cholelithiasis, 41 pancreatic cyst, 23 cholangiocarcinoma, 19 pancreatic pseudocyst, 10 pancreatic cystic neoplasm and 1 patient was diagnosed with pancreatic arteriovenous malformation. Furthermore one study enrolled 40 healthy patients [25].
The summary forest plots are shown in Figure 2. As depicted, the studies vary significantly regarding reported sensitivity and specificity for both CA19-9 and Ca125.
Additionally we calculated diagnostic odds ratio, positive and negative likelihood ratios for all included studies. The results are presented in the Table 3.
We then calculated hierarchical summary ROC for both biomarkers. The curves are shown in Figure 3.
The point estimate for CA19-9 has the following parameters:
Sensitivity: 0,748 [95%CI: 0,676-0,809]
Specificity: 0,782 [95%CI: 0,716-0,836]
Area Under Curve (AUC) was estimated for 0,832.
Using the calculated hsROC, we applied it to further calculate the mean DOR, PLR and NLR.
Diagnostic Odds Ratio: 10,9 (7,56-15,1)
Positive Likelihood Ratio: 3,46 (2,72-4,4)
Negative Likelihood Ratio: 0,324 (0,252-0,403)
These parameters have the following values for Ca125:
Sensitivity: 0,593 [95%CI: 0,489-0,69]
Specificity: 0,754 [95%CI: 0,678-0,817]
AUC: 0,739
Diagnostic Odds Ratio: 4,52 (3,41-5,88)
Positive Likelihood Ratio: 2,42 (2,01-2,92)
Negative Likelihood Ratio: 0,541 (0,441-0,641)
As shown in the curve comparison (Figure 3), the points of estimate are well separated, with only a few studies overlapping, suggesting that CA19-9 has indeed significantly better performance over Ca125. Nevertheless we aimed to elucidate the heterogeneity influence on the pooled diagnostic accuracy.
As suggested by others authors, Spearman correlation between sensitivity and false positive rate (fpr) was calculated. The Spearman rho was 0,545 and 0,764 for CA19-9 and Ca125, respectively, indicating a possible significant threshold effect for Ca125 (rho >= 0,7).
Heterogeneity analysis
To further explore the studies’ heterogeneity, we performed a meta-regression. We chose a priori the following factors as a possible sources of heterogeneity:
- Calculated cut-off point for Ca125 vs standard cut-off point
- Study location (Asia vs. Europe/USA)
- Study type (cohort vs. case-control studies)
- Publication year (before vs. after 2010)
- Method of biomarker assessment
- PDAC prevalence in the study population
As shown in Table 2, all the studies published before 2010 used a type of radioimmunoassay for the biomarkers’ assessment, thus studies’ split regarding points IV and V is same.
We did not found any statistically significant impact of study location, type, publication year (e.g. method of biomarker assessment) on sensitivity or specificity of Ca125 (Supplementary Table 1.). However, the built meta-regression model showed that studies with calculated cut-off point and higher PDAC prevalence ( >60%) tend to report higher sensitivity for Ca125 (p=0,021 and 0,04 respectively). To further assess the significance of these difference the likelihood-ratio test was performed, that concluded the differences between bivariate models (general parametric model vs. parametric model with a covariate) as insignificant (p= 0,153 and p = 0,2 respectively). Similarly, in the univariate subgroup analysis the calculated differences were insignificant. The pooled sensitivity and specificity for the studies estimating cut-off point value for Ca125 (n=3) were 0,696 (0,573-0,796) and 0,676 (0,53-0,794) respectively. For the studies without optimal cut-off point estimation, these values were 0,539 (0,432-0,642) and 0,784 (0,721-0,836) (p = 0,055 and 0,056 respectively).
Interestingly, the meta-regression for CA19-9 revealed that studies with a calculated cut-off point for Ca125 reported lower sensitivity for CA19-9 (p < 0,0001), while studies conducted in Europe/USA had significantly lower sensitivity and significantly higher specificity than the Asian ones (p = 0,032 and p = 0,038 respectively). Finally, the older studies (before 2010) were characterized by higher sensitivity (p = 0,016) (Supplementary Table 2.). However, the conducted likelihood-ratio test did not confirm the significance of the observed differences (p = 0,16, p = 0,2 and p = 0,075 respectively).
Systematic review of combined diagnostic tests
The designed tests are summarized in the Table 4. Apart from the study by Wang et al., all the reviewed articles proposed a combination test of Ca125 with the other measured biomarkers. Four older papers examined simple AND/OR formulae, that took into account CA19-9 and Ca125 levels. While the application of AND formula caused a significant increase in specificity of test with concomitant decrease of sensitivity, OR formula had an inverse impact on test’s parameters. Though maximalization of one parameter at cost of another might seem promising, in all cases, apart from the model from study by Sakamoto et al. (using AND formula), the accompanying decrease was greater than resulting increase, so that the proposed combinations didn’t outperformed the diagnostic accuracy of CA19-9. On the other hand three more recent studies used a logistic regression model. All the designed test succeeded in improving sensitivity over CA19-9. While the test constructed by Chan et al. managed to outperform CA19-9 sensitivity without any “loss” on specificity, both combination models devised in our department does it at the cost of significantly lower specificity.
The test reported by Gu et al. stands somewhat apart from the other combinations, as the reported joint detection of CA19-9, Ca125, CEA and CA242 should lead to increase of both sensitivity and specificity. Unfortunately, the authors did not provide any information about the mathematical rationale behind their test.