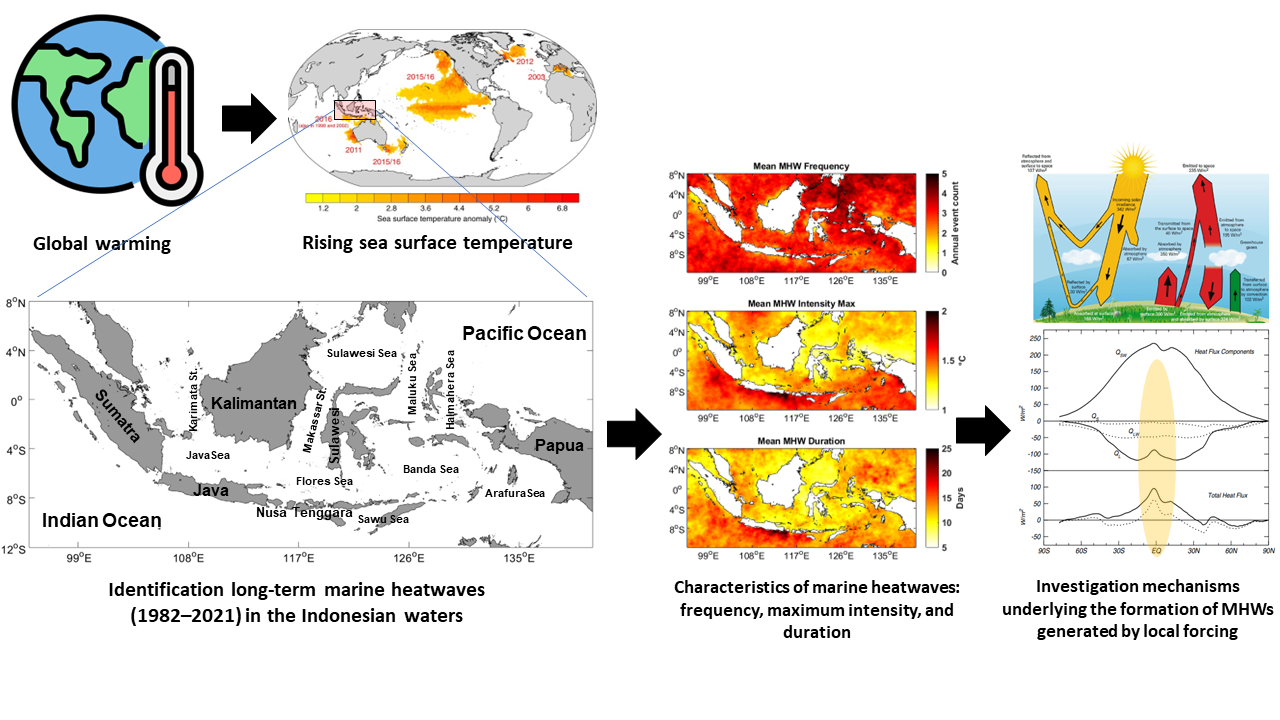
3.1 Characteristics of MHWs in the Indonesian waters
In this study, we examined the characteristics of MHWs based on its frequency value (Fig. 2a, b, c), maximum intensity (Fig. 2d, e, f), and duration of occurrence (Fig. 2g, h, i) during the last 40 years (1982–2021), 26 years (1982–2007; warm phase), and 14 years (2008–2021; cold phase). The average frequency (number of events) of MHWs over 40 years in Indonesian waters is dominated by two events per year (Fig. 2a). On average, the frequency of these MHWs decreases during the warm phase, i.e. only one event per year (Fig. 2b). However, in some coastal areas, such as western Sumatra, northern Kalimantan, and the coasts around Sulawesi and Papua, around 2–3 events were found in a year (Fig. 2b). Meanwhile, the average frequency of MHWs during the cold phase of PDO increased significantly to three events per year. We even found > 5 events per year in the northern territorial waters of Indonesian and around the Halmahera Sea, as shown in Fig. 2c.
We also analyzed the characteristics of the MHWs regarding their maximum intensity (Fig. 2d, e, f). The average maximum intensity of MHWs in Indonesian waters over 40 years is 1–1.5 ℃ (Fig. 2d). The highest (lowest) average maximum intensity of MHWs was found during the warm (cold) phase of PDO, as shown in Fig. 2e (2f). The three study periods, as mentioned before, showed similar highest average maximum intensity areas, which occurred in southern Java, reaching > 2 ℃ (Fig. 2d, e, f). In accordance to our study, a previous study showed that the average maximum intensity in southern Java from January 1982 to December 2019 reached > 1.8 ℃ (Iskandar et al. 2021). Interestingly, we found in the present study that the highest maximum intensity occurred during the warm phase of the PDO when El Niño dominated Indonesian waters (Fig. 2e).
In addition to the frequency and maximum intensity of MHWs, we also identified the duration of occurrences of MHWs (Fig. 2g, h, i). Over the last 40 years, the average duration of MHWs throughout Indonesian waters is 10 days (Fig. 2g). Meanwhile, the longest (shortest) duration of MHWs was found during the cold (warm) phase, as shown in Fig. 2i (2h). In the cold phase, the average duration of MHWs in the Indonesian waters varied between 15–20 days, with the most prolonged periods > 25 days occurring in southern Java (Fig. 2i). Whereas the average duration of MHWs is < 10 days during the warm phase of PDO (Fig. 2h).
Our findings suggested that the highest average frequency and duration (maximum intensity) of MHWs occurred during the cold (warm) phase of PDO. We suggested that the high frequency and long duration of MHWs during the last 14 years (2008–2021; cold phase) will result in increases of the ecological impacts in the following years. Some questions remained, including what are the factors influencing the maximum intensity of MHWs in the Indonesian waters? And what is the mechanism underlying the development of MHWs in these regions? We will further discuss these in Section 3.3 from the point of view of ocean-atmosphere interactions, particularly due to local forcing.
3.2 Linear trend of MHWs in the Indonesian waters
To quantify the effect of a long-term trend on the MHWs results, we identified the linear trend based on frequency (Fig. 3a, b, c), maximum intensity (Fig. 3d, e, f), and duration of occurrences (Fig. 3g, h, i), with areas of black dots representing increasing or decreasing events within the 95% confidence intervals. The frequency of MHWs has increased by 1–2 events per decade during the last 40 years (Fig. 3a), occuring in almost all Indonesian waters. Meanwhile, the warm and cold phases of PDO show an increase and decrease in frequency (Fig. 3b, c). For the three study periods, the result clearly reveals the most significant increase in frequency occurred during the cold phase, particularly in the northern territory of Indonesia waters, reaching > 4 events per decade (Fig. 3c) and we believe that this will continue to increase, partly due to global warming. Moreover, the linear trend of the maximum intensity of MHWs shows a negative value over the last 40 years (Fig. 3d), reaching − 0.2 ℃/decade, while the warm and cold phases showed a decrease and increase in the maximum intensity of MHWs ± 0.4 per decade (Fig. 3e, f).
We also examined the linear trend of the duration of MHWs (Fig. 3g, h, i). The average duration of MHWs was five days per decade for the last 40 years, as shown in Fig. 3g, but the linear trend of the duration showed a different pattern during warm and cold phases of PDO (Fig. 3h, i). The linear trend of the duration in the cold phase of PDO can reach > 10 days per decade (Fig. 3i), for example, in the southern Java to Nusa Tenggara and north of Maluku to Papua, whereas, during the warm phase of PDO, the linear trend of the duration is < 5 days per decade (Fig. 3h).
3.3 The formation of MHWs generated by local forcing
3.3.1 Net surface heat flux
The sea-atmosphere interactions in the Indonesian waters were indicated by the value of net surface heat flux, which has a positive value (Fig. 4a, b, c), which means that there is a heat transfer process from the atmosphere to the sea, which plays a role in ocean warming. Meanwhile, the negative value of the net surface heat flux, which occurred in the south of the equator of the Indian Ocean at 12°S, causes the opposite heat transfer from the sea to the atmosphere, thus playing a role in sea cooling. From the three periods of studies, there are differences in spatial characteristics between the western and eastern parts of Indonesian waters (Fig. 4a, b, c). This study found that the net surface heat flux is more significant in the east of Indonesia waters than in the western regions. The average net surface heat flux in the eastern region is > 80 W/m2 with some areas, such as the Sawu, Halmahera, and the Sulawesi Seas, reaching > 100 W/m2 (Fig. 4a, b, c). Meanwhile, the western regions have lower net surface heat flux, ranging from 0–40 W/m2, with negative values occurring at the end of the west of the Aceh waters (~ 5 W/m2) and the southern equatorial Indian Ocean (~ 20 W/m2) for the three study periods (Fig. 4a, b, c). The significant difference in net surface heat flux characteristics between the eastern and western regions is caused by the cloud cover factor. According to Wallace and Hobbs (2006), there is a smaller amount of total cloud cover in the eastern than western regions due to the influence of seasons. Furthermore, the rain and cloud cover pattern will constantly propagate from west to east areas, causing more cloud cover in the west regions. This phenomenon impacts the amount of solar radiation entering the sea, which is more limited in the west than in the eastern regions of the Indonesian waters.
From the three study periods, we found that the highest net surface heat flux occurs during the warm phase of PDO (Fig. 3b) when El Niño dominated Indonesian waters. During El Niño conditions, the western Pacific is cooler than normal, which may contribute to cooling in the Indonesian waters by advection. However, the maximum intensity of MHWs event in the Indonesian waters were most likely not driven by oceanic advection, but by air-sea heat flux into the ocean. In the El Niño phase, its atmospheric conditions can potentially reduce wind speed and cloud coverage, thus leading to increased net surface heat flux into the ocean, which plays a role in warming the ocean. This result was similar to the previous study documented by Haideman and Ribbe (2019), in which El Niño was impacting air-sea heat flux and the local atmosphere significantly, thus generating large MHWs in Queensland, Australia. In contrast, in this study we found that the net surface heat flux was negligible during the La Niña event.
3.3.2 Components of net surface heat flux
In this section, we will describe the role of net surface heat flux components on the maximum intensity of MHWs (Fig. 5). We found that among other components (LWR and SHF), contribution of LHF on the heat loss is the biggest (Fig. 5j, k, l), which results in the significant accumulation of net surface heat flux. The amount of LHF (heat loss) is smaller during the warm phase (Fig. 5k) than in the cold phase of PDO (Fig. 5l). The low evaporation events influenced the low cloud cover amount. The heat absorbed by the ocean is more significant during the warm phase. On the other hand, during the cold phase, a lot of evaporation occurred which generated more clouds. These conditions impact the solar heat radiation which is then reflected by the clouds which then reach the Earth's surface. This is followed by decrease of heat intensity in the ocean and plays a role in ocean cooling.
3.3.3 Interannual variations of MHWs
In this section, we continued our analysis on the interannual variations of MHWs based on IOD, ENSO, and neutral events during September to November (SON) in the period of 1982–2021. We will discuss only the SON in this section to eliminate seasonal variations to obtain a more accurate analysis of the maximum intensity of MHWs and its generating factor in terms of the role of the atmosphere. We selected the SON season based on the DMI and ONI, as shown in Fig. 6, which shows the strongest values compared to other seasons. Details of the classification of the year when IOD, ENSO, and neutral events occurred during SON 1982 to 2021 period, can be seen in Table 1.
Table 1. IOD, ENSO, and neutral events during the SON 1982–2021 period.
|
|
pIOD
|
Neutral
|
nIOD
|
|
El-Niño
|
1997
|
2015
|
-
|
|
Neutral
|
2019
|
1990, 2013
|
1996
|
|
La-Niña
|
-
|
1988
|
1998
|
3.3.4 The maximum intensity of MHWs during SON in the period of 1982–2021
We analyzed the maximum intensity of MHWs in the Indonesian waters in SON 1988 when the La Niña event occurred (Fig. 7a, left column). The maximum intensity variates between 0–2 ℃ in the inner seas, whereas some areas in the outer seas can reach > 2.5 ℃. The lowest maximum intensity mainly occurred in eastern Indonesian waters, such as Halmahera, Banda, Arafura, and western Sumatra (Fig. 7a, left column). In SON 1990, during the neutral event (no IOD and or ENSO phases), the maximum intensity is greater than the La Niña event, with the average maximum intensity ranging 1–2 ℃ and can reach > 2.5 ℃, especially in the eastern Indonesian waters (Fig. 7a, middle column). Further analysis was on the maximum intensity of MHWs in SON 1996 when the nIOD event happened (Fig. 7a, right column). The maximum intensity characteristics in this period were different from the La Niña event. The lowest value occurred in the southern regions (e.g. the northern and southern waters of Java, Flores Sea, and around the Nusa Tenggara waters), with the average maximum intensity near zero (Fig. 7a, right column).
The El Niño event that occurred at SON 2015 (Fig. 9a, left column), is one of the key drivers of maximum intensity MHWs in the eastern Indonesian waters. The result of the research showed that the high maximum intensity reaching > 1 ℃ occurred in almost all eastern Indonesian waters. Moreover, some areas have the highest maximum intensity, reaching > 2.5 ℃, such as in Sulawesi, Molucca/Maluku, and the Arafura Sea (Fig. 9a, left column). The high maximum intensity was also found on the coasts of southern Java and Kalimantan (Fig. 9a, left column). On the other hand, the pIOD drives the maximum intensity of MHWs in western Indonesian waters (Fig. 9a, right column). Evenmore, this can reach > 3.0 ℃ along the west coast of Sumatra to southern Java (Fig. 9a, right column). This value was the most fantastic compared to the other phases (El Niño, La Niña, and nIOD).
In detail, we also observed the maximum intensity of MHWs when the IOD and ENSO phases attenuate and strengthen each other. In the previous explanation, El Niño (pIOD) significantly impacted the maximum intensity of MHWs in eastern (western) Indonesian waters than La Niña (nIOD) event. The highest maximum intensity of all phases was found during El Niño and pIOD phases, i.e. in SON 1997 (Fig. 8a, left column), reaching > 3.0 ℃ in almost all of the Indonesian waters (e.g. along the west coast of Sumatra to southern Java, the west coast of Kalimantan, Banda, and the Arafura Sea; as shown in Fig. 8a, left column). In contrast, the lowest maximum intensity of all phases was found when La Niña was happening simultaneously with nIOD in SON 1998 (Fig. 8a, middle column). Most of the maximum intensity in the Indonesian waters was almost zero, with some areas showing values of ~ 1.0 ℃ (Fig. 8a, middle column). This condition has the similiar characteristic as the neutral condition in SON 2013 (Fig. 8a, right column) with the maximum intensity of MHWs ranging 0 to 1 ℃ in almost all Indonesian waters.
Moreover, this study found similar patterns between the maximum intensity of MHWs and the net surface heat flux in the Indonesian waters (Figs. 7,8,9). The most dominant contribution of net surface heat flux comes from high SWR as heat gain and low LHF through the evaporation process as heat loss, thus keeping the ocean warm. For all phases, the result showed that high SWR occurred in the southern regions, reaching > 300 W/m2 (Figs. 7,8,9c). This condition corresponds to the position of the sun in the south of the equator during the SON season. Additionally, the amount of total cloud cover in the southern regions was the lowest compared to the northern regions in all phases. It makes the amount of SWR absorbed by the ocean become more significant because it is not reflected by the atmosphere, particularly by the cloud cover (Figs. 7,8,9h).