Sampling and sample collection
A total of 60 fish samples (three fish per sample) were conveniently bought from the five administrative districts of Dar es Salaam (Temeke, Ubungo, Kigamboni, Ilala, and Kinondoni). A simulated buyer approach was used to purchase the samples from three sources (supermarkets, local markets, and street vendors) within each district. Four samples were independently collected from each source at an interval of five days. Moreover, one control sample consisting of freshly harvested mackerel was purchased directly from the seashore and used as a blank for the natural matrix setting upon analysis.
Determination of freshness by organoleptic characteristics
An adopted, subjective method that evaluates the freshness-defining organoleptic characteristics of fish was used (Howgate 2011; Patterson et al. 2014). The evaluated characteristics included the odor of the neck, odor, and color of the gills, the general appearance of the fish, slime on the skin and eyes as well as texture of the fish. At least two blinded observers (with no special training) were required to score a given sample for each parameter on a scale of 1 to 5, where 1 was the best score. The overall grade of freshness was obtained as the mean of the scores for each parameter. The freshness was established as excellent (1<2), acceptable/good (2<5), and rejected (5).
Detection and quantification of formalin
Reagents, chemicals, and solvents.
These included; formalin (Merck, Germany), 2,4-dinitrophenylhydrazine (DNPH) (Carlo Erba Reagent group, Spain), Acetonitrile (Sigma Aldrich, USA), and double-distilled water.
Chromatographic conditions
High-Performance Liquid Chromatography (Merck Hitachi Model D- 70001F, Japan) (HPLC) analyses were carried out on an extended C-18 (150 mm x 2.1 mm, 1.5 µm) column (YMC, Japan) as a stationary phase and a mixture of acetonitrile and water (60:40 %v/v) as the mobile phase at isocratic conditions. The mobile phase flow rate of 1 mL/min was used and detection was done at 365 nm using an ultraviolet (UV) diode array detector. Moreover, the samples were injected at a volume of 20 µL and the column oven temperature was set at 40 ºC.
Preparation of the derivatizing agent
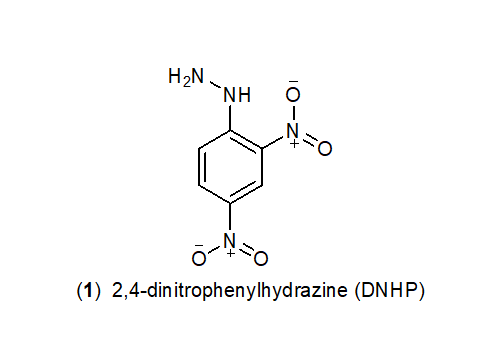
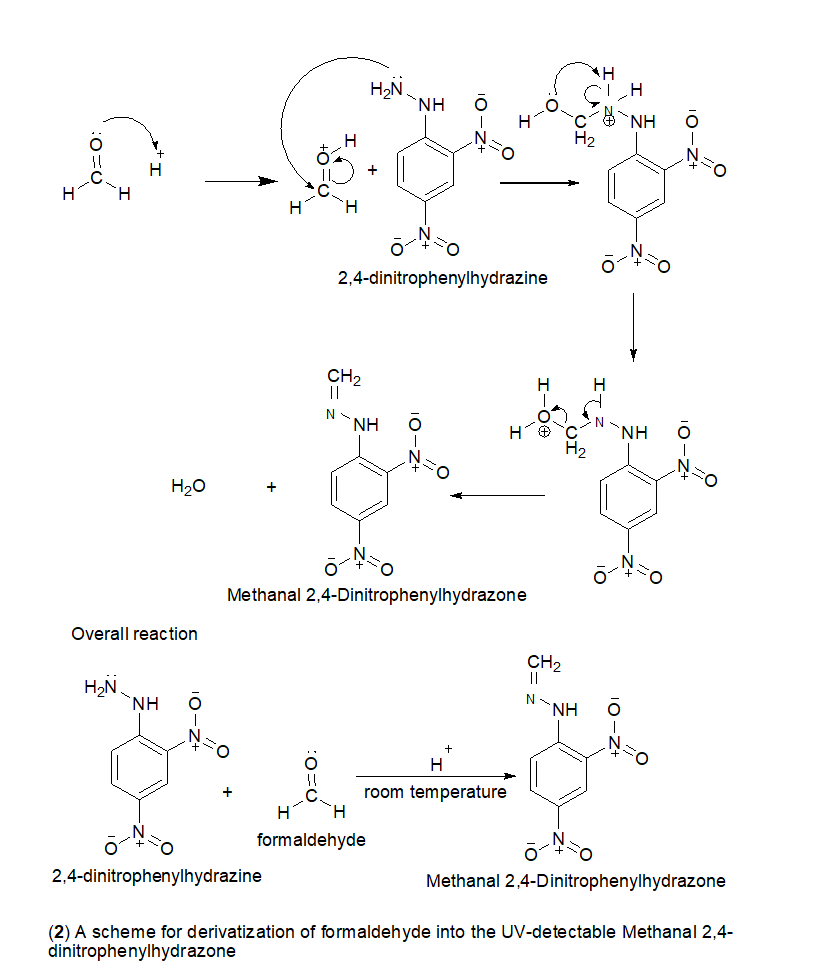
2,4-dinitrophenyl hydrazine (DNPH) (1) was used to derivatize formaldehyde to enable its detection and quantification in the UV region. In this regard, formaldehyde was converted into a UV- active hydrazone. The derivatizing solution was prepared by dissolving 1.5 g of DNPH crystals in 50 mL of a 20% sulphuric acid solution. In every occasion, this solution was freshly prepared and immediately used (Bhowmik et al. 2017).
Fish sample preparation
For each sample, the skins, fins, and bones were removed from the flesh of the three fish by using a scalpel. The resulting fillets were minced, blended, and homogenized together in an electric blender (Europe strong ES2255, Germany). Five grams of the homogenized flesh were weighed using an analytical balance (Mettler Toledo ML204, Switzerland), and put in a 50mls conical flask, followed by the addition of 5 mL of distilled water. The flask was then capped and sonicated for 40 minutes at 20 ºC followed by centrifugation (HERMLE Labortechnik Z206A, Germany) at 7000 rpm for 10 minutes.
The resulting supernatant was filtered (Whatman no. 1) before drawing 2 mL of the filtrate into another 50 mL conical flask into which, 1 mL of the freshly prepared DNPH solution was added. The flask was thereafter left in dark for 6 hours at room temperature to allow the formation of orange hydrazone precipitate (2). The precipitate was captured using a membrane filter (0.45 µm) and dissolved in 2 mL of acetonitrile. The formed solution was re-filtered through a similar membrane filter to remove any undissolved particles before HPLC injections (Bhowmik et al. 2017; Yeh et al. 2013).
Method validation
The adopted analytical method (Bhowmik et al. 2017), was partially validated for linearity, accuracy, the limit of detection, the limit of quantification, as well as precision. Validation was guided by the bioanalytical method validation protocol by the United States Food and Drug Administration (FDA) (FDA 2018) as follows.
Linearity
Preparation of standard calibration curve.
Linearity was evaluated by using a matrix-based calibration standard. This was established by preparing seven known concentrations of formaldehyde spiked on the homogenized control fish sample. Seven concentrations were obtained from a prepared stock solution of 400 mg/L formaldehyde. The range of concentrations included the Lower limit of quantification (LLOQ) and the upper limit of quantification (ULOQ). Three injections were made at each concentration. For acceptance, the coefficient of variation (CV) of at least four concentrations should have not deviated by more than 15% except at the LLOQ which should have not deviated by more than 20%.
Precision
Inter –Day precision was carried out using six determinations per concentration. Three concentrations of Quality Control samples (QCs) were used and included the lowest concentration which was three times the LLOQ (7.5 mg/L). The others were the mid-range concentration which corresponded to 50% of the ULOQ (45 mg/L) and the highest concentration which corresponded to 75% of the ULOQ (68 mg/L). The acceptance criterion was the coefficient of variation not to exceed 15% at each concentration.
Accuracy
The accuracy of the method was established by determining the mean recovery of three spiked concentrations of formaldehyde in a homogenized control sample. Similar concentration levels were used for the precision above, and six determinations were carried out per concentration. For acceptance, the mean value had to be within 15% of the nominal value.
Limit of detection and limit of quantification
From the matrix-based calibration curve, the slope and peak area was used to obtain the limit of detection and the limit of quantitation.
Statistical Analyses
Analysis of Variance (ANOVA) of formaldehyde in mackerel based on the sources, followed by Tukey’s Honest Significance test, were computed using the Statistical Package for Social Sciences (IBM SPSS Statistics 20).