CXC Chemokine expression status in patients with BLCA
ONCOMINE database analysis allowed us to analyze the mRNA expression levels of 16 CXC chemokines (CXCL1 to CXCL14, CXCL16 and CXCL17) in BLCA and normal bladder mucosa tissues. Table 1 and Fig. 1 show the results. ONCOMINE data demonstrated the mRNA expression levels of CXCL13, CXCL10, CXCL9, and CXCL6 increased significantly and those of CXCL2, CXCL3, and CXCL12 decreased significantly in BLCA tissues compared with those in normal bladder mucosa tissues. This agreed with the results of Sanchez-Carbayo et al., who reported significantly increased mRNA levels of CXCL13, CXCL10, CXCL9, and CXCL6 in infiltrating bladder urothelial carcinoma and obviously decreased mRNA levels of CXCL2, CXCL3, and CXCL12 in superficial bladder cancer [38]. Lee et al. observed lower CXCL12 expression was in superficial bladder cancer (fold change = −4.495 and p = 2.52 e−21) and infiltrating bladder urothelial carcinoma (fold change = −3.371 and p = 1.41 e−12) compared with that in normal bladder mucosa [39].
Table 1
The mRNA levels of CXC chemokines with differential expression in BLCA tissues and normal bladder mucosa tissues (ONCOMINE).
|
TLR
|
Type
|
Fold change
|
P-value
|
t-test
|
References
|
|
CXCL2
|
Superficial Bladder Cancer
|
-12.716
|
7.74E-17
|
-11.618
|
(38)
|
|
CXCL3
|
Superficial Bladder Cancer
|
-3.564
|
2.44E-08
|
-6.122
|
(38)
|
|
CXCL6
|
Infiltrating Bladder Urothelial Carcinoma
|
2.272
|
1.34E-06
|
5.02
|
(38)
|
|
CXCL9
|
Infiltrating Bladder Urothelial Carcinoma
|
2.84
|
3.92E-09
|
6.197
|
(38)
|
|
CXCL10
|
Infiltrating Bladder Urothelial Carcinoma
|
3.039
|
6.79E-11
|
7.04
|
(38)
|
|
CXCL12
|
Superficial Bladder Cancer
|
-4.495
|
2.52E-21
|
-12.211
|
(39)
|
| |
Infiltrating Bladder Urothelial Carcinoma
|
-3.371
|
1.41E-12
|
-7.727
|
(39)
|
| |
Superficial Bladder Cancer
|
-2.531
|
1.92E-12
|
-8.846
|
(38)
|
|
CXCL13
|
Infiltrating Bladder Urothelial Carcinoma
|
6.369
|
1.07E-10
|
7.171
|
(38)
|
Next, we used UALCAN to evaluate the mRNA expression levels of CXC chemokines in BLCA and normal bladder mucosa tissues, which showed markedly increased mRNA expression of CXCL1 (p = 8.50e − 03), CXCL5 (p = 1.12e − 06), CXCL7 (p = 1.42e − 02), CXCL9 (p = 4.06e − 08), CXCL10 (p = 3.91e − 09), CXCL11 (p = 6.29e − 08), CXCL16 (p = 1.44e − 03), and CXCL17 (p = 3.56e − 02) in BLCA tissues, and significantly decreased mRNA levels of CXCL2 (p = 2.30e − 02) and CXCL12 (p = 2.82e − 04) (Fig. 2). We also revealed that CXC17 had the highest mRNA expression level in BLCA tissues based on the TCGA database (Fig. 3). To investigate the role of the CXC chemokines in BLCA more comprehensively, including tumorigenesis and clinical prognosis, we assessed all the differentially expressed CXC chemokines that were acquired by the Oncomine and TCGA databases including CXCL1, CXCL2, CXCL3, CXCL5, CXCL6, CXCL7, CXCL9, CXCL10, CXCL11, CXCL12, CXCL13, CXCL16, and CXCL17.
CXC Prognostic Significance in patients with BLCA
Next, we evaluated the relationship between the pathological stage of patients with BLCA and the differentially expressed CXC chemokines. We observed a significant association between CXCL2 (p = 0.0127) and CXCL12 (p = 8.68e − 07) expression and pathological stage (Fig. 4). CXCL2 and CXCL12 mRNA expression levels were higher in more advanced pathological stages, indicating that they might associated with BLCA tumorigenesis. Meanwhile, GEPIA was used to assess the impact of differentially expressed CXC chemokines on clinical outcome. Patients with BLCA with high CXCL2 (p = 0.17), CXCL16 (p = 0.14), and CXCL13 (p = 0.12) mRNA expression had a statistical tendency towards longer disease-free survival (Fig. 5). In addition, high mRNA levels of CXCL1 (p = 0.17) and CXCL12 (p = 0.0075) had a statistical tendency towards shorter overall survival (Fig. 5).
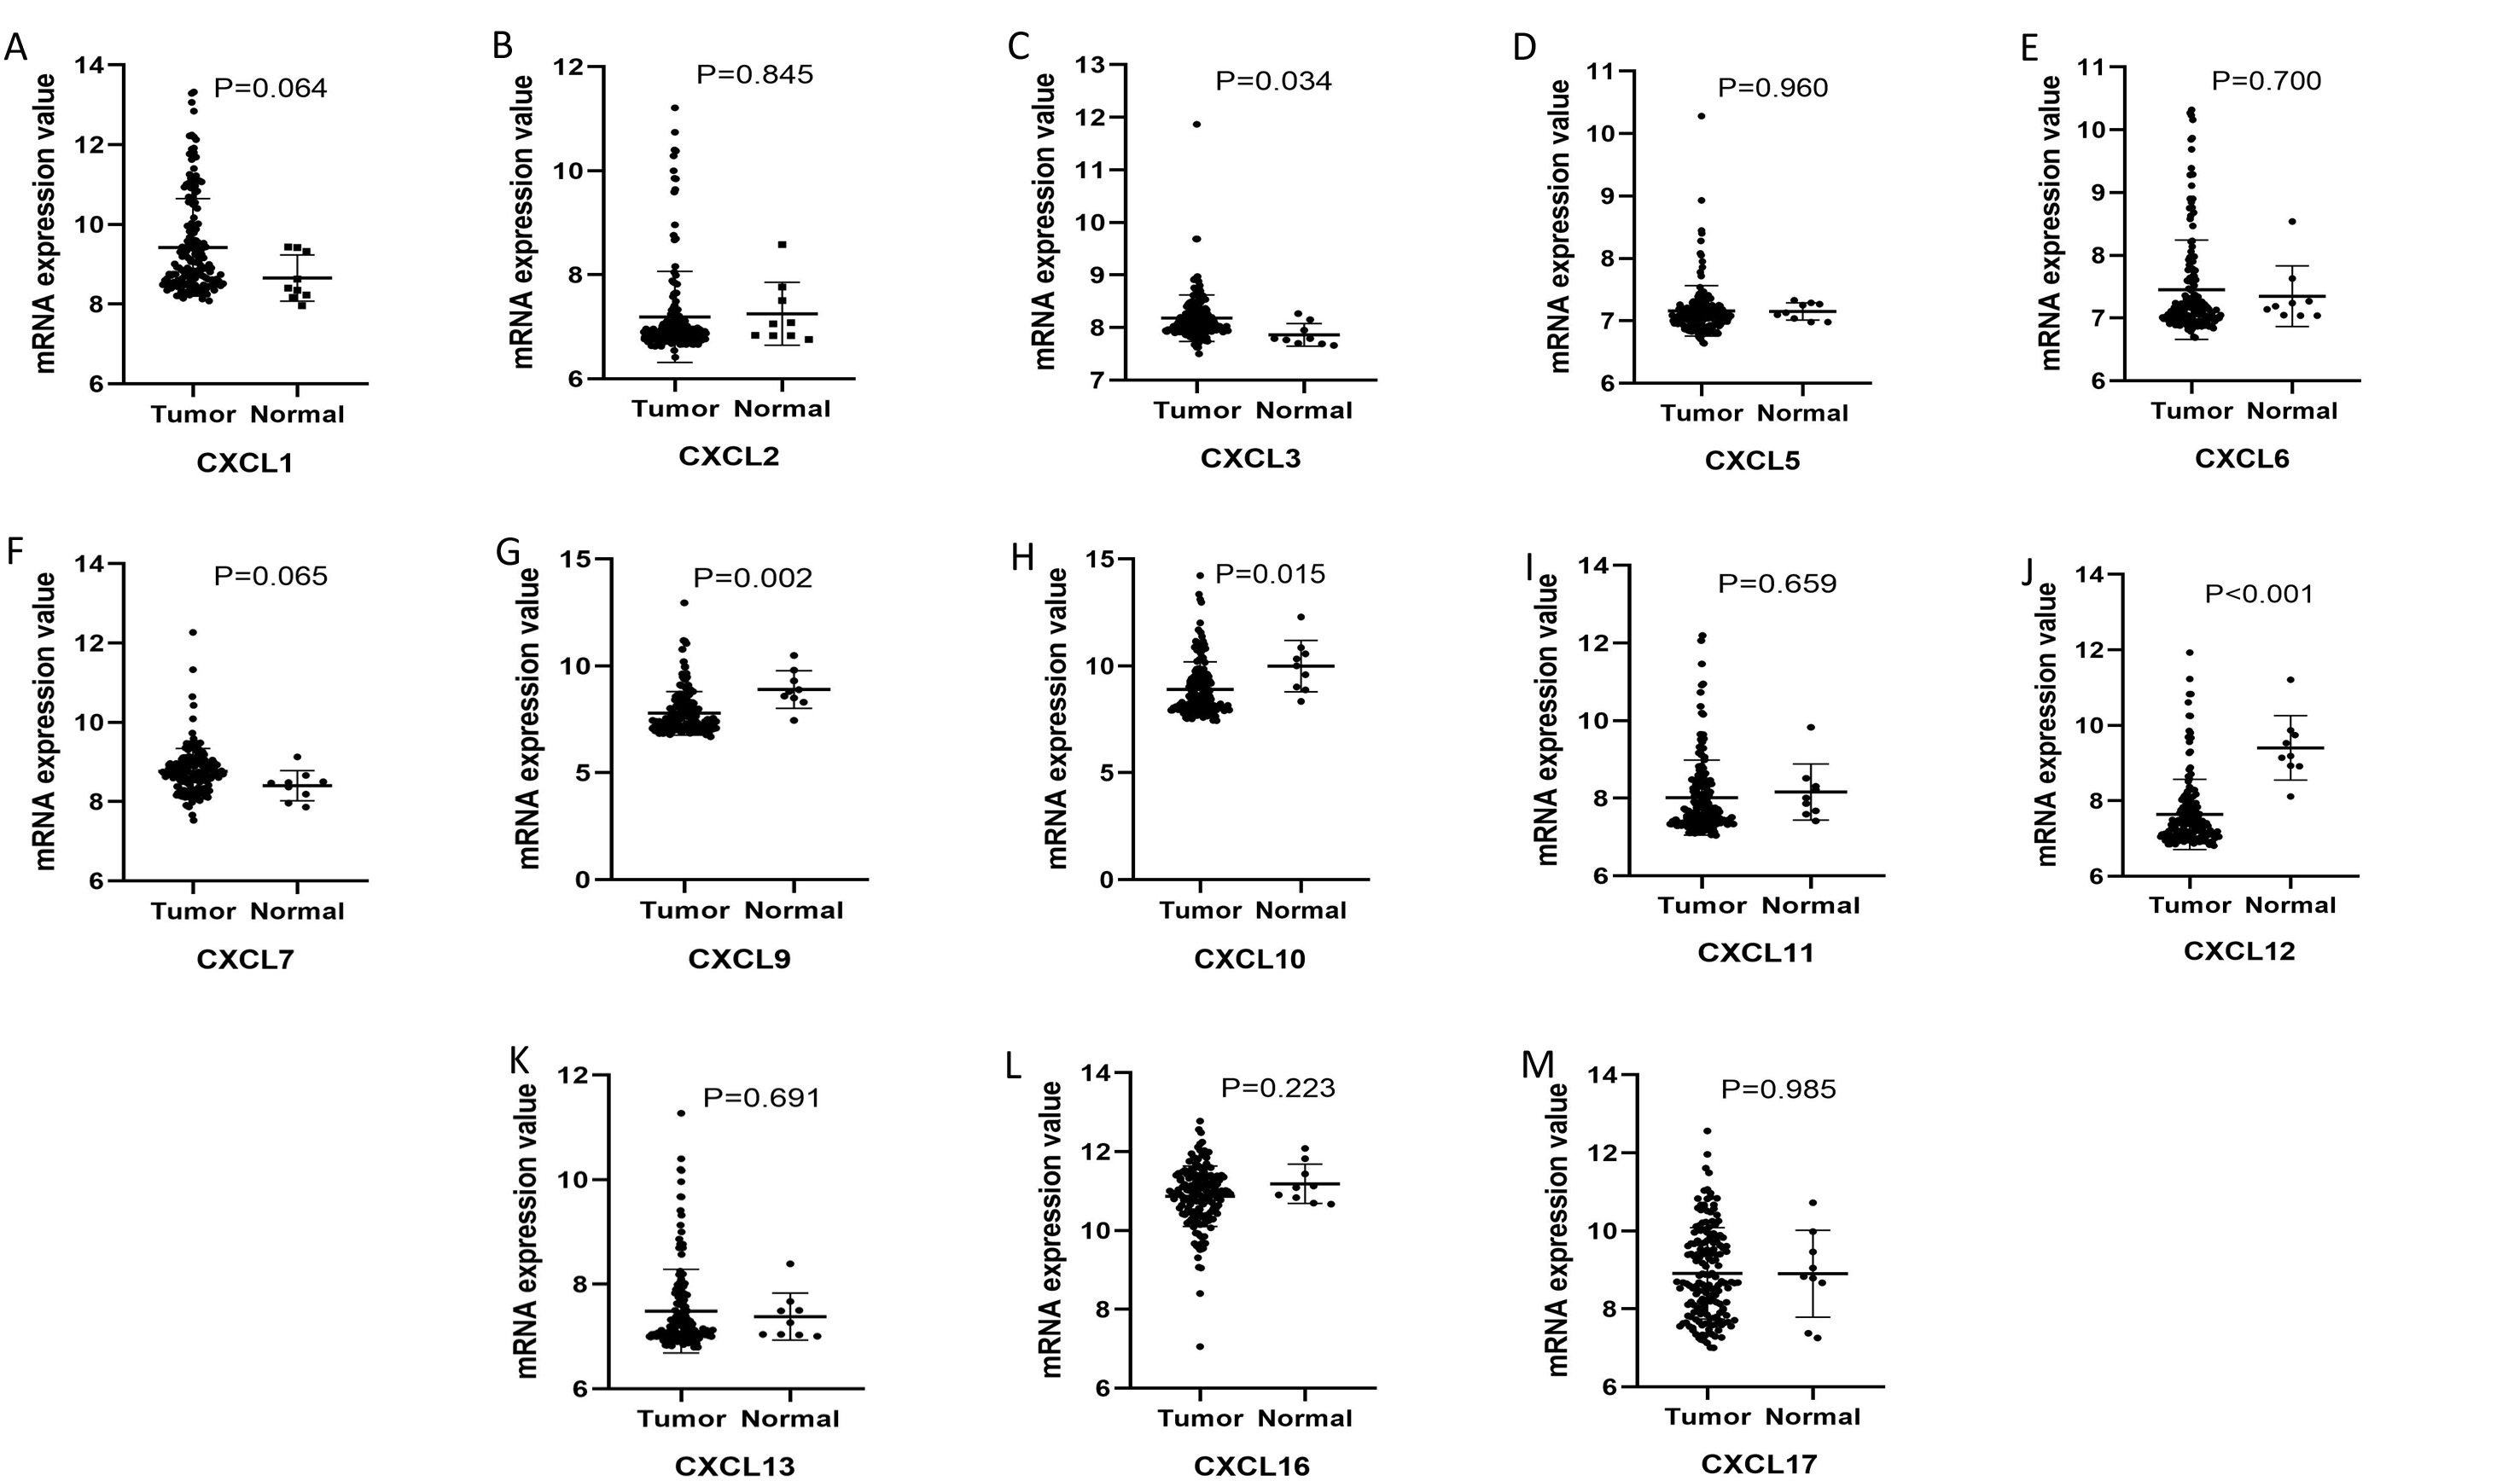
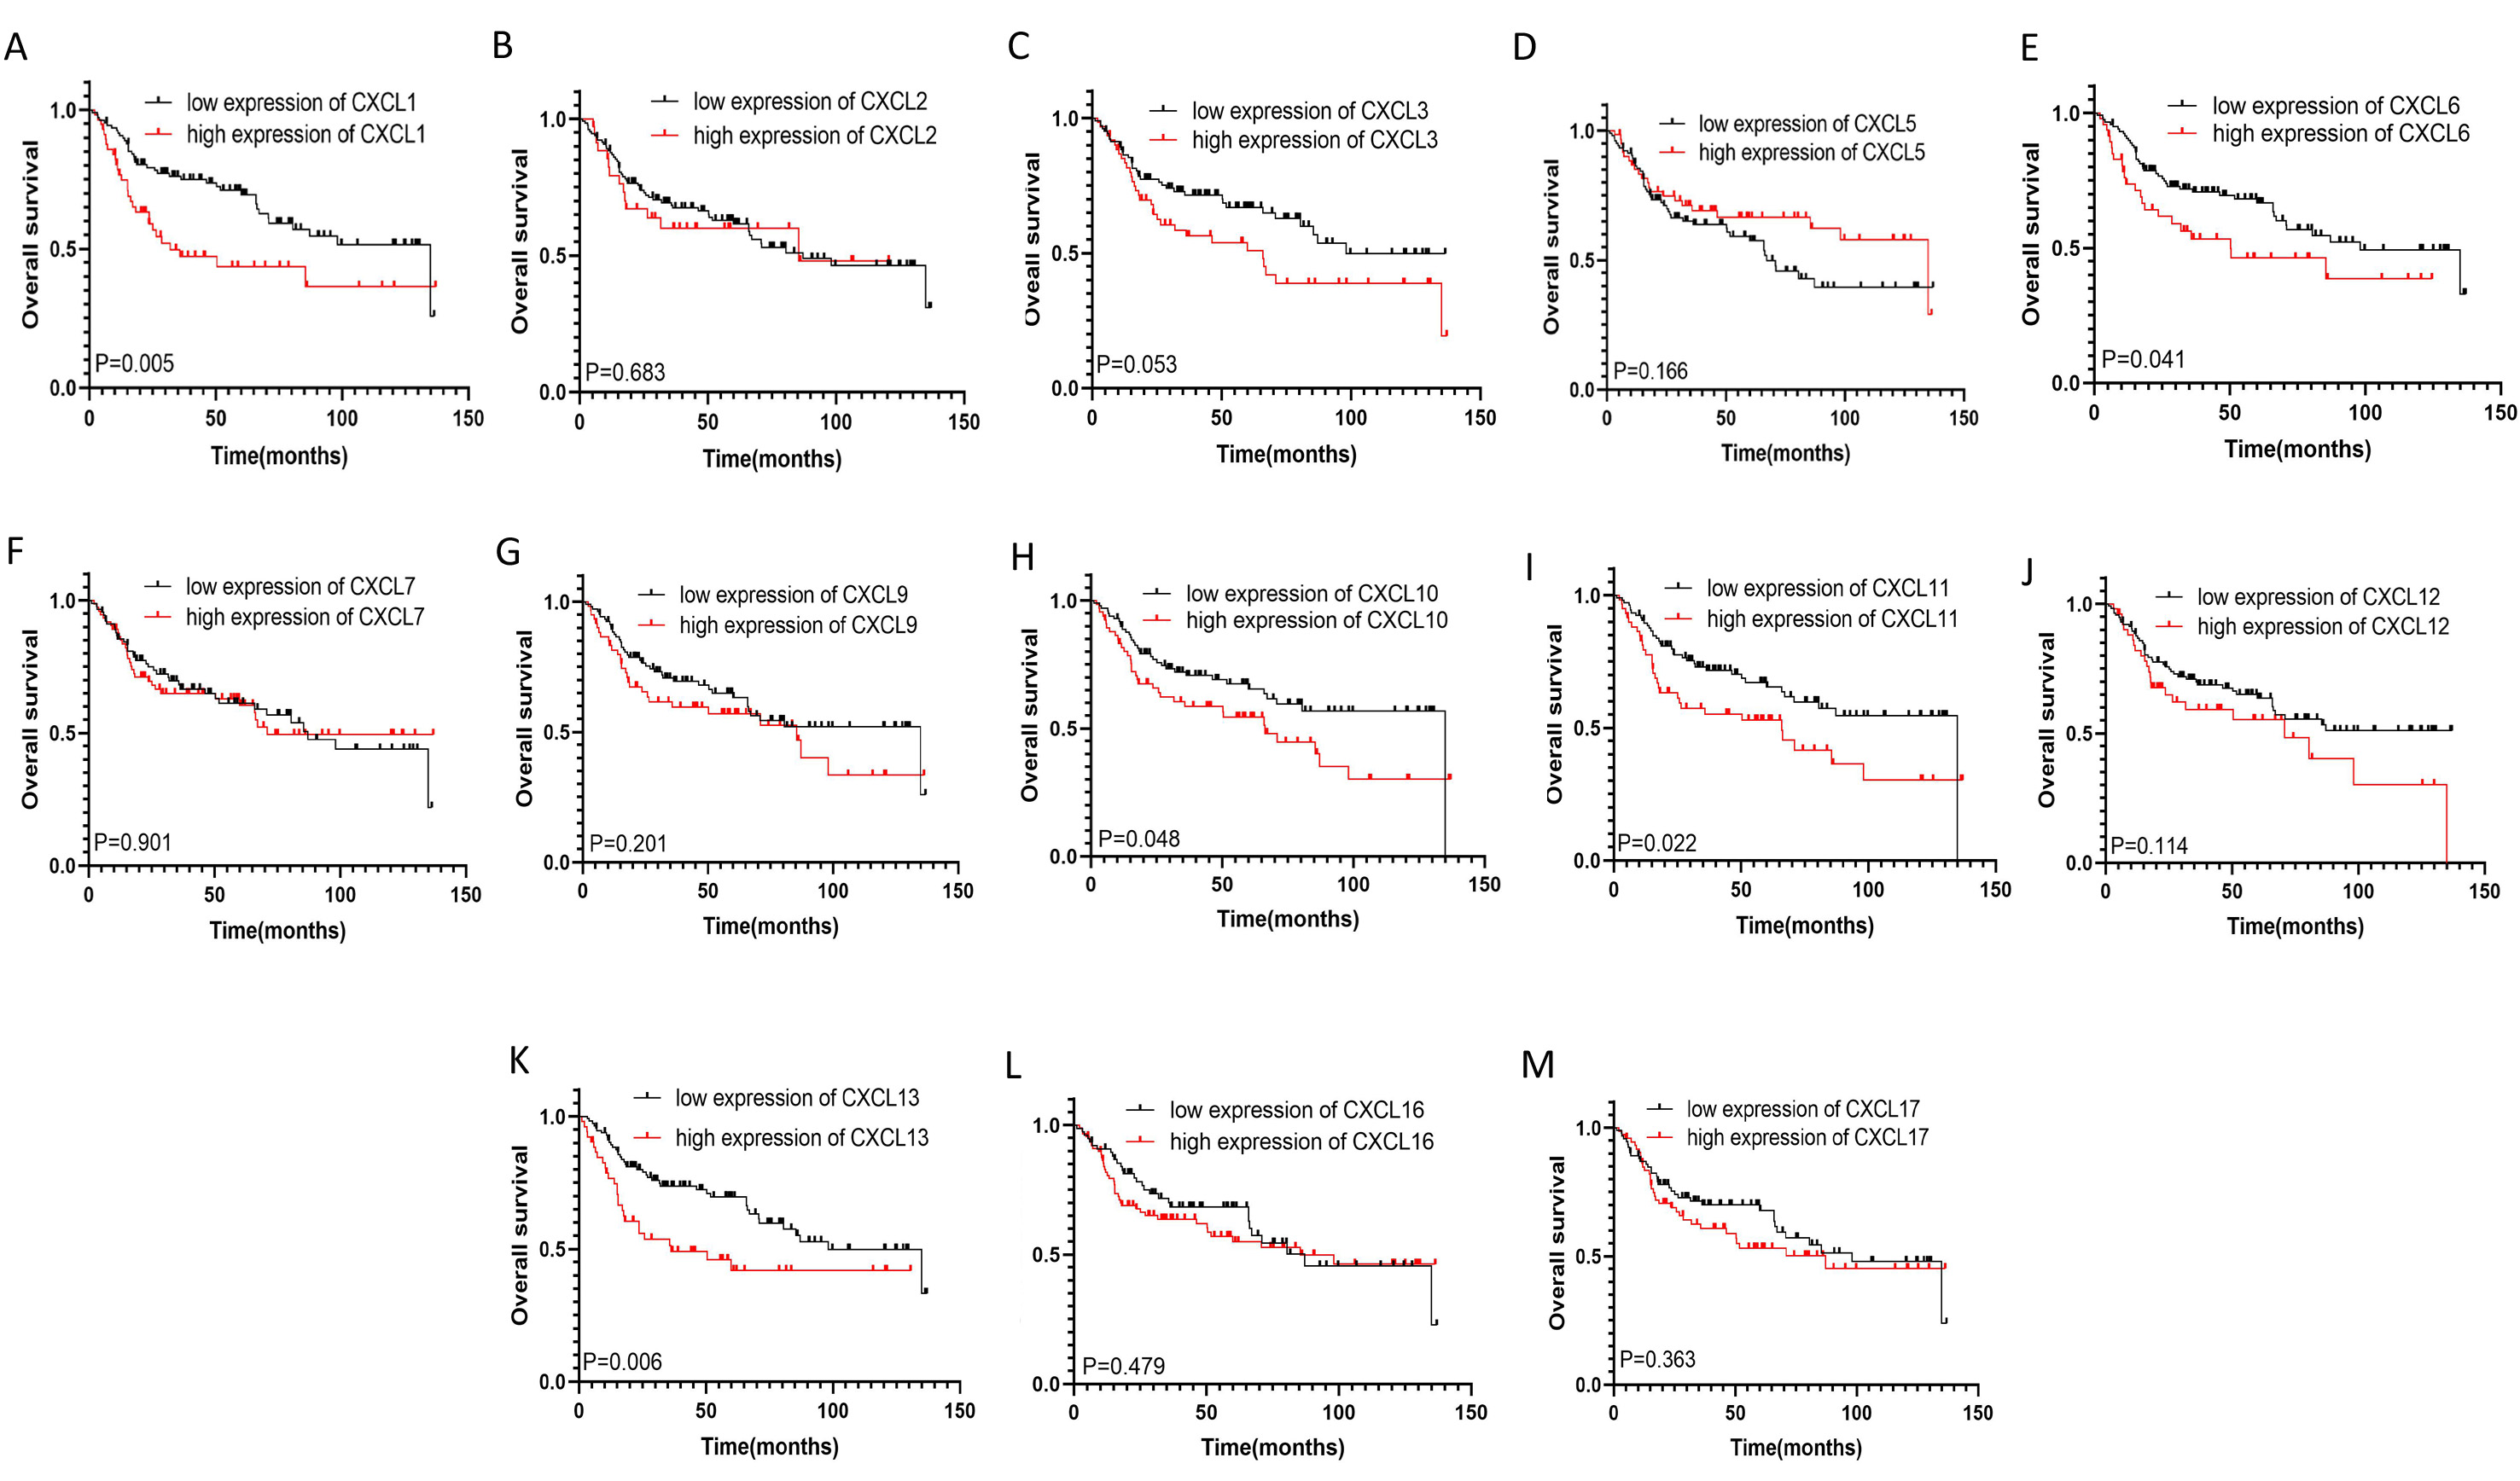
GEO database analysis demonstrated that CXCL3 mRNA expression (p = 0.034) was higher in BLCA tissues than in normal tissues. CXCL12 (p < 0.001), CXCL9 (p = 0.002), and CXCL10 (p = 0.015 mRNA expression levels were higher in normal tissues than in BLCA tissues (Supplementary Fig. 1). Survival analysis showed that high levels of CXCL1, CXCL6, CXCL10, CXCL11, and CXCL13 mRNA expression were associated significantly with the poor overall survival (all p < 0.05). High levels of CXCL3 mRNA had the statistic tendency towards predicting shorter overall survival (p = 0.053) (Supplementary Fig. 2).
CXC Chemokine Interaction Analyses, Neighbor Gene Network, Co-expression, and Genetic Alteration in patients with BLCA
We analyzed comprehensively the molecular characteristics of the differentially expressed CXC chemokines. First, we used TCGA datasets to analyze their genetic alterations, which showed the rates of genetic alteration of CXCL1, CXCL2, CXCL3, CXCL5, CXCL6, CXCL7, CXCL9, CXCL10, CXCL11, CXCL12, CXCL13, CXCL16, and CXCL17 were 6, 5, 4, 5, 5, 4, 5, 6, 5, 2.7, 3, 5, and 11%, respectively in the BLCA samples queried (Fig. 7A). In the BLCA samples, the most common alterations were amplification and high mRNA expression. Differentially expressed CXC chemokine coexpression analysis identified strong correlations among CXCL9, CXCL10, and CXCL11 expression; moderate to strong correlations among CXCL1, CXCL2, CXCL3, CXCL5, and CXCL6; and weak to moderate correlations among CXCL7, CXCL12, CXCL13, CXCL16, and CXCL17 expression (Fig. 7B). Secondly, PPI network analysis with STRING obtained 13 nodes and 71 edges in the analysis of the interactions among the differentially expressed CXC chemokines (Fig. 7D). Enrichment pathways identified in STRING for these CXC chemokines included the TNF signaling pathway, the IL-17 signaling pathway, cytokine-cytokine receptor interactions, and the chemokine signaling pathway. The results of analysis at GeneMANIA revealed that their functions were related to chemokine receptor binding, cell chemotaxis, and chemokine activity (Fig. 7E).
In addition, the top 50 mutated genes of 200 most mutated cases with BLCA were identified using cBioPortal (Fig. 7C), representing mutations in which lead to the formation of a tumor-associated antigen that is associated with the TME and is closely associated with the CXC chemokines. Next, we analyzed the associations of these mutated genes and the CXC chemokines. These top 50 mutated genes have close interactions with the differentially expressed CXC chemokines in BLCA (Fig. 7F).
Functional Enrichment Analysis of CXC Chemokines in Patients with BLCA
The functions of differentially expressed CXC chemokines and the top 50 mutated genes in BLCA were analyzed by DAVID6.8 and Metascape. The top 10 GO enriched terms in the biological process (BP), cellular component (CC), and molecular function (MF) categories were analyzed using DAVID 6.8. Chemokine-mediated signaling pathway, positive regulation of leukocyte chemotaxis, response to lipopolysaccharide, regulation of cell proliferation, inflammatory response, immune response, positive regulation of cAMP metabolic process, and cell-cell signaling were related to the development and progression of BLCA (Fig. 8A). The top 10 GO terms in the CC category included, Z disc, sarcolemma, extracellular space, sarcoplasmic reticulum membrane, sarcoplasmic reticulum, extracellular region, T-tubule, MLL3/4 complex, costamere, and histone methyltransferase complex (Fig. 8B). Chemokine activity and CXCR chemokine receptor binding were the two most significantly enriched GO terms in the MF category (Fig. 8C). The top 10 KEGG pathways were the chemokine signaling pathway, cytokine-cytokine receptor interaction, cell cycle, the TNF signaling pathway, and microRNAs in cancer, HIF-1 signaling pathway, pathways in cancer, viral carcinogenesis, central carbon metabolism in cancer, which were intimately associated with BLCA tumorigenesis (Fig. 8D).
Metascape analysis showed that the functions of the differentially expressed CXC chemokines and top 50 mutated genes in BLCA were predominantly enriched in chemokine receptor bind chemokines, T cell chemotaxis, and microRNAs in cancer (Fig. 9A, B). Next, we extracted protein-protein interaction (PPI) and MCODE components to explore the correlations between BLCA and CXC chemokines in detail; the list of identified genes is shown in Fig. 9C, D. Three most significant MCODE components were obtained and showed that the biological functions were involved in chemokine receptor binding to chemokines, chemokine-mediated signaling pathways, chemokine signaling pathways, activation of homeobox (HOX) genes during differentiation, and histone modification (Fig. 9E).
MiRNA Targets, Kinase Targets, and Transcription Factor Targets of CXC chemokines in patients with BLCA
Next, we investigated the transcription factor and kinase targets of the differentially expressed chemokines by analyses in the TRRUST and LinkedOmics databases. TRRUST analysis of CXCL1, CXCL2, CXCL5, CXCL7, CXCL10, and CXCL12 identified three transcription factors: Sp1 transcription factor (SP1), nuclear factor kappa B subunit 1 (NFKB1), and RELA proto-oncogene, NF-KB subunit (RELA) that were possibly related CXC chemokine regulation (Table 2). Critically, NFKB1 and RELA mediated the expression of CXCL1, CXCL2, CXCL5, CXCL10, and CXCL12, and SP1 mediated the expression of CXCL1 and CXCL5. Next, LinkedOmics database analysis was used to identify the top two kinase targets of these CXC chemokines (Table 3). LYN proto-oncogene, src family tyrosine kinase (LYN) was identified as the kinase target of CXCL1, CXCL2, CXCL3, CXCL5, CXCL6, CXCL9, CXCL10, CXCL11, CXCL12, and CXCL13 in the kinase-target network, and LCK proto-oncogene, src family tyrosine kinase (LCK) was identified as the kinase target of CXCL2, CXCL3, CXCL5, CXCL6, CXCL9, CXCL10, CXCL11, CXCL13, and CXCL16. Inhibitor of nuclear factor kappa B kinase subunit beta (IKBKB), protein kinase CGMP-dependent 1 (PRKG1), and Janus kinase 2 (JAK2) were identified as key kinase targets of CXCL1, CXCL12, and CXCL16, respectively, in the kinase-target network. Moreover, protein kinase N1 (PKN1), adrenergic, beta, receptor kinase 1 (ADRBK1) and checkpoint kinase 1 (CHEK1), polo like kinase 1 (PLK1) were identified as the top two target kinase for CXCL7 and CXCL17, respectively. Finally, analysis at the LinkedOmics database allowed us to identify miRNAs that targeted the mRNAs encoding CXC chemokines (Table 4). The miRNA miR200A interacted mainly with the CXCL1 and CXCL5 miRNA-target network. Chemokine mRNAs CXCL1 and CXCL6 might be targeted by miR-30E-5P, miR-30B, miR-30D, miR-30C, and miR-30A-5P. CXCL3 expression might be modulated by miR-409-3P and miR-526B. CXCL5 and CXCL6 might be targeted by miR-141 and miR-374, respectively. CXCL7 might be targeted by miR-154, miR-487, miR-525, and miR-524s. Finally, CXCL17 might be targeted by miR-490.
Table 2
Key regulated factor of CXC chemokines in BLCA (TRRUST).
|
Key TF
|
Description
|
Overlapped genes
|
P value
|
Q value
|
List of overlapped genes
|
|
RELA
|
v-rel reticuloendotheliosis viral oncogene homolog A (avian)
|
5
|
1.16E-06
|
1.79E-06
|
CXCL10 ,CXCL12,CXCL2,CXCL5,CXCL1
|
|
NFKB1
|
nuclear factor of kappa light polypeptide gene enhancer in B-cells 1
|
6
|
1.16E-06
|
1.79E-06
|
CXCL12,CXCL10,CXCL5,CXCL1,CXCL2
|
|
SP1
|
Sp1 transcription factor
|
2
|
0.0406
|
0.0406
|
CXCL5,CXCL1
|
Table 3
The Kinase target networks of CXC chemokines in BLCA (LinkedOmics).
|
CXC chemokines
|
Kinase target
|
Description
|
Leading Edge Number
|
P Value
|
|
CXCL1
|
Kinase_LYN
|
LYN proto-oncogene, Src family tyrosine kinase
|
17
|
0
|
|
Kinase_IKBKB
|
inhibitor of nuclear factor kappa B kinase subunit beta
|
9
|
0
|
|
CXCL2
|
Kinase_LCK
|
LCK proto-oncogene, Src family tyrosine kinase
|
24
|
0
|
|
Kinase_LYN
|
LYN proto-oncogene, Src family tyrosine kinase
|
21
|
0
|
|
CXCL3
|
Kinase_LYN
|
LYN proto-oncogene, Src family tyrosine kinase
|
19
|
0
|
|
Kinase_LCK
|
LCK proto-oncogene, Src family tyrosine kinase
|
25
|
0
|
|
CXCL5
|
Kinase_LCK
|
LCK proto-oncogene, Src family tyrosine kinase
|
24
|
0
|
|
Kinase_LYN
|
LYN proto-oncogene, Src family tyrosine kinase
|
18
|
0
|
|
CXCL6
|
Kinase_SYK
|
spleen associated tyrosine kinase
|
16
|
0
|
|
Kinase_LYN
|
LYN proto-oncogene, Src family tyrosine kinase
|
24
|
0
|
|
CXCL7
|
Kinase_PKN1
|
protein kinase N1
|
5
|
0.009
|
|
Kinase_ADRBK1
|
G protein-coupled receptor kinase 2
|
10
|
0
|
|
CXCL9
|
Kinase_LYN
|
LYN proto-oncogene, Src family tyrosine kinase
|
18
|
0
|
|
Kinase_LCK
|
LCK proto-oncogene, Src family tyrosine kinase
|
20
|
0
|
|
CXCL10
|
Kinase_LCK
|
LCK proto-oncogene, Src family tyrosine kinase
|
20
|
0
|
|
Kinase_LYN
|
LYN proto-oncogene, Src family tyrosine kinase
|
16
|
0
|
|
CXCL11
|
Kinase_LCK
|
LCK proto-oncogene, Src family tyrosine kinase
|
20
|
0
|
|
Kinase_LYN
|
LYN proto-oncogene, Src family tyrosine kinase
|
17
|
0
|
|
CXCL12
|
Kinase_LYN
|
LYN proto-oncogene, Src family tyrosine kinase
|
20
|
0
|
|
Kinase_PRKG1
|
protein kinase, cGMP-dependent, type I
|
15
|
0.004
|
|
CXCL13
|
Kinase_LCK
|
LCK proto-oncogene, Src family tyrosine kinase
|
22
|
0
|
|
Kinase_LYN
|
LYN proto-oncogene, Src family tyrosine kinase
|
19
|
0
|
|
CXCL16
|
Kinase_LCK
|
LCK proto-oncogene, Src family tyrosine kinase
|
22
|
0
|
|
Kinase_JAK2
|
Janus kinase 2
|
7
|
0
|
|
CXCL17
|
Kinase_CHEK1
|
checkpoint kinase 1
|
45
|
0
|
|
Kinase_PLK1
|
polo like kinase 1
|
41
|
0
|
Table 4
The miRNA target networks of CXC chemokines in BLCA (LinkedOmics).
|
CXC chemokines
|
MIRNA targets
|
Leading Edge Number
|
P Value
|
|
CXCL1
|
GTAAGAT,MIR-200A
|
20
|
0.009
|
|
TGTTTAC,MIR-30A-5P,MIR-30C,MIR-30D,MIR-30B,MIR-30E-5P
|
133
|
0
|
|
CXCL3
|
AACATTC,MIR-409-3P
|
47
|
0.009
|
|
CXCL5
|
CTCAAGA,MIR-526B
|
24
|
0.019
|
|
CAGTGTT,MIR-141,MIR-200A
|
72
|
0.015
|
|
CXCL6
|
TATTATA,MIR-374
|
89
|
0
|
|
TGTTTAC,MIR-30A-5P,MIR-30C,MIR-30D,MIR-30B,MIR-30E-5P
|
192
|
0
|
|
CXCL7
|
GTATGAT,MIR-154,MIR-487
|
21
|
0
|
|
GCGCCTT,MIR-525,MIR-524
|
7
|
0.044
|
|
CXCL17
|
CCAGGTT,MIR-490
|
10
|
0.025
|
Immune Cell Infiltration of CXC Chemokines in patients with BLCA Patients
CXC chemokines influence immune cell infiltration and inflammatory responses in the TME, thus possibly affecting the clinical therapy and outcome in patients with BLCA. Using the TIMER database, we investigated comprehensively the correlation between infiltration of various immune cells and the differentially expressed CXC chemokines. CXCL1 expression correlated positively with the infiltration of dendritic cells (Cor = 0.427, p = 1.43e − 17, neutrophils (Cor = 0.444, p = 5.46e − 19), CD4 + T cells (Cor = 0.112, p = 3.26e − 02), and CD8 + T cells (Cor = 0.303, p = 3.39e − 09); Fig. 9A). Similarly, CXCL2 expression correlated positively with the infiltration of dendritic cells (Cor = 0.345, p = 1.22e − 11, neutrophils (Cor = 0.355, p = 3.05e − 12), CD4 + T cells (Cor = 0.128, p = 1.46e − 02), and CD8 + T cells (Cor = 0.255, p = 7.61e − 07; Fig. 9B). CXCL3 expression correlated negatively with the infiltration of dendritic cells (Cor = 0.4, p = 1.93e − 15, neutrophils (Cor = 0.424, p = 2.86e − 17), CD4 + T cells (Cor = 0.108, p = 3.89e − 02), CD8 + T cells (Cor = 0.302, p = 3.55e − 09), and B cells (Cor = −0.103, p = 4.88e − 02); Fig. 9C). CXCL5 expression correlated positively with the infiltration of dendritic cells (Cor = 0.43, p = 7.83e − 18), neutrophils (Cor = 0.385, p = 2.70e − 14), CD4 + T cells (Cor = 0.116, p = 2.63e − 02), CD8 + T cells (Cor = 0.288, p = 2.10e − 08; Fig. 9D). CXCL6 expression correlated positively with the infiltration of CD8 + T cells (Cor = 0.219, p = 2.42e − 05), neutrophils (Cor = 0.339, p = 3.50e − 11), and dendritic cells (Cor = 0.43, p = 7.83e − 18; Fig. 9E). A similar correlation tendency was found between CXCL7 expression and dendritic cells (Cor = 0.239, p = 3.74e − 06), neutrophils (Cor = 0.174, p = 8.87e − 04), and CD8 + T cells (Cor = 0.164, p = 1.60e − 03; Fig. 9F). CXCL9, CXCL10, and CXCL11 mRNA expression levels correlated positively with the infiltration of dendritic cells, neutrophils, CD4 + T cells, and CD8 + T cells (all p < 0.05; Fig. 9G-I). CXCL12 expression correlated positively with the infiltration of dendritic cells (Cor = 0.156, p = 2.88e − 03), neutrophils (Cor = 0.208, p = 6.27e − 05), macrophages (Cor = 0.464, p = 7.25e − 21), CD4 + T cells (Cor = 0.146, p = 5.21e − 03), and CD8 + T cells (Cor = 0.134, p = 1.05e − 02; Fig. 9J). With the exception of macrophages, CXCL13 expression correlated positively associated with the other immune cell types consisted of dendritic cells, CD4 + T cells, neutrophils, CD8 + T cells, and B cells (p < 0.05; Fig. 9K). CXCL16 expression correlated positively with the infiltration of CD8 + T cells, CD4 + T cells, macrophages, neutrophils, and dendritic cells (all p < 0.05; Fig. 9L). CXCL17 mRNA expression correlated positively with B cells (Cor = 0.156, p = 2.83e − 03), and negatively with dendritic cells (Cor = −0.167, p = 1.35e − 03; Fig. 9M). A Cox proportional hazard model was used identify factors associated with prognosis of patients with BLCA, which identified B cells (p = 0.032), macrophages (p = 0.001), and CXCL2 mRNA expression (p = 0.010). CXCL7 mRNA expression (p = 0.066) had significantly statistical tendency towards predicting the clinical outcome of BLCA patients (Table 5).
Table 5: The cox proportional hazard model of CXC chemokines and six tumor-infiltrating immune cells in BLCA (TIMER2.0).

*P < 0.05, **P < 0.01