Materials and reagents
Dopamine hydrochloride (C8H11NO2·HCl) and calcium ascorbate (Vc-Ca) were purchased from Shanghai Macklin Biochemical Co., Ltd. 1,3,5-trimethylbenzene (C9H12) and Pluronic F127 (EO106PO70EO106) were obtained from Shanghai Chemical Corp. Ammonium hydroxide (NH3·H2O) and ethanol (C2H6O) were obtained from Sinopharm Chemical Reagent Co., Ltd. 1-tetradecanol (PCM) was purchased from Tianjin Xisisi Biochemical Technology Co., Ltd. The reduced GSH assay kit and H2O2 assay kit were obtained from Nanjing Jiancheng Bioengineering Institute. Catalase and BAPTA-AM were purchased from Sigma-Aldrich. 3-(4,5-dimethylthiazol-2-yl)-2,5-diphenyltetrazolium bromide (MTT), LDH assay kit, 4,6-diamino-2-phenylindole (DAPI), and Mitochondrial Membrane Potential assay kit with JC-1 were bought from Beyotime Biotechnology. Phalloidine, 2,7-Dichlorodihydrofluorescein diacetate (DCFH-DA) and Calcein-AM/EthD-I double-stain kit were purchased from Suzhou Yuheng Biotechnology Co., Ltd. All reagents were used without further purification.
Preparation of MpDA nanoparticles
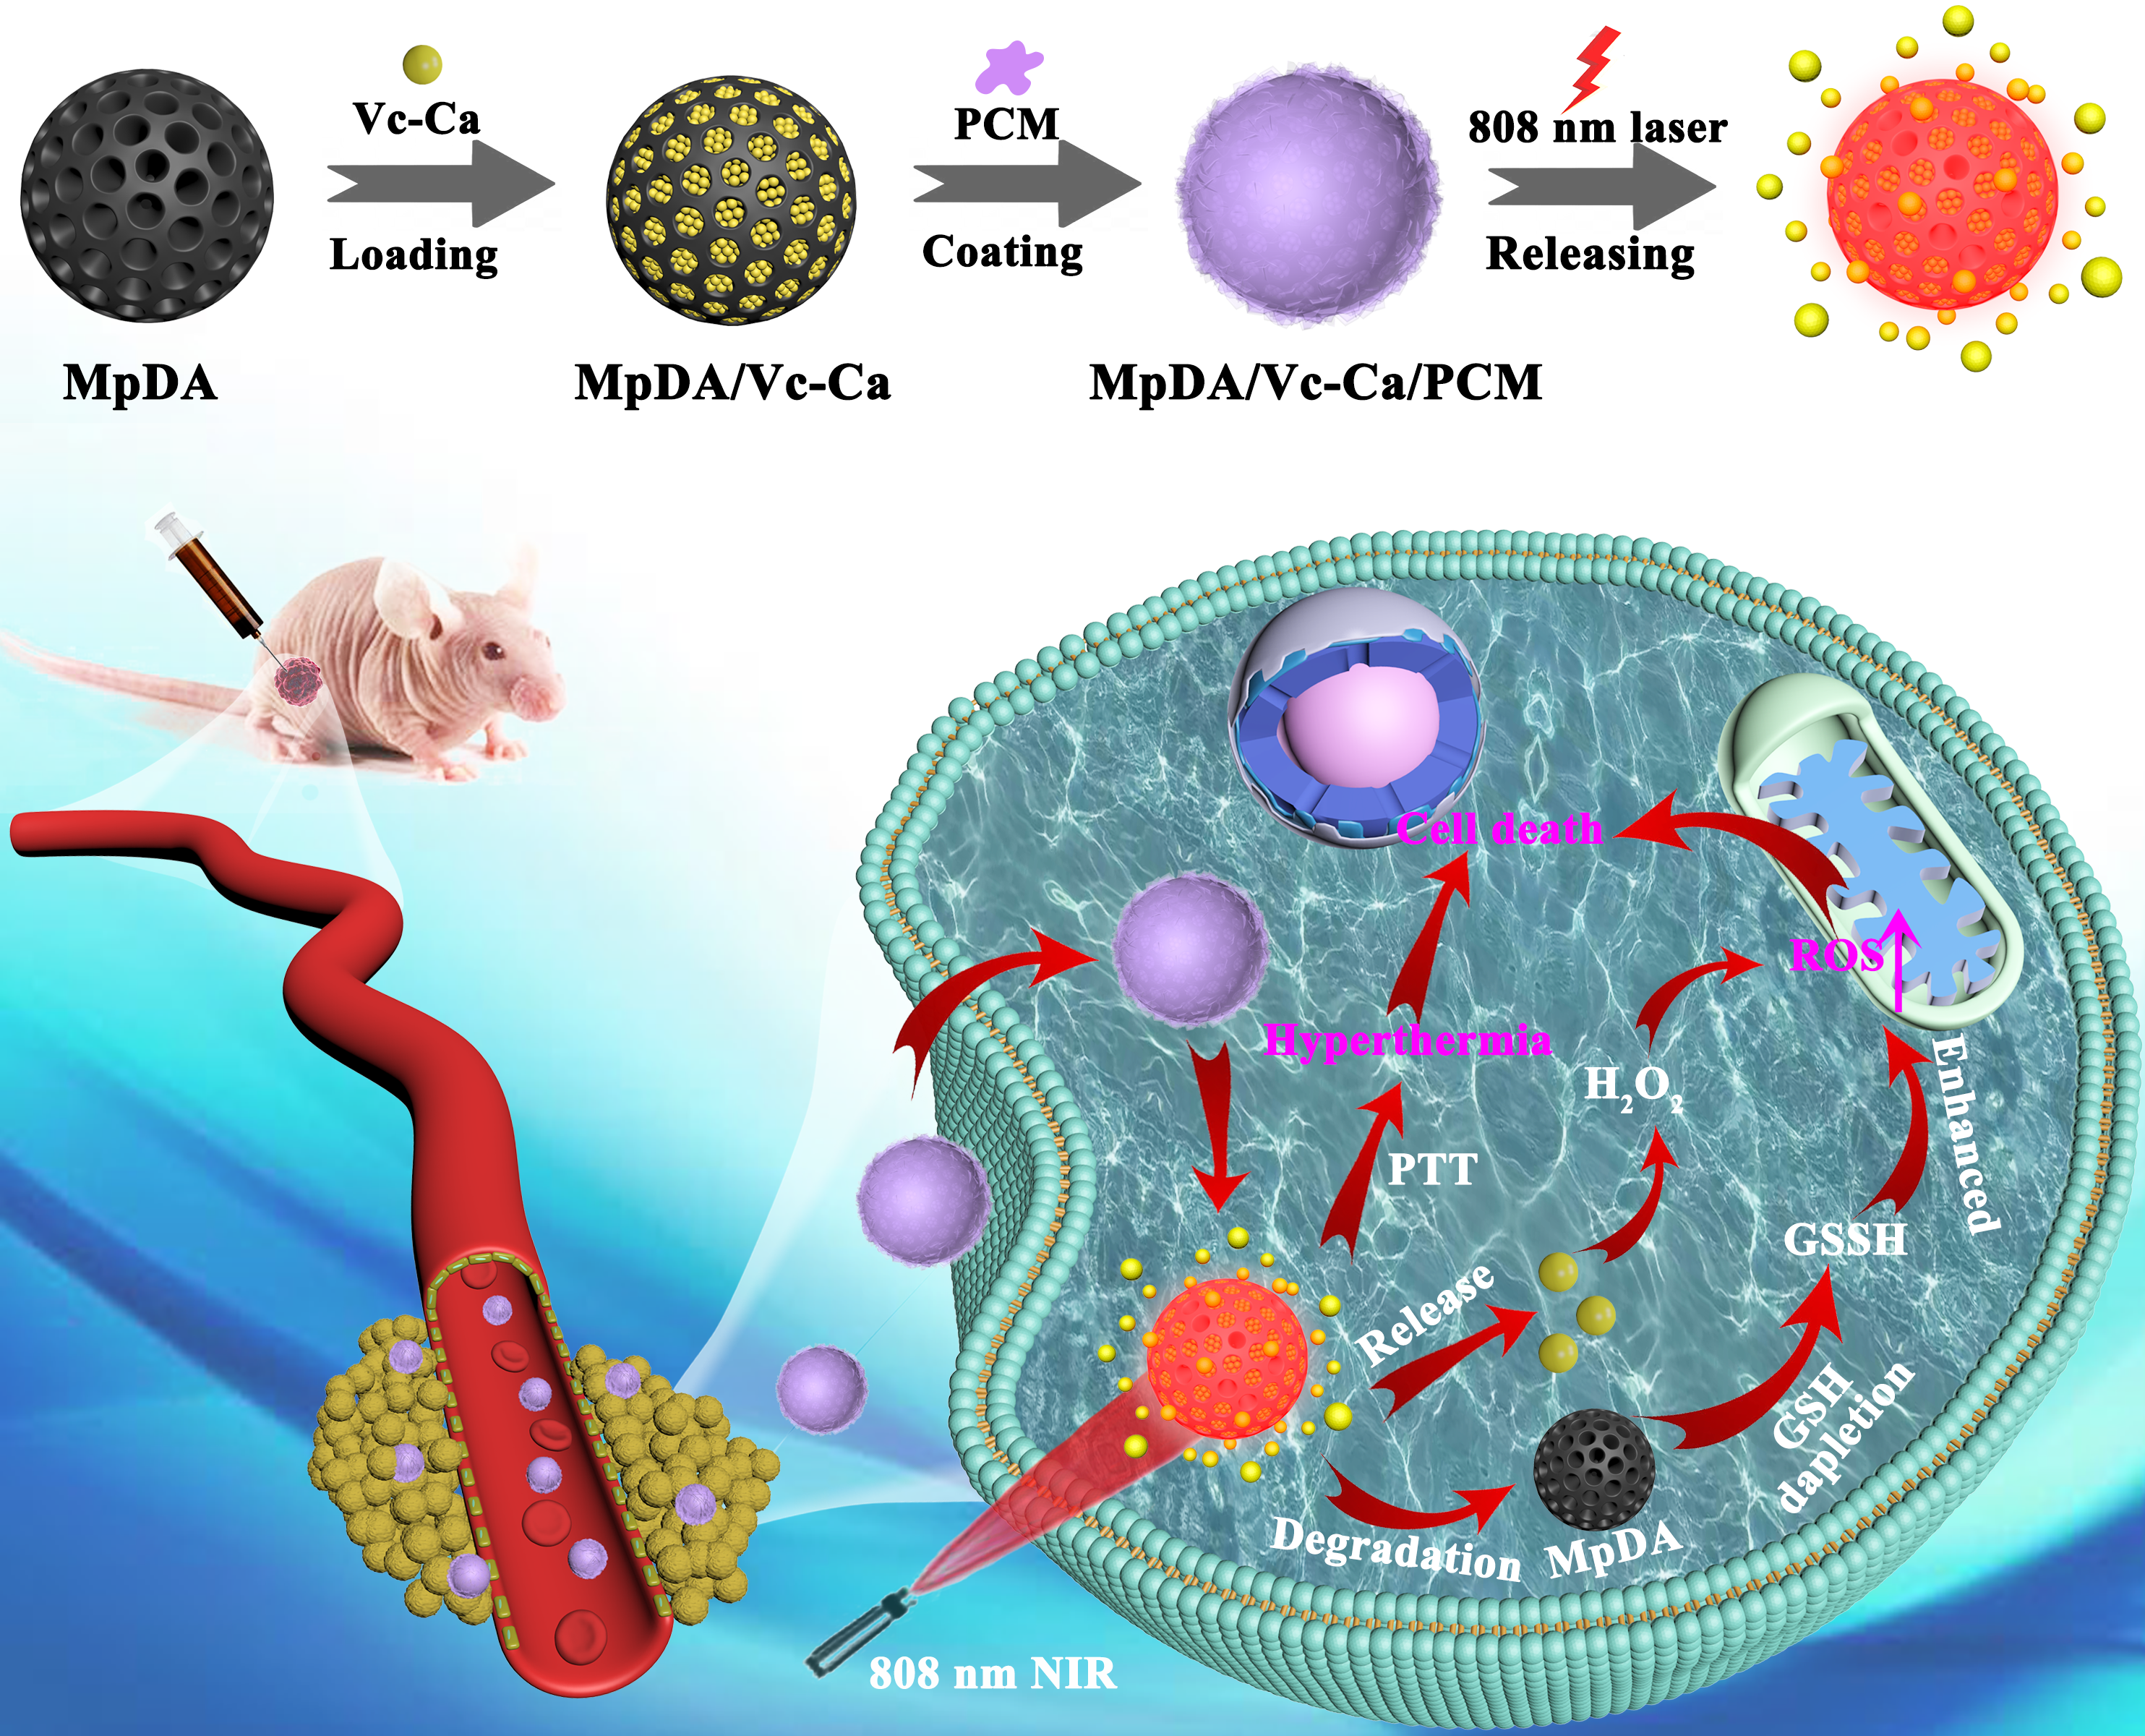
MpDA nanoparticles were prepared via a versatile nanoemulsion assembly approach according to a previous study[31]. Briefly, 1 g of F127 and 0.5 g of dopamine hydrochloride were dissolved in 100 mL of distilled water and ethanol mixture (Vwater: Vethanol = 1:1) and stirred at room temperature for 30 min to obtain a clear solution. Then, 2 mL of TMB was slowly injected into the reaction mixture and stirred at 500 rpm for 30 min. Subsequently, 5 mL of NH3·H2O was dropped into the above solution to induce the self-polymerization of dopamine oligomers. After stirring for another 30 min, the final products were centrifuged and washed with water and ethanol for at least three times.
Fabrication of MpDA/Vc-Ca/PCM
To obtain the PCM and Vc-Ca loaded MpDA, 10 mg of MpDA powder was dissolved in 1 mL of deionized water, and 0.1 g of Vc-Ca was added to the above solution. After stirring at room temperature for 8 h, the precipitates were purified by centrifuging. Then, the products were re-dispersed in 1 mL of ethanol, 0.15 g PCM was added and further stirred at 50°C for 6 h. The resulting solution was gathered via centrifugation and carefully washed with distilled water and ethanol for several times.
Loading capacity of Vc-Ca
The Vc-Ca standard curve was drawn first. Typically, 10 mg of Vc-Ca was accurately weighed and prepared with deionized water into a mother solution with concentration of 100 µg/mL. Then, the mother liquor was diluted with deionized water into standard solution series of 2.125, 4.25, 8.5, 17, 34 µg/mL, and the characteristic absorption at 266 nm was measured using the UV-vis spectrometer. To determinate the loading capacity of Vc-Ca, the centrifuged supernatant was collected in the preparation process of MpDA/Vc-Ca/PCM, and the absorbance value of Vc-Ca in the medium was analyzed by UV-vis at 266 nm. The amount of Vc-Ca in the supernatant was calculated through the standard curve of Vc-Ca.
Controlled release of Vc-Ca
In order to study the thermo-responsive release behavior, MpDA/Vc-Ca/PCM was dissolved in deionized water at 37°C and 50°C, respectively. At predetermined time point, the supernatant was centrifuged and the releasing amounts of Vc-Ca were detected by UV-vis spectrum. The content of Vc-Ca at each point was obtained according to the standard curve of Vc-Ca.
Photothermal performance of MpDA
In order to evaluate the photothermal performance of MpDA, 1 mL of deionized water and MpDA solutions with various concentrations (50 µg/mL, 75 µg/mL, 100 µg/mL, 150 µg/mL and 200 µg/mL) were irradiated by the NIR laser (808 nm, 1 W/cm2) for 10 min. During laser irradiation, the real-time temperature changes and thermal images were monitored using an infrared thermal imaging camera (FLIR TG165). The heating curves of MpDA (100 µg/mL) under the irradiation of an NIR laser at 1 and 1.8 W/cm2 were also acquired. The photothermal stability of MpDA was investigated by periodic laser irradiation for five cycles. Briefly, MpDA solution (100 µg/mL) was firstly exposed to the NIR laser at the power density of 1 W/cm2 for 10 min, followed by cooling down to room temperature prior to the next irradiation.
GSH consumption capacity of MpDA
In brief, different concentration of MpDA (0, 50, 75, 100, 150, and 200 µg/mL) were incubated with 20 µM of GSH for 1 h. After, the mixed solution was centrifuged, and the absorbance value of the supernatant solution was measured in line with the instructions of the reduced GSH assay kit. On the basis of the above experimental procedure, the GSH consumption performance of MpDA at different intervals was further detected by UV-vis after the reaction of MpDA (100 µg/mL) and GSH for 0, 2, 12, 24 and 48 h. In addition, when MpDA and GSH were co-incubated for 48 h, the final products were collected by centrifugation and its chemical structure was analyzed by FTIR.
Cell culture
MG63 cells and NIH-3T3 cells were obtained from China Center for Type Culture Collection (Wuhan, China). The two types of cells were cultured and maintained as monolayers in DMEM medium containing 10 vol% fetal bovine serum (HyClone) and 1 vol% penicillin-streptomycin (Invitrogen) at 37°C in 5% CO2.
Intracellular GSH consumption
MG63 cells were seeded in 6-well plates and incubated for 24 h. Then, serum-free medium containing different concentrations of MpDA (0, 50, 75, 100, 150, and 200 µg/mL) was added. After incubation for another 12 h, cells were centrifuged and redispersed in PBS (0.5 mL, 0.1 M) solution before lysis by ultrasonic and grinding. The supernatant after treatment with precipitant was further operated according to the instruction of GSH assay kit, and the absorbance was measured at 405 nm with a microplate reader (BioTek-1807292).
Cytotoxicity mechanism of Vc-Ca
MG63 cells were seeded in 96-well plates and incubated for 24 h. Then, cells were treated with different concentrations of Vc-Ca (0, 0.05, 0.1, 0.5, 1.0, 2.5 and 5.0 mM) dispersed in serum-containing medium for another 24 h. Subsequently, the culture medium was discarded, and 200 µL of serum-free media containing 10% MTT reagent were added to each well. After 4 h of incubation, the original culture medium was replaced with 150 µL of dimethyl sulfoxide followed by further incubation for 10 min. Finally, the absorbance was measured at 492 nm using a microplate reader.
The cell viability of MG63 cells treated with Vc-Ca and catalase were also detected. Briefly, MG63 cells were seeded in 96-well plates. After 24 h of incubation, different concentrations of Vc-Ca (0, 0.05, 0.1, 0.5, 1.0, 2.5 and 5.0 mM) were added, at the same time, 20 µL of catalase (250 µg/mL) was supplied to each well. After cultured for 24 h, the cells were operated in accordance with the above procedures.
In order to explore the effect of Ca2+ in Vc-Ca on cell activity, we used BAPTA-AM chelated Ca2+ ion. The procedure was the same as above, only replacing the catalase with BAPTA-AM (80 µM). In addition, to further investigate the cell damage mechanism of Vc-Ca, a series of comparative experiments were set up. In brief, MG63 cells were seeded in 96-well plates and incubated for 24 h. Then, the cells were divided into six groups: blank group (control group), catalase group (250 µg/mL), BAPTA-AM group (80 µM), Vc-Ca group (5.0 mM), Vc-Ca + catalase group, and Vc-Ca + BAPTA-AM group. After 24 h of incubation, the cells were treated following the above steps.
Extracellular H2O2 level
MG63 cells were seeded in 6-well plates and incubated for 24 h. Then, serum-containing medium with different concentrations of Vc-Ca (0, 0.05, 0.1, 0.5, 1.0, 2.5 and 5.0 mM) was added into each well. After further culture for 30 min, 60 min, 90 min and 120 min, respectively, the cells were washed twice with PBS. The extracellular H2O2 level was determined using the H2O2 assay kit in line with the manufacturer’s instructions.
Cell viability detection
MG63 cells were seeded in 96-well plates and incubated for 24 h. Then, different concentrations of MpDA (0, 50, 75, 100, 150 and 200 µg/mL) and MpDA/Vc-Ca/PCM (containing MpDA: 0, 50, 75, 100, 150 and 200 µg/mL) was added into the plate. After 12 h of incubation, the laser irradiation groups were treated with an 808 nm laser at a power density of 1 W/cm2 for 10 min, and then the cells were continued to be cultured for 5 h. Afterward, the absorbance of each group was measured by a standard MTT assay. Additionally, to evaluate cell compatibility, NIH-3T3 cells were seeded in 96-well plates and incubated for 24 h. Then, different concentrations of MpDA/Vc-Ca/PCM were added into the plate and incubated for another 17 h. Next, the handling method for the NIH-3T3 cells was also using the MTT method.
Cell cytotoxicity detection
MG63 cells were seeded in 96-well plates and incubated for 24 h. Subsequently, the cells were treated with different groups such as blank (control group), MpDA (100 µg/mL), MpDA/Vc-Ca/PCM (MpDA: 100 µg/mL), Vc-Ca (5.0 mM), MpDA + NIR (100 µg/mL) and MpDA/Vc-Ca/PCM + NIR (containing MpDA: 100 µg/mL). In subsequent experiments, all groups followed this concentration unless otherwise specified. After 12 h of incubation, the laser irradiation groups were exposed to an 808 nm laser at a power density of 1 W/cm2 for 10 min, and the cells were incubated for another 5 h. After that, the culture medium collected from each well was centrifuged at 400 g for 5 min, and 120 µL of the supernatant in each group was incubated with 60 µL of LDH reagent for 30 min at 25°C. Finally, the absorbance was determined on a microplate reader at 492 nm.
Cell morphology observation
MG63 cells were seeded in 24-well plates and incubated for 24 h. Subsequently, the cells were treated with different groups such as blank (control group), MpDA, MpDA/Vc-Ca/PCM, Vc-Ca, MpDA + NIR and MpDA/ Vc-Ca/PCM + NIR for 12 h. Specifically, the laser irradiation groups were exposed to an 808 nm laser at a power density of 1 W/cm2 for 10 min, and the cells were incubated for another 5 h. Secondly, the cells were washed with PBS, fixed with 3% glutaraldehyde for 15 min, and then permeabilized with 0.5% Triton X-100 for 10 min. Then, the cells were dyed with DAPI for 10 min and fixed by 2.5% glutaraldehyde. The cell cytoskeleton and nuclei were stained with phalloidin and DAPI for 20 min, respectively, before observing the cell images using a fluorescence microscope (NiKon-H550S, Japan).
Live/dead staining
Calcein-AM and ethidium homodimer-1 was used to stain the live and dead cells. MG63 cells were seeded in 24-well plates and incubated for 24 h. Subsequently, the cells were treated with different groups such as blank (control group), MpDA, MpDA/Vc-Ca/PCM, Vc-Ca, MpDA + NIR and MpDA/Vc-Ca/PCM + NIR for 12 h. The laser irradiation groups were exposed to an 808 nm laser at a power density of 1 W/cm2 for 10 min, and the cells were incubated for another 5 h. Next, the dye mixture of calcein-AM and ethidium homodimer-1 was added into each well and incubated for 15 min in dark condition. After thoroughly rinsed with PBS, cells were observed under the fluorescence microscope.
ROS generation assay
The ROS generation was examined by using a DCFH-DA method. MG63 cells were seeded in 24-well plates and incubated for 24 h. Subsequently, the cells were divided into six groups: blank group (control group), MpDA group, MpDA/Vc-Ca/PCM group, Vc-Ca group, MpDA + NIR group and MpDA/Vc-Ca/PCM + NIR group. After 12 h of incubation, the laser irradiation groups were treated with an 808 nm laser at a power density of 1 W/cm2 for 10 min, and the cells were incubated for another 5 h. Then, 400 µL of the DCFH-DA solution (1 µM in serum-free medium) was added into the cells and followed by additional incubation for 30 min at 37°C. After thoroughly rinsed with PBS, the intracellular ROS levels were observed by fluorescence microscope.
ΔѰm assessment
MG63 cells were seeded in 24-well plates and incubated for 24 h. Then, the cells were divided into two groups: MpDA/Vc-Ca/PCM group and MpDA/Vc-Ca/PCM + NIR group. After 12 h of incubation, the laser irradiation groups were treated with an 808 nm laser at a power density of 1 W/cm2 for 10 min. and the cells were incubated for another 5 h. Afterward, the cells were stained with JC-1 dyestuff for 20 min, and the excess dye was washed with PBS. Ultimately, the cell images were captured using a fluorescence microscope.
In Vivo thermal imaging
The photothermal effects of composite nanoparticles in mice were investigated by infrared thermal image. Nude mice bearing 143B tumors were randomly assigned to five groups: PBS + NIR group, Vc-Ca + NIR group, MpDA + NIR group, MpDA/Vc-Ca/PCM + NIR group, and MpDA/Vc-Ca/PCM group. The mice of laser irradiation groups were exposed to an 808 nm laser at a power density of 1 W/cm2 for 10 min. During this period, an infrared thermal camera was used to record the temperatures every 30 s in tumor sites. At the same time, the infrared thermal images of mice were taken at 0 min, 1 min, 3 min, 5 min and 10 min.
In Vivo antitumor therapy
All animal experiments were approved by the Animal Ethics Committee of Wuhan Servicebio Technology Co., Ltd (SYXK(W)2015 − 0693). Twenty nude mice (BALB/c, 5 weeks old) were purchased from the Beijing Vital River Laboratory Animal Technology Co., Ltd. (China; animal quality certificate NO.110011211108440457). 143B cells (5×10⁷) suspended in 125 µL of serum free cell medium were subcutaneously injected into the back of each mouse to establish the tumor model. When the tumor volume reached ~ 100 mm3, mice were intratumorally injected with 50 µL of PBS, Vc-Ca (2 mg/mL), MpDA (8 mg/mL) and MpDA/Vc-Ca/PCM fluid (containing MpDA: 8 mg/mL), respectively. The mice were randomized into five groups (4 mice/group): PBS + NIR group, Vc-Ca + NIR group, MpDA + NIR group, MpDA/Vc-Ca/PCM + NIR group, and MpDA/Vc-Ca/PCM group. For the laser irradiation treatment groups, after 0, 3, 6 days injection, the mice were irradiated by the 808 nm laser at the power density of 1 W/cm2 for 10 min. The non-laser group (MpDA/Vc-Ca/PCM) also received injection on day 0, 3, 6 without laser irradiation. Body weight and tumor volume were both recorded every two days from day 0 (after the initial drug injection) until the 14st day. All the mice were euthanized on day 14, and the tumor tissues were dissected to weigh and collected for photographing. In addition, the tissue sections of tumors were subjected for histological analysis with H&E, TUNEL and GPX4 staining.
Statistical analysis
Each experiment in this study was repeated three times. For samples that were used for each experiment, an n = 5 or 6 was used. All data were expressed as mean ± standard deviation (SD). Each experiment was repeated three times.