Study Design
This is a prospective, observational, cross-sectional case series. The study protocol follows the tenets of the Declaration of Helsinki and was approved by the local review board. Written, informed consent was obtained from all the participants before entering the study.
Study population
Consecutive patients, aged 18 or over, were recruited and enrolled at the Istituto Europeo di Microchirurgia Oculare - IEMO (Udine, Italy) between September 2017 and December 2017. Patients were excluded from the study if they were unable to give informed consent, were unable to position at the slit lamp table, or were unable to fixate on the light target of the camera.
Study protocol
Each subject underwent a complete ophthalmologic examination, including best-corrected visual acuity (BCVA) assessment on standard Early Treatment Diabetic Retinopathy Study (ETDRS) charts, slit-lamp biomicroscopy, and dilated ophthalmoscopy. On the same day, non-mydriatic fundus images were acquired using a fully automated retinal imaging system (Eidon, Centervue, Padova, Italy) (system 1) and a conventional flash fundus camera (Topcon Corporation, Tokyo, Japan) (system 2).
According to the protocol, one retinal image centered on the macula was captured for each eye by a trained technician. Care was taken to generate gradable quality images.
All color images were evaluated with respect to the chromaticity. Images were analyzed exactly as they were outputted from the two devices. No image processing (e.g. tone and contrast enhancing/adjustment, color normalization) was performed.
Fundus cameras
System 1
The Eidon is a slit confocal system that captures 14 megapixel 60-degree retinal images in an automated fashion through a non-mydriatic pupil (as small as 2.5mm). The light source is a broad spectrum white light LED (440-650 nm).
System 2
A high-definition, non-mydriatic color fundus camera was used to acquire 45-degree 12 megapixel digital images. The system is capable of capturing images through pupils as small as 3.3 mm insize and features a xenon light source.
Chromaticity analysis
Since the two devices produce images with different angles of view, for the purpose of performing chromaticity analysis, we cropped the images in order to have the same retinal field size for evaluation (Figure 1).
The images between devices were compared in a structured color space, i.e. a mathematical model where each color can be represented by a set of coordinates [8,9]. Since the color of a single pixel corresponds to a position in the color space, located by its coordinates, the totality of the pixels in an image defines a region that is a subset of the whole color space. This region is distinctive for every image and thus we termed it the color signature.
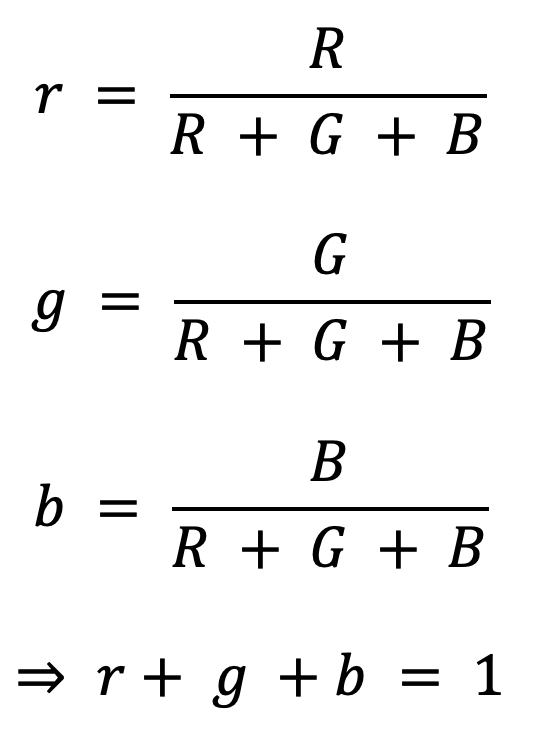
In this study, we used the default RGB color space and the rgb chromaticity color space [10]. Whereas in the RGB (Red, Green, Blue) color space a single pixel is identified by the intensity of Red, Green, and Blue primary colors, the same pixel in the rgb chromaticity space model is represented by the normalization of its RGB intensities:
Due to technical limitations, equation 1 has been placed in the supplementary files section.
From now on, we will refer to the primary color intensities with uppercase letters and to their normalized values (the chromaticity) with lowercase letters. Since rgb chromaticity is normalized over intensities, its descriptive power is invariant to illumination and related only to the quality of the color. For example, a dark pure red represented by its primaries RGB = [50, 0, 0] is different than a bright pure red RGB = [200, 0, 0]; in the chromaticity space, where a color is represented by the proportions of intensities rather than by the intensities themselves, both the dark and bright pure red are expressed as rgb = [1, 0, 0].
By definition, the sum of r, g, and b will always equal one: because of this property the b dimension could be omitted without causing any loss in information. Thus, the color signature of an image can be displayed as a distribution of points in the r and g axes of the chromaticity space (Fig. 2, 3, and 4). In the rg chromaticity space the horizontal axis represents the r component, the vertical axis represent the g component; the third coordinate can always be inferred (b = 1 - r - g). The origin rg = [0, 0] corresponds to the pure blue, rg = [1, 0] to the pure red, and rg = [0, 1] to the pure green; rgb = [⅓, ⅓, ⅓] is the location of all shades of gray (from black to white).
Outcomes
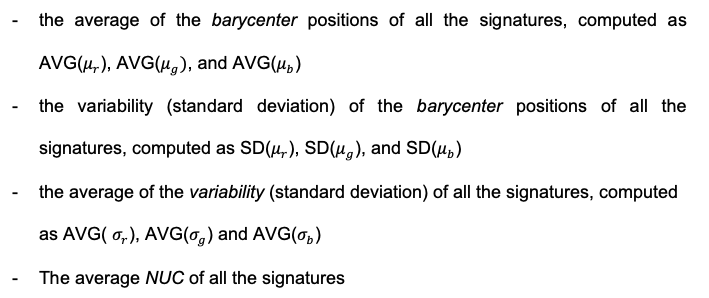
The color signature of a single image can be synthesized using three parameters, derived from the analysis of its pixels distribution on the rgb chromaticity space:
Due to technical limitations, equation 2 and the requisite text has been placed in the supplementary files section.
From a diagnostic point of view, a good colourful image has a high descriptive power when it is characterized by a barycenter close to the center of the chromaticity diagram (i.e.: rgb = [⅓, ⅓, ⅓]) and it is surrounded by a wide and continuous cloud of pixels.
In order to characterize the capability of a device to provide images with good color signatures a large series of images have to be analyzed. We devised a set of descriptors that are computed on a population of image signatures:
Due to technical limitations, equation 3 and the requisite text has been placed in the supplementary files section.
Thereafter, a good color imaging device, developed specifically for the diagnosis of retinal pathologies, is identified by an average barycenter located close to the center of the color space (no color dominance); a high variability of the barycenters position (different retinal conditions are represented with different color signatures); a high value of standard deviation (retina is reproduced with a collection of distant colours); and an high NUC percentage (the device is able to express a continuum of different colors).
Statistical analysis
After assessing the normality of the distributions, differences in chromaticity analysis outcomes and positions in the color space were evaluated using two-tailed paired t-test and multivariate paired Hotelling's T2. A p value of <0.05 was defined as statistically significant.