Ovarian cancer TMA construction and Immunohistochemistry (IHC)
Seventy-eight formalin-fixed paraffin-embedded tumor specimens were obtained from 26 ovarian cancer patients, comprising primary, synchronous metastasis, and metachronous recurrence from the same patient collected at the time of tumor recurrence after combination paclitaxel and platinum therapy. Tissue microarray (TMA) construction and IHC staining were conducted as previously described[25-27]. Twenty-one patients were grade 3, four patients were grade 2 and one patient was grade 1 at time of diagnosis. All the patients were disease stage III to IV with various pathological types, including serous, clear cell, transitional cell, endometroid, and undifferentiated cell. The time range of disease-free survival (DFS) was between 5.3 months and 53.3 months; the shortest overall survival (OS) of a patient was 12 months, and the longest follow-up of a living patient was 162.3 months (Supplementary Table 1).
Evaluation of immunohistochemistry staining in TMA
Assessment of immunohistochemical staining was performed separately by two independent investigators blinded to clinical information. For total ATR, the staining intensity pattern was scored as follows: 0, no staining; 1+, weak staining; 2+, moderate staining; and 3+, intense staining. p-ATR mainly resided in the nucleus and was scored according to the percentage of cancer cells with positive nuclear staining, the staining patterns were categorized into six groups: 0, no nuclear staining; 1+, <10% of cells stained positive; 2+, 10% to 25% positive cells; 3+, 26% to 50% positive cells; 4+, 51% to 75% positive cells; 5+, >75% positive cells. ATR and p-ATR staining images were obtained using a Nikon Eclipse Ti-U fluorescence microscope (Diagnostic Instruments Inc., NY, USA) with a SPOT RTTM digital camera (Diagnostic Instruments Inc.).
Cell lines and cell culture
Human ovarian cancer cell lines Skov3 (ATCC® HTB-77™), and Caov-3 (ATCC® HTB-75™) were purchased from the American Type Culture Collection (Rockville, MD). A2780 (ECACC 93112519) was obtained from the European Collection of Authenticated Cell Cultures. Dr. Patricia Donahoe (Massachusetts General Hospital, Boston, MA) provided the human IGROV-1, OVCAR5, and OVCAR8 ovarian cancer cell lines. These cell lines were maintained in RPMI 1640 (GE Healthcare Life Sciences, Logan, Utah, USA) medium supplemented with 10% FBS (MilliporeSigma, Burlington, MA, USA) and 1% penicillin/streptomycin (Thermo Fisher Scientific, Waltham, MA, USA) in a humidified incubator containing 5% CO2 at 37°C. Cells were resuspended with 0.05% trypsin-EDTA (Life Technologies Corporation, NY, USA) before subculture.
Protein extraction and Western blotting
Cell lysates were prepared with 1× RIPA lysis buffer (EMD Millipore Corporation, CA, USA) and protease inhibitor cocktail tablets (Roche Applied Science, IN, USA). Lysates were centrifuged and collected as supernatants, then total protein concentration was determined by Bio-Rad DC Protein Assay reagents (Bio-Rad, Hercules, CA, USA) following the manufacturer's instructions. Antibodies directed against ATR, Chk1, p-Chk1(Ser345), p-Cdc25c (Ser216), p-Cdc2(Tyr15), PARP, γH2AX were purchased from Cell Signaling Technologies (Sampler Kit #9947, Cambridge, MA). Other antibodies included p-ATR (Ser428) (Catalog #ab178407, Abcam, San Francisco, CA) and a monoclonal antibody to human actin from Sigma-Aldrich (Catalog #A2228, St. Louis, MO). Equal amounts of each protein sample were separated in NuPAGE 4–12% Bis-Tris Gel (Thermo Fisher Scientific), blotted onto nitrocellulose membranes (Bio-Rad), blocked with 5% non-fat dry milk, rinsed, and incubated overnight with the corresponding specific primary antibodies at 4°C. The next day, the membranes were rinsed and incubated with the secondary antibodies: goat anti-rabbit IRDye 800CW and goat anti-mouse IRDye 680LT (1: 10,000 dilution Li-Cor Biosciences, Lincoln, NE, USA) for 1 hour at room temperature with gentle agitation. After washed with 1×PBS, the protein band was detected by Odyssey CLx equipment. Odyssey v.3.0 software (Li-Cor Biosciences) was used to quantify protein bands by optical density measurement.
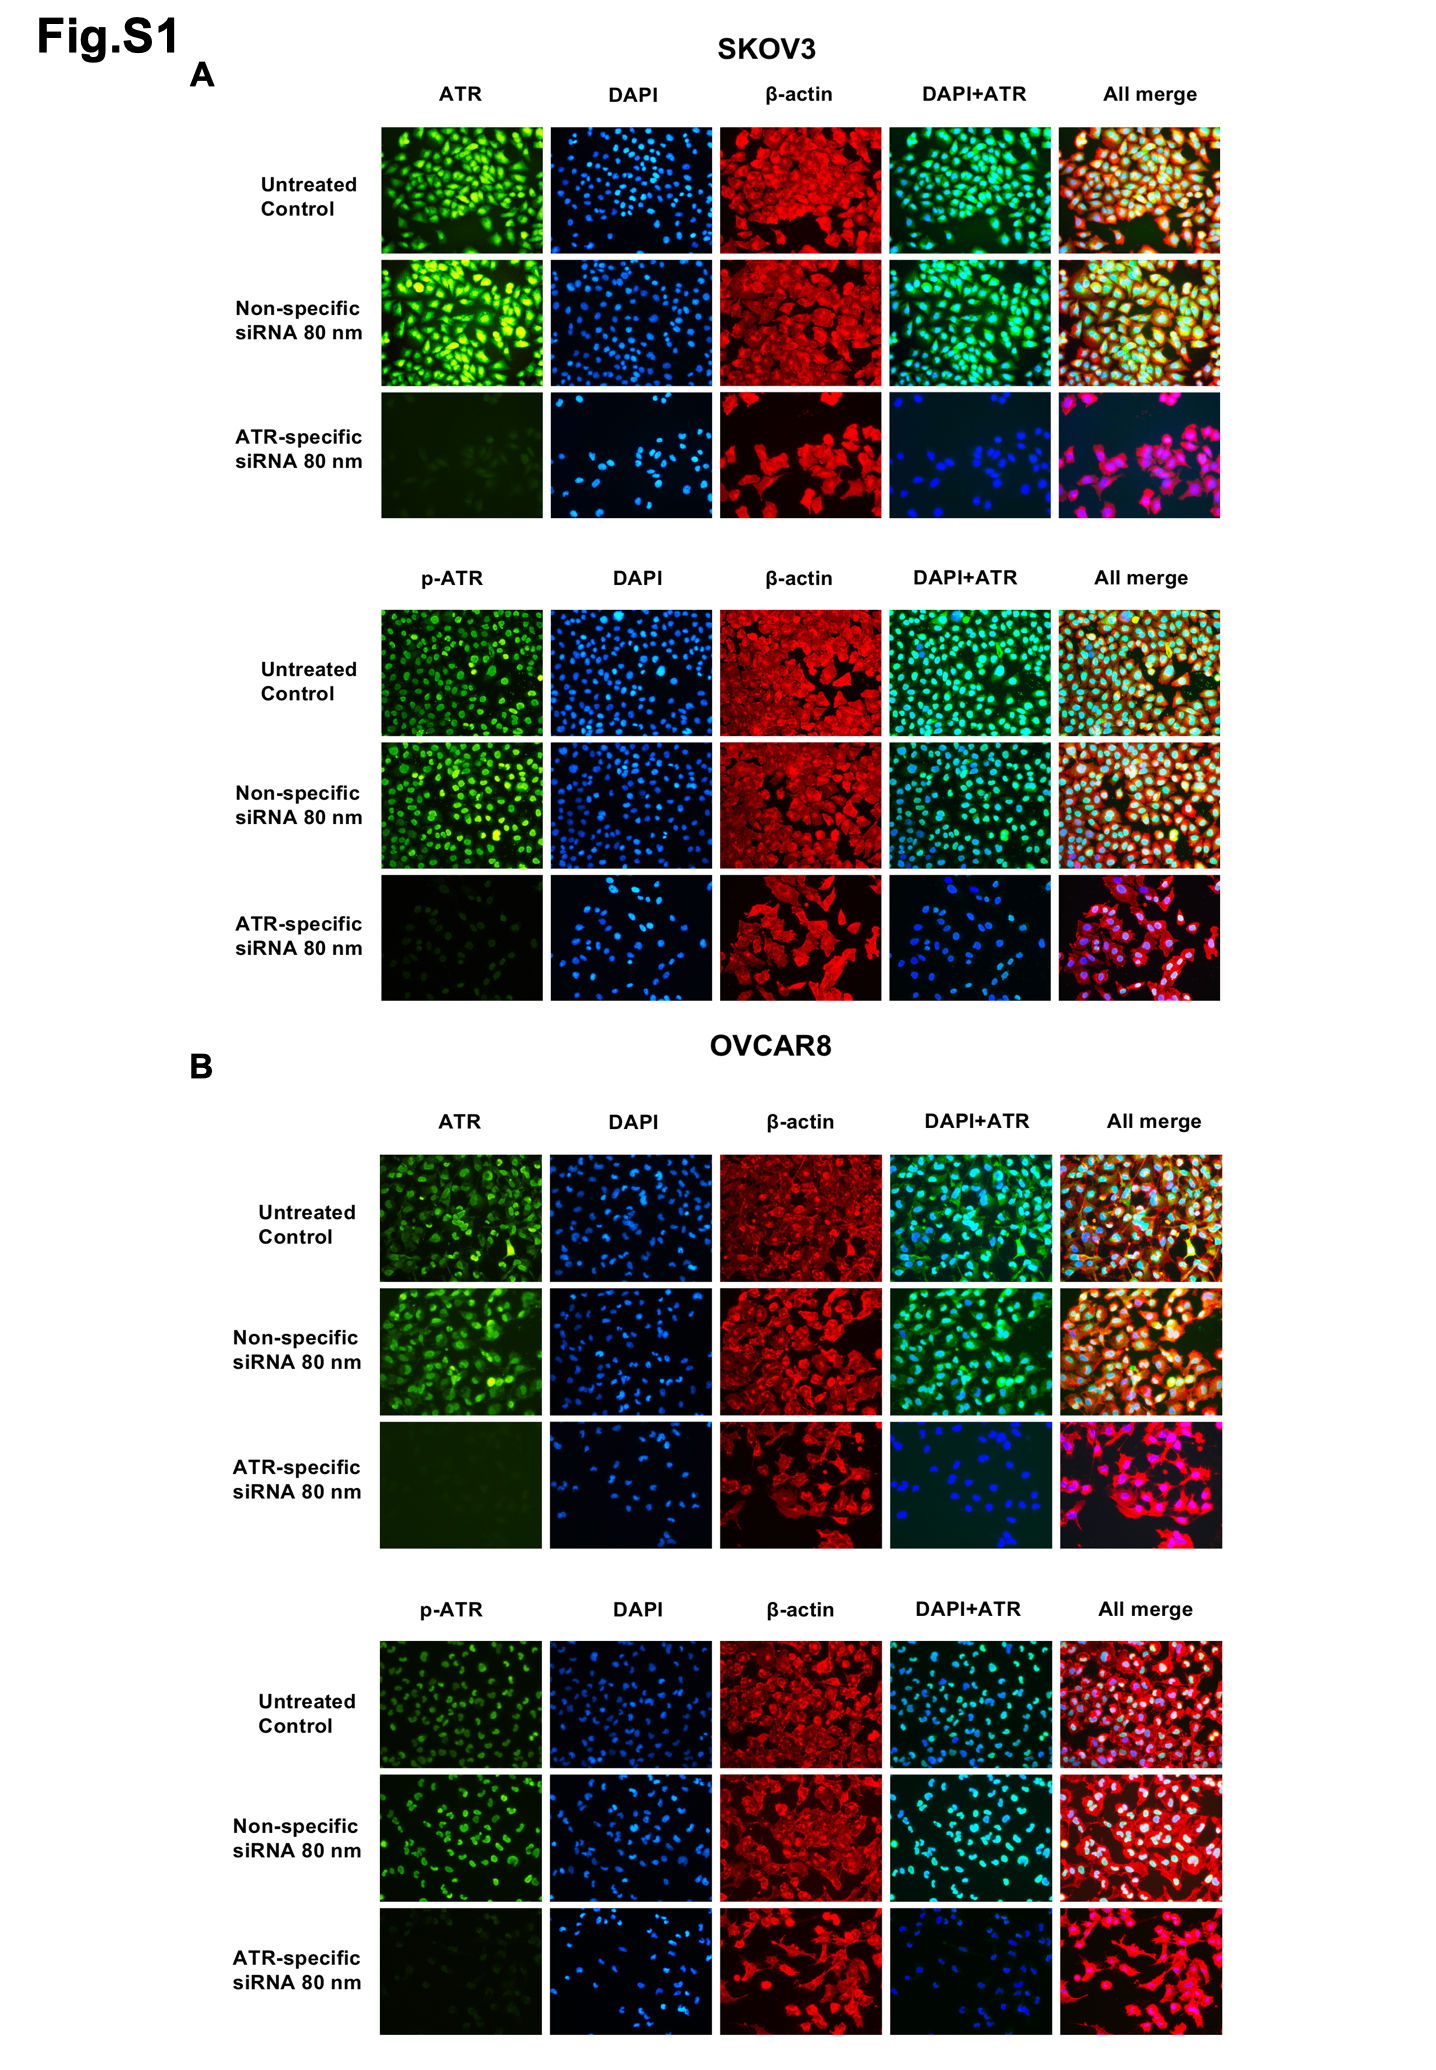
Immunofluorescence
The ovarian cancer cell lines were seeded into 24-well plates at a concentration of 2 × 10⁴ cells/ml for 72 hours and fixed in 4% paraformaldehyde for 15 minutes at room temperature. Following fixation, the cells were washed in 1× PBS (3 times, 5 minutes each), prior to permeabilization with 100% ice-cold methanol in a -20°C refrigerator for 10 minutes. After blocking with 5% goat serum for 1hour, the cells were then incubated with the primary antibody ATR (1:200, Cell Signaling Technology), p-ATR (1:200, Abcam) and β-Actin (1:1000, Sigma-Aldrich) overnight at 4°C in a humidified chamber. The next day, we removed the primary antibody solution and rinsed before incubation with fluorochrome-conjugated secondary antibody for 1 hour at room temperature in the dark. The secondary antibodies Alexa Fluor 488 (Green) conjugated goat anti-rabbit antibody and Alexa Fluor 594 (Red) conjugated goat anti-mouse antibody were purchased from Invitrogen (NY, USA) and diluted in 5% goat serum at 1:1000. Finally, they were washed and incubated with a DAPI solution (1:10 000) for 5 minutes. Pictures were obtained with a Nikon Eclipse Ti-U fluorescence microscope (Diagnostic Instruments Inc., NY, USA) equipped with a SPOT RTTM digital camera.
siRNAs and in vitro siRNA transfection
We used synthetic ATR siRNA to silence ATR expression in ovarian cancer cells. The ATR siRNA (target sequence: 5'-GAUCCUACAUCAUGGUACA-3'; antisense:5'-UGUACCAUGUGUAGG AUC-3') was purchased from MilliporeSigma and the non-specific negative control siRNA (Catalog #: AM4637) was purchased from Applied Biosystems. The siRNAs were mixed with antibiotic-free Opti-MEM medium (Life Technologies) and Lipofectamine RNAiMax (Thermo Fisher Scientific). The transfection mix was incubated for 30 minutes at room temperature and then added to the cells at a concentration of 10, 30, and 80 nM. The ovarian cancer cell lines Skov3 and OVCAR8 were prepared at a concentration of 2×10⁴ cells/ml for siRNA and methyl thiazolyl tetrazolium (MTT) assay in 96-well plates and 5× 10⁴cells/ml for protein extraction in 12-well plates. Non-specific siRNA (80 nM) was used as a negative control. Transfection of siRNA and the MTT assay were performed as previously described[25].
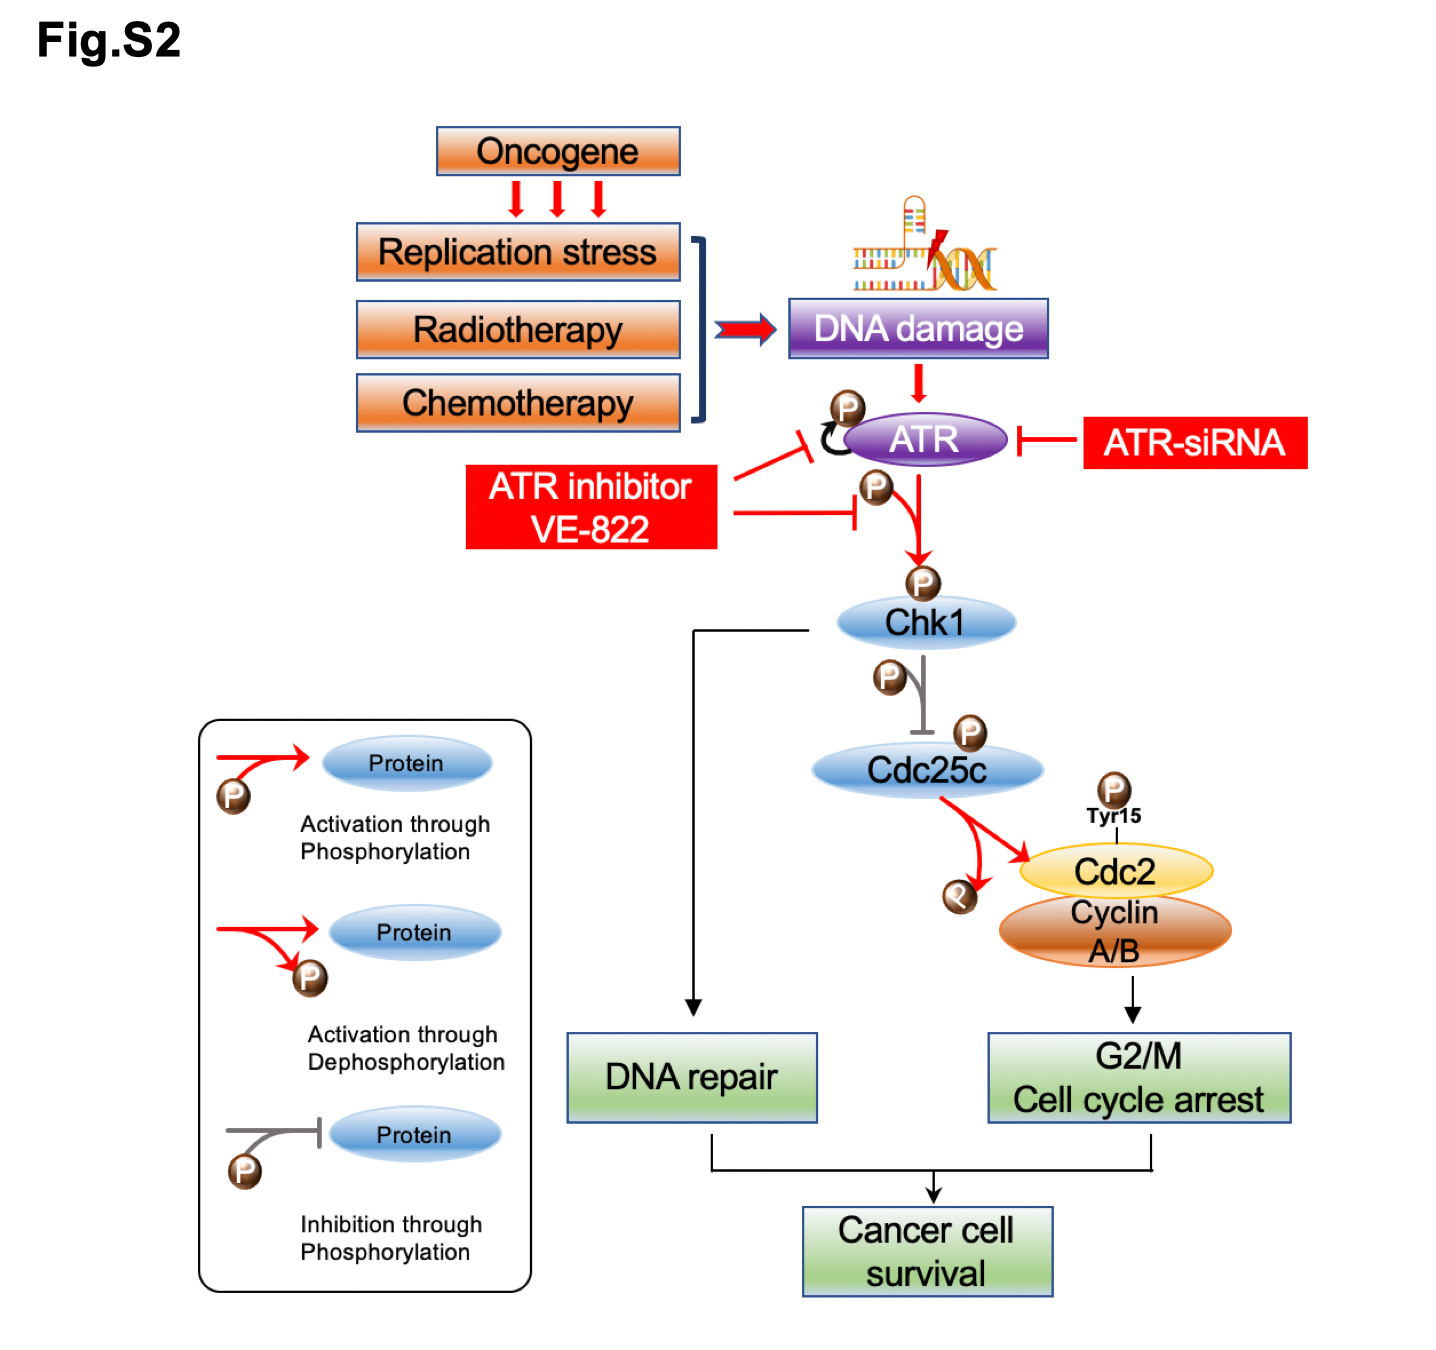
Inhibition of ATR by inhibitor VE-822
The role of ATR in ovarian cancer cell growth and proliferation was further accessed by ATR inhibitor VE-822 (Selleck Chemicals, Houston, TX, USA). The development of specific and potent ATR inhibitors has been historically challenging due to the large size of the ATR protein (310 Kda). The application of a recombinant ATR protein for in vitro kinase assay has revealed several compounds which target ATR without affecting the ATM or DNA dependent protein kinase catalytic subunit (DNA- PKcs). One of the most significant compounds discovered was VE-821, which has since been pharmacologically modified and enhanced to VE-822 and featured in clinical trials as VX-970 (also as known as M6620). VE-822 attenuates the ATR signaling pathway and reduces tumor cell survival via blockade of pChk1 Ser345[28]. In our work, we cultured the ovarian cancer cell lines Skov3 and OVCAR8 (2×10⁴ cells/ml) in 96-well plates with VE-822 at increasing concentrations over 5 days in MTT cell proliferation assays. 5×10⁴ cells/ml were also grown in 12-well plates with VE-822 at concentrations of 0.05,0.1,0.5,1.0 μM/ml and their protein content was subsequently extracted for Western blot analysis as previously described[25].
Clonogenic assay
The clonogenic assay is a well-established in vitro method for evaluating cell viability and proliferation. The ovarian cancer cell lines Skov3 and OVACAR8 were seeded into 12-well plates at 100 cells per well and treated with increasing VE-822 concentrations (0, 0.1, 0.5 μM) then incubated at 37 °C for 15 days. The suspension was aspirated and the colonies were fixed with methanol for 10 minutes then washed three times with 1×PBS before being stained with 10% Giemsa stain (Sigma-Aldrich) for 20 minutes. Finally, the cell colonies were gently washed with flowing water and dried. Pictures were obtained using a digital camera (Olympus, Tokyo, Japan).
Three-dimensional (3D) cell culture
The 3D cell culture system mimics the in vivo environment and serves as a unique platform to evaluate how ATR is related to in vivo ovarian cancer cell growth. Consistent with the manufacturer’s protocol, the ovarian cancer cell lines Skov3 and OVCAR8 were mixed with 3D VitroGelTM (TheWell Bioscience Inc., NJ, USA) then established in 24-well plates at a density of 1× 10⁴ cells/ml. Each well was covered with the same volume of cell culture medium. The experimental group received an additional treatment of VE-822 0.1 μM/ml. The plates were then placed in a 37 °C incubator with a humidified 5% CO2 atmosphere; the covering medium was changed every 48 hours. Images of the cell spheroids were obtained with a Nikon microscope every three days. After 15 days, calcein-AM (Thermo Fisher Science) was applied to stain the tumor spheroids, and images were obtained with an Eclipse Ti-U fluorescence microscope (Nikon) equipped with a Spot RT digital camera.
Statistical analysis
GraphPad Prism v. 8.0 software and SPSS 24.0 software were used for statistical analysis. Multiple comparisons were performed with one-way ANOVA tests. Analysis of the difference in survival was analyzed with Kaplan-Meier plots and log-rank tests. The relationship between p-ATR expression and clinicopathological parameters in ovarian cancer patients was evaluated by the x2 test. The prognostic factors related to overall survival were analyzed with a Cox proportional hazard regression model. Only those factors that had statistical significance with univariate survival analysis (p < 0.05) were employed in Multivariate analysis. The effects of ATR siRNA and inhibitor were evaluated by one-way ANOVA. In all cases, the results are presented as mean ± SD, and p <0.05 was considered statistically significant.