Animals and Spinal Cord Injury Model
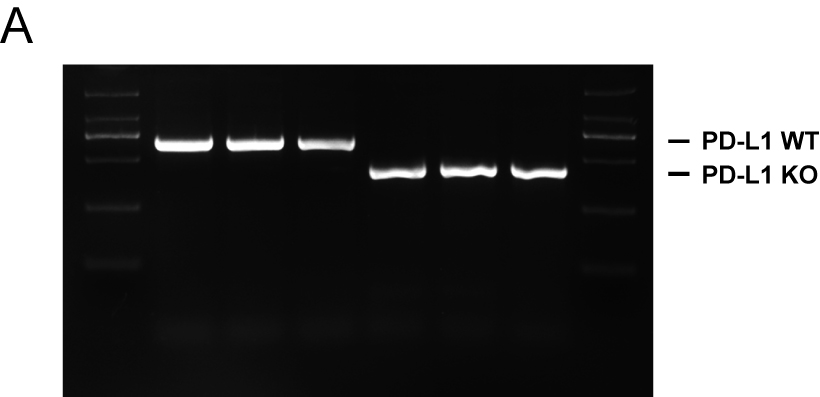
PD-L1 knockout (KO) male mice (C57BL/6 background) were purchased from Shanghai Model Organisms Center (Shanghai, China), and PD-L1 Wild-type (WT) male mice with identical genetic backgrounds were used as the controls. Genotyping was confirmed by PCR of tail DNA samples (Fig. S1A). All animal experiments were performed in accordance with guidelines established by the Naval Medical University. Male C57BL/6 mice, 8-10 weeks old, were used to generate the SCI model as previously described [24]. Briefly, under isoflurane gas anesthetic and sterile conditions, a T10 laminectomy was performed to expose the underlying thoracic segment of spinal cord. Then, a weight-drop device (68097, RWD, CA, USA) was used to create a moderate injury by dropping a 5g weight rod from a height of 5cm onto the exposed dorsal surface of the spinal cord. The overlying muscles and skin were then closed separately. Sham mice were subjected to laminectomy without SCI. One hour after SCI surgery, PD-L1 antibody (100ng in 20μL normal saline, NS) (clone 10F.9G2; Biolegend, California, USA) and PD-L1 protein (100ng in 20μL NS) (ab216261, Abcam, Burlingame, CA) were administered by lumbar puncture injection with a 30G sterilized Hamilton syringe in approximately 1 mm rostral and caudal to the lesion epicenter. The bladders of mice were manually voided two times per day until a reflex bladder was established.
Basso Mouse Scale (BMS) behavioral analysis
Basso Mouse Scale was designed to evaluate the recovery of motor function of hindlimb following SCI. Mice were recorded in an open field and two independent raters were blinded to the groups of treatment. Multiple aspects of locomotion were accessed including ankle movements, trunk position and stability, stepping pattern and coordination, paw placement and tail position, with a minimum score of 0 (no ankle movement) to a maximum score of 9 (complete functional recovery). The test was carried out pre-operatively and on post-operative days 3, 7 and then weekly until day 28.
The Louisville Swim Scale
To obtain information about locomotor performance in the absence of cutaneous and proprioceptive input from the limbs to the spinal cord, the Louisville Swim Score (LSS) was used as previously described [24]. In brief, mice were trained for several days, until they had learned to swim from one end of a water-filled glass tank to a visible escape platform at the opposite end. Swimming performance was evaluated including forelimb dependency, hindlimb alternation, sagittal and coronal balance, tail position and body angle, with a score of 0 to 15. Each mouse was tested twice in a double-blind manner.
Mechanical Allodynia and Thermal Hyperalgesia
The Von Frey filament test was used to assessed the mechanical allodynia of mice after SCI and investigators were blinded to the genotype and treatment of the groups. Before behavioral testing, individual mouse was placed in glass chamber on an elevated wire mesh grid and acclimated to the testing cage for 1h. Then, von Frey filaments (range from 0.04 g to 2.0 g) were applied to the lateral plantar surface of each hind paw to measure the mechanical threshold. Mechanical nociceptive thresholds were determined as the lowest filament force that resulted in a positive withdrawal response in greater than 50% of the trials.
After 1 hour of acclimation to the test chamber, thermal nociceptive thresholds were evaluated by measuring the latency of paw withdrawal (PWL) in response to a radiant heat source. In brief, mice were placed in Plexiglas boxes on an elevated glass plate under which a radiant heat source was applied to the surface of the hind paw. The temperature to elicit a hind paw shake or a paw lick was recorded.
Electrophysiology
Motor-evoked potentials (MEPs) of mice were recorded by electromyography to analyzed functional recovery more objectively. Mice were firstly anesthetized with halothane (3% induction, 1–1.5% maintenance) in oxygen (0.4 L/min) and nitrogen (0.6 L/min). After that, a stimulation electrode was placed dorsally on the rostral ends of the surgically exposed spinal cord to elicit locomotor episodes, the recording electrode was placed in the biceps femoris flexor cruris, the reference electrode was placed over the distal tendon of the muscle in the hindlimb, and the ground electrode was placed subcutaneously. Electrical stimulation (0.5 mA, 0.5 ms, 1 Hz) was applied and peak-to-peak amplitude of MEPs was used to measured nerve conduction function.
Magnetic resonance imaging (MRI)
Mouse MRI experiments were performed on a small animal MRI system (Bruker BioSpec 7T/20 USR, Germany). The sequence protocol included T2-weighted, 256×256 matrix, slice thickness 1 mm, intersection gap 1 mm, echo time (TE)/repetition time (TR) 27/3000 ms, RARE factor 16, and flip angle 90°. T2-weighted images were acquired in the sagittal and axial planes by the ParaVision 6.0.1 (Bruker BioSpec, Germany). The area of the lesioned spinal cord containing hyperintense signal was first manually traced by a blinded observer. A computer-aided software (FireVoxel; CAI2R, New York University, NY) was used for axial images to assess and compare the evolution of hyperintense signal and lesion volume obtained by adding the individual slice areas and multiplying by 1.0 mm slice plus gap thickness. For quantitative analysis, the results were calculated by the intensity ratio for the signal of spinal cord lesion to normal cord far from injury area.
Western blotting
Mouse spinal cord tissues (epicenter ± 0.3 cm) and DRG samples were collected and homogenized with 10 strokes of a homogenizer at 4°C in protein extraction buffer. Subsequently, protein concentrations were determined by the BCA method, and equal amounts of proteins were separated by 10% SDS-PAGE gel electrophoresis and transferred onto polyvinylidene fluoride (PVDF) membranes. After blocking with 5% skimmed milk or 5% Bovine Serum Albumin (BSA), the membranes were incubated overnight at 4 °C with the following corresponding primary antibodies: anti-PD-L1 (1:1000, ab213480, abcam), anti-TRPV1 (1:1000, 508564, ZEN BIO, Chengdu, China), anti-iNOS (1:1000, ab178945, abcam), anti-Arg1 (1:1000, 16001-1-AP, proteintech, Wuhan, China), anti-β-actin (1:1000, ab123946, abcam), anti-ERK (1:1000, 4695, CST, Massachusetts, USA), anti-pERK1/2 (1:1000, 4370, CST), anti-p38 (1:1000, 8690, CST), anti-pP38 (1:1000, 4511, CST), anti-JNK (1:1000, 9252, CST), anti-pJNK (1:1000, 9255, CST). After washing and incubating with species-matched secondary antibodies (1:5000) at RT for 2 h, immunoreactive bands were visualized using ECL reagents (PE0010, Solarbio, Beijing, China) and the density of protein was quantified by the ImageJ (National Institutes of Health, Bethesda, MD, USA)
Quantitative PCR (qPCR) analysis
Total RNA of spinal cord was isolated using the Trizol reagent (Takara, Dalian, China) and subsequently transcribed into cDNA by HiScript II Q RT SuperMix for qPCR (R122-01, Vazyme, Nanjing, China). Next, qPCR was performed using AceQ qPCR SYBR Green Master Mix (Q111-02, Vazyme) in a 7500 real-time PCR system (Applied Biosystems, Inc., USA). The primer sequences are listed in Table S1. The mRNA levels of target genes were normalized to GAPDH expression. Relative quantification of gene expression was performed by the 2−△△CT method.
Histology and immunofluorescence
At different time points, mice were transcardially perfused with 0.9% saline followed by 4% paraformaldehyde, the spinal lesion segments and DRG (L4 and L5) were removed and fixed overnight in 4% paraformaldehyde. After dehydration in graded sucrose solutions (15–30%), tissues were immersed in OCT and cut into 10-μm-thick sections for subsequent experiments. For immunofluorescence staining, non-specific binding was blocked with 10% BSA for 30 min. Then histological sections were incubated overnight at 4 °C with the following primary antibodies: anti-NF200 (1:200, ab4680, abcam), anti-GFAP (1:500, ab7260, abcam), anti-TRPV1 (1:200, 508564, ZEN BIO), anti-iNOS (1:200, ab15323, abcam), anti-ARG1 (1:200, 16001-1-AP, Proteintech), anti-IBA-1(1:200, MA5-27726, Thermo Fisher), anti-CD11b (1:200, ab8878, abcam), anti-PD-L1 (1:200, ab213480, abcam), anti-Neuron (1:300, ab177487, abcam), anti-CD31(1:200, GB11063-2, Servicebio), anti-OLIG2 (1:200, ab109186, abcam), followed by secondary antibodies for 2 h at room temperature. The nuclei were then stained with DAPI, and images were obtained using a confocal microscope (LSM710, Zeiss, Heidenheim, Germany).
TUNEL assay
Apoptotic cells were detected with the TUNEL Apoptosis Assay Kit (T2190-50 T, Servicebio) according to the manufacturer’s instructions. The nuclei were stained with DAPI, and images were acquired by a confocal microscope (LSM710, Zeiss, Heidenheim, Germany).
Isolation of CD11b+ macrophages/microglia
Mice were humanely sacrificed by CO2 and perfused with ice-cold PBS. The spinal columns were dissected and the spinal cord isolated quickly from the vertebrae. Single cell suspensions were prepared using the MACS Neural Dissociation Kit (130-107-677, Miltenyi, Auburn, CA) according to manufacturer’s instructions. Myelin was removed and cell suspensions were incubated with CD11b microbeads (130-093-634, Miltenyi) and placed in the magnetic field of a MACS separator. The negative fraction (flow through) was collected, and the column was washed three times with MACS buffer.
Flow cytometry analysis
To investigate the polarization of macrophages/microglia, single cell suspensions from spinal cord were collected and CD11b-selected cells were stained using anti-CD11b-FITC (1:200, 561688, BD), iNOS-PE (1:200, 61-5920-82, Thermo), and CD206-APC (1:200, 17–2061-82, Thermo) for 30 min on ice in the dark. Cells were analyzed by flow cytometry (FACSVerse 8, BD) and data analysis was performed using the FlowJo software (Version 7.6.1, Treestar, Ashland, OR, USA)
Statistical analyses
Data analysis was conducted with SPSS 18.0 statistical software (Chicago, USA), and the obtained data were presented as mean ± standard deviation (SD) values. One-way or two-way analysis of variance (ANOVA) followed by the Student–Neuman–Keuls post hoc test was used for analysis if comparisons were more than two groups, and unpaired 2-tailed Student’s t tests were used for two-group comparisons. When p < 0.05, the differences were considered to show statistical significance.