Figure 1 shows the relation between the carboxyl content obtained via the titration and TBO adsorption methods for CNWs, CCNWs with different degrees of oxidation, and CNW/CCNW100 mixtures containing various composition ratios. It should be noted that the titration measurements were not directly conducted for the series of CNW/CCNW100 mixed samples; instead, their “titration” values were calculated using the titration values of CNW and CCNW100 based on their mixing ratios. Figure 1 clearly indicates that the values obtained using the dye adsorption methods were consistent with those by titration. The developed method exhibited excellent reproducibility, as indicated by the narrow deviations in Fig. 1, which indicates sufficiently narrow deviations to be hidden by the symbols. Although previous studies performed the dye adsorption processes for the surface carboxyls under buffered or conditioned pH experimental conditions (Davidson 1948; Fardim et al. 2005; Rödiger et al. 2011; Sanoet al. 1993; Tiraferri and Elimelech 2012; Wilson and Mandel 1961), the results of this study indicated that quite satisfactory results could be obtained (for the stoichiometric adsorption of TBO on the surface carboxyls) without an addition of electrolytes. The usage of electrolytes should be avoided because the presence of some types of electrolytes suppressed the dye adsorption process, affecting the experimental results (Soedjak 1994). Figure 1 indicates the results of similar dye adsorption measurements performed under “pH = 1” conditions (see Supplementary Information for details); here, the calculated carboxyl content results were almost negligible at pH = 1 under the employed measurement conditions.
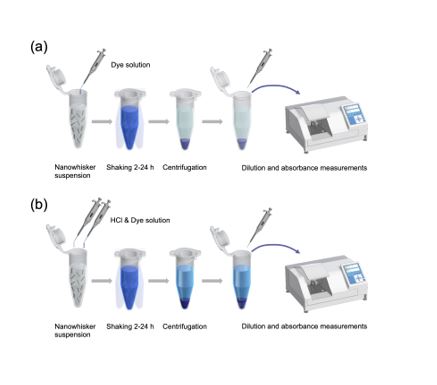
At pH = 1, the TBO adsorption onto the surface carboxyls, which are present in their acidic form (–COOH), is suppressed. In contrast, the surface sulfate groups are expected to still interact with TBO under these conditions because they are dissociated. Therefore, the sulfate and carboxyl contents can be estimated by focusing on the differences in the dye adsorption values obtained under “neutral water” and “pH = 1” conditions. Thus, the dye adsorption measurements were performed both in water and at pH = 1 for several samples obtained via sulfuric acidmediated hydrolysis under various hydrolyzing conditions containing different amounts of surface sulfate/carboxyl groups (Table 1).
The content of the surface sulfate/carboxyl groups in the nanocellulose materials was estimated based on the protocol described in the Supplementary material (also see Table 1). The values obtained via TBO adsorption were consistent with those obtained using the conventional titration technique for majority of the tested samples. However, there were some entries exhibiting slight differences in their results. This variation seems to be observed in samples with low total surface sulfate/carboxyl group contents. However, it is still difficult to obtain a consistently reasonable explanation for this variation. All the results presented in Table 1 exhibited general agreement between the two quantitative methods within a comparable order of magnitude, indicating that the TBO adsorption method could be applied for the quantification of the surface sulfate/carboxyl groups of nanocellulose materials with high accuracy and reproducibility.
Table 1
Surface sulfate and carboxyl group contents of various SCNWs, as determined via the titration and TBO adsorption methods, and the starting cellulose materials and hydrolysis conditions for each SCNW.
| SCNWs | Cellulose starting materials | Hydrolysis conditions | Sulfate group content (mmol/g) | Carboxyl group content (mmol/g) |
| Temperature (°C) | Time (min) | by titration | by TBO adsorption | by titration | by TBO adsorption |
| C-70C20M | Cotton powder | 70 | 20 | 0.231 | 0.171 ± 0.000 | 0.027 | 0.105 ± 0.001 |
| C-45C30M | Cotton powder | 45 | 30 | 0.130 | 0.065 ± 0.004 | 0.050 | 0.058 ± 0.004 |
| C-45C60M | Cotton powder | 45 | 60 | 0.112 | 0.133 ± 0.001 | 0.036 | 0.048 ± 0.004 |
| C-50C60M | Cotton powder | 50 | 60 | 0.181 | 0.209 ± 0.007 | 0.042 | 0.020 ± 0.004 |
| C-60C60M | Cotton powder | 60 | 60 | 0.271 | 0.257 ± 0.005 | 0.069 | 0.012 ± 0.007 |
| W-45C60M | MCC | 45 | 60 | 0.273 | 0.175 ± 0.003 | 0.058 | 0.070 ± 0.005 |
| W-70C10M | SBKP | 70 | 10 | 0.258 | 0.264 ± 0.004 | 0.057 | 0.084 ± 0.007 |
The TBO adsorption method offers another advantage over the traditional titration method because it facilitates the quantification of carboxyl content in the presence of other weakly acidic groups such as mercapto groups, which is considerably difficult to achieve using the titration method. Previously, surface mercapto groups were introduced onto the PEG-grafted CCNWs by grafting 2-aminoethanethiol into the surface carboxyl groups (Urata and Araki 2020). It was difficult to determine the carboxyl and mercapto contents separately by titration, because both functional groups were weakly acidic. Therefore, it was almost impossible to differentiate the results obtained using the grafted 2-aminoethanethiol and those obtained using the residual carboxyl groups. Because these two functional groups had different pKa values, i.e., 3–4 and 11–13 for the carboxyl and mercapto groups, respectively, it was theorized that maintaining the pH of the system within a defined range (e.g., approximately 7) would promote the preferential dissociation of one group (in this case, the carboxyls) over the other group. At pH 7, the mercapto groups remain protonated, whereas the carboxyl groups are dissociated. Thus, TBO would only adsorb onto the carboxyls under pH 7, whereas the mercapto groups would remain unaffected.
This strategy was verified by mixing the CCNW50 sample with various amounts of silica containing surface –SH groups and subjecting the mixtures to both the quantitative methods. The results are summarized in Table 2. The values obtained via the titration method are listed as “weakly acidic group contents” and not as “carboxyl contents.” The conductometric titration curves of these samples indicated that there were only two inflection points that corresponded to the neutralization (end point) of the strongly and weakly acidic groups. The former corresponded to the known concentration of HCl added prior to titration, whereas the latter indicated the sum of the carboxyl and mercapto groups because of no differentiation within the weakly acidic region. Based on Table 2, the amount of weakly acidic groups quantified via titration was not equal to the sum of the carboxyl and mercapto groups. For CCNW-S5.00, which was the sample with the highest –SH content, the value was lower than that obtained for the carboxyl content of CCNW50 even after the addition of mercapto groups. Although a reasonable explanation for this observation has not yet been obtained, Table 2 indicates the unnegligible effect exerted by the mercapto groups on carboxyl quantification. The carboxyl content values obtained via TBO adsorption were consistent with the results obtained using the CCNW50 sample regardless of the mixing ratios because there was no interference due to the presence of the mercapto groups. These observations indicate the superiority of the TBO adsorption method because it facilitated accurate carboxyl quantification even in the presence of mercapto groups, which was an impossible task when using the titration method.
Table 2
Carboxyl or weakly acidic group contents determined via titration or TBO adsorption for different mixing ratios of CCNW50 and SiliaMetS® thiol .
| Sample | Weight ratio of CCNW50: SiliaMetS® Thiol | Mixtures for titration measurements | Mixtures for TBO adsorption measurements | Weakly acidic group contents by titration (mmol/g) | Carboxyl contents by TBO adsorption (mmol/g) |
| CCNW50 suspension (mL)a | SiliaMetS® thiol (mg) | CCNW50 suspension (mL) | SiliaMetS® thiol (mg) |
| CCNW50 | 1:0 | 50 | 0 | 0.5 | 0 | 1.107 | 1.028 ± 0.008 |
| CCNW-S1.00 | 1:0.2 | 50 | 50 | 10 | 1.00 | 1.126 | 0.992 ± 0.004 |
| CCNW-S2.80 | 1:0.5 | 50 | 125 | 10 | 2.80 | 1.169 | 1.007 ± 0.007 |
| CCNW-S5.00 | 1:1 | 50 | 250 | 10 | 4.96 | 0.942 | 1.001 ± 0.007 |
| a The solid content of CCNW50 was 5 mg/mL for all mixtures. |
Finally, the changes in the adsorbed amount of TBO in the given mixing period were examined. Here, aliquots were sequentially pipetted from one stock reaction vessel at a given time, followed by the analysis of each aliquot to determine the adsorption amounts and the apparent carboxyl content with respect to the reaction/mixing time. If the TBO adsorption required considerable reaction/mixing times, the initial adsorption process became slower with a gradual increase as time progressed, affecting the apparent carboxyl content. Figure 2 showed that the apparent carboxyl content values were similar to the actual carboxyl content values 30 min after mixing and that the value remained constant for a further 24 h. The carboxyl content values after the 24h TBO adsorption process are expressed using the dotted lines and numbers in Fig. 2. The results showed that the interactions between the surface carboxyl groups and TBO were complete after 30 min. Although all of the TBO adsorption results in the above-mentioned studies were obtained after overnight treatment, Fig. 2 clearly indicates that a 2h mixing time is sufficient for the stoichiometric adsorption of TBO.
Carboxyl quantification utilizing the TBO adsorption method developed in this study exhibited various advantages that the titration protocol could not offer. The TBO method yielded reproducible, quantitative results using trace samples of 0.5–2.5 mg of solid per measurement, and the values obtained were comparable with those obtained via titration. Unlike the lengthy, laborious efforts necessary for the titration method, the TBO adsorption required just a simple mixing of the samples with the dye solution and a subsequent 2h shaking process that could be easily automated. The simple, rapid post-procedure protocols of dilution and measurement using a common and inexpensive UV–Vis spectrophotometer (unlike the highpriced automatic titrator) enabled the highthroughput analysis of large numbers of samples. Several tens of measurements can be conducted within a day, which was totally impossible to achieve using the titration method. Further, the TBO adsorption method facilitated the separate quantification of strongly and weakly acidic groups, and the targeted carboxyl quantification could be performed in the presence of different weakly acidic moieties.
The nature of TBO adsorption indicated that all the stages, ranging from the mixing of the samples with the dye solutions to the application of the measurement protocols, provided the results automatically and arithmetically, thereby making the introduction of a human error into the entire process difficult. On the other hand, the titration method is susceptible to biases because the interpretations of the results were influenced by the operator. The author anticipate that the TBO adsorption method will find widespread applicability for the rapid and precise quantification of the surface functional groups in nanocellulose materials.
Supplementary Information
Full experimental details, including the starting materials and reagents as well as protocols for conducting the TBO adsorption measurements “in water” and under “pH = 1,” are reported in the Supplementary material. An example of the calibration curves indicating the relations between TBO concentrations and the absorbance at 628 nm both “in water” and in “pH = 1” are shown in the Supplementary Information.
The following files are available free of charge.
An Excel worksheet for automatic calculation of surface carboxyl/sulfate groups (Worksheet for dye adsorption.xlsx).
These materials are available free of charge via the Internet.