Validating a transnational fracture treatment registry using a standardized method
Validating a transnational fracture treatment registry using a standardized method
Frese, Jasper; UKSH Campus Lübeck, Orthopaedics and Traumatology (corresponding author)
Gode, Annalice; UKSH Campus Lübeck, Orthopaedics and Traumatology
Heinrichs, Gerhard; UKSH Campus Lübeck, Orthopaedics and Traumatology
Will, Armin; UKSH Campus Lübeck, Stabsstelle Informationstechnologie
Schulz, Arndt- Peter; Klinik für Orthopädie und Unfallchirurgie, BG Klinikum Hamburg
Key words: Data validation, Registry, quality assessment, scoring, data quality
Abstract
Aim
Subsequent to a three-month pilot phase, recruiting patients for the newly established BFCC (Baltic Fracture Competence Centre) transnational fracture registry, a validation of the data quality needed to be carried out, applying a standardized method.
Method
During literature research, the method of “adaptive monitoring” fulfilled the requirements of the registry and was applied. It consisted of a three-step audit process; firstly, scoring of the overall data quality, followed by source data verification of a sample- size, relative to the scoring result and finally, a feedback to the registry, on measures to improve data quality. Statistical methods for scoring of data quality and visualisation of discrepancies between registry data and source data were developed and applied.
Results
Initially, the data quality of the registry scored as medium. During source data verification, missing items in the registry, causing medium data quality, turned out to be absent in the source as well. A subsequent adaptation of the score evaluated the registry’s data quality as good. It was suggested to add variables to some items, in order to improve the accuracy of the registry.
Discussion
The method of adaptive monitoring had only been applied once before by Jacke et al. with a similar improvement of the scoring result, following the audit process. Displaying data from the registry in graphs helped finding missing items as well as discovering issues with data- formats. Graphically comparing the degree of agreement between registry and source data allowed to discover systematic faults.
Conclusions
The method of adaptive monitoring gives a substantiated guideline for systematically evaluating and monitoring a registry’s data quality and is currently second to none. The resulting transparency of the registry’s data quality could be helpful in annual reports, as published by most major registries. As the method has been rarely applied, further successive applications in established registries would be desirable.
Background
From November 2017 until February 2018, a transnational fracture registry with a complication module was piloted at the Lübeck University Hospital (UKSH Campus Lübeck, Germany) within the framework of the EU (European Union) funded BFCC (Baltic Fracture Competence Centre) Project21. A novel classification for complications during fracture treatment was applied and a follow-up letter was shipped out to all registered patients, 6 months post- treatment. Subsequent to the registration and follow-up phase, an assessment of the registry’s data quality needed to be carried out. Assessment and monitoring of a registry’s data quality are crucial to make it a reliable tool to be used19, as well as to reinforce trust into the research conducted24. As a transnational registry, data quality assessment needed to follow a standardized procedure to allow comparability between data entering centres. Nonnemacher et al.18 had developed the method of “adaptive monitoring” that fulfilled the requirements by the registry. The following article documents its application in detail and proposes a statistical method for finding systematic faults during source data verification.
Materials
Setting and Data Capture
During the pilot phase for the BFCC fracture registry at the Lübeck University Hospital from mid-November 2017 to mid-February 2018, physicians enrolled 238 patients with fresh fractures, meaning less than a week old and not treated prior to admission, of extremities and the pelvis, of any type. Exclusively adult patients which had understood the nature of the study and consented to be entered into the registry, were included. A distinguishing feature was the registration of adverse events, here synonymous to complications. Data capture was carried out manually, using registration forms which were later entered into the database by study nurses. The registry was web-based and had its own IT (information technology) infrastructure, providing high security standards by using browser client security certificates, pseudonymization of patients, and separate storage of patient and medical data by a trusted third party. The software used was Centraxx by Kairos13. Furthermore, six months post-treatment, patients were contacted via mail and asked in a pseudonymized follow-up questionnaire, whether they were satisfied with their treatment, had experienced any complications, and if so, how defacing they were. The questionnaire was sent back to the hospital by postage-paid mail or as a scan to an e-mail address.
Finding a method for data quality assessment
Initially, an extensive literature research was conducted using PubMed2, MEDLINE, Google Scholar6 and Medscape23, for publications containing the following keywords: registry, data validation, data quality, standardized, method. Further, reports of established registries, including the in-hospital Stavanger fracture and dislocation registry17, Vascular Registry of Denmark15, prospective registry for surgical complications in the Surgical Department of St. Elisabeth’s Hospital in Tilburg, Netherlands22, Swedish Fracture Registry12, Swedish Cancer Registry8, Australian Orthopaedic Association National Joint Replacement Registry7, Danish Cancer Registry5, German Multiple Sclerosis Registry4, and Cancer Registry of Norway14 were studied regarding their methods, parameters investigated and results of data quality validation. No two registries had entirely matching approaches to data validation and no standardized systematic, using transparent and reproducible methods could be identified.
Published within the German Institute for Population Medicine, a method by Nonnemacher et al.18 was found, suggesting a standardized approach to data validation, called adaptive monitoring. The three-step audit process consisted of firstly scoring of the overall data quality, followed by source data verification (SDV) of a sample- size relative to the scoring result and finally, a feedback to the registry, on measures how to improve data quality. The application of this method to the BFCC- registry was documented in detail.
Methods
Scoring data quality and conducting a source data verification
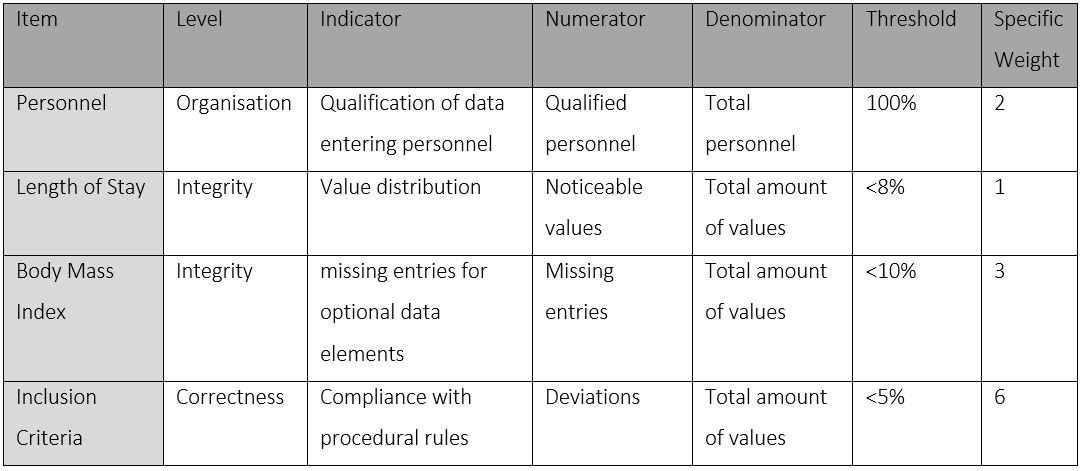
To determine the score for the evaluation of the data quality, all registered patients were included in the calculation. Three levels of data quality were investigated: organization, integrity, and correctness. Each level had indicators assigned to it, which were evaluated according to a predefined threshold for sufficient data quality: on the level of organization, the qualification of data entering personnel was evaluated; on the level of integrity, the optional data elements height and weight were searched for missing entries. Here, the body mass index (BMI) was calculated and the proportion of non-calculable elements identified. Further, value distributions of mandatory elements were investigated. Here, the length of stay was calculated and analysed using the graphical method geom_density for the package ggplot2 in R Statistics1, with the length of stay in days on the x-axis and the density of patients on the y- axis. On the level of correctness, measurable elements of the inclusion criteria, age of the fracture and patient age at the time of inclusion into the study, were checked. For investigating the fracture age, the same method as for analysing the length of stay, was applied. Indicators had specific thresholds, defining whether the data quality was sufficient. When passing acceptance levels, a factor of 1 was assigned, and when failing, a factor of 0, which was then multiplied by their specific predefined weight. Items, indicators, thresholds and weights are summarized in Table 118.
Items were analysed using the statistical software R- Statistics1 (Version 3.5.1) and RStudio (both R Consortium, Boston, MA, USA). Subsequent to investigating all items, a score was calculated, by dividing the sum of the results of each indicator (IW = Individual Weights) by the sum of their specific weights (SW = Sum of Weights), multiplied by 100; summarized as formula 1:
Score = IWSW×100
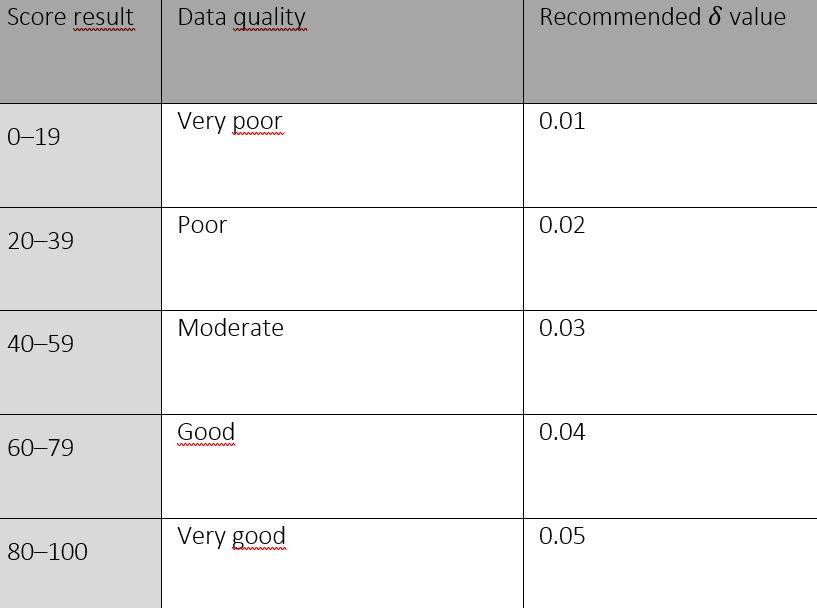
Scoring results were stratified to evaluate the data quality from very poor to very good, and in addition, matched with a recommended factor δ (delta), which was used to calculate the number of patients, upon which SDV should be conducted. Table 218 summarizes delta values in relation to score results and data quality.
The unadjusted case number n0independent of the cohort size) needed to be calculated as a foundation for the adjusted case number n (the sample size taken from the registry for SDV), which was relative to the total number of patients in the registry.
Formula 2 was used to calculate the n0for SDV:
n0 = p(1-p)δ2×z1-α/22
For the first SDV, Nonnemacher et al. recommended a p-value = 0,05.
For the quantile of the standard normal distribution z1-α/22for a first-order error of α = 0.05, Nonnemacher et al. recommended z1-α/22 = 1,96.
Finally, n, defining the sample size taken from the registry for SDV, related to n0 and to the total number of patients registered, defined as N, was calculated using formula 3:
n = n0∙Nn0+N
Conducting a source data verification
Within the statistical software R- Statistics1, the package ggplot2 and its geom_count and geom_density functions were the method of choice to investigate systematic faults while conducting the SDV. The Source data verification was shown on the x-axis, registry data on the y-axis, and ‘same’ on the x- axis indicating a match between the registry and the source data. The parameter “same” was introduced as a constant for each item investigated in order to make the method applied more comprehensible. The legend ‘prop’ indicated the proportion of agreement between the registry and the source data. If a circle equalled a prop of 1.0, the match between registry and source was 100%. To facilitate understanding the results of the SDV, an arbitrary example displaying ‘The perception of personnel by patients in comparison to the actual function of personnel’, is given in Figure 1. The following conclusions can be drawn from this example: All (100%) of the nursing personnel was also perceived as nursing personnel (large green circle). Half of the doctors were identified as students (left blue circle), and 25% of the students were actually doctors (small red circle). During source data verification, deviations from source to registry of double-digit percentiles were further analysed using this graphical method.
The SDV focused on 12 selected items from the registry, ranging from general medical information, administrative entries to fracture- specific data: admission date, discharge date, date of treatment, height and weight, employment status, fracture side, number of comorbidities, main diagnosis according to ICD–10 GM (International Statistical Classification of Diseases and Related Health Problems German Modification), fracture date, occurrence of a complication, type of fixation, and type of reduction. It was carried out on each sampled patient and analyzed, using R Statistics1.
Results
Scoring data quality
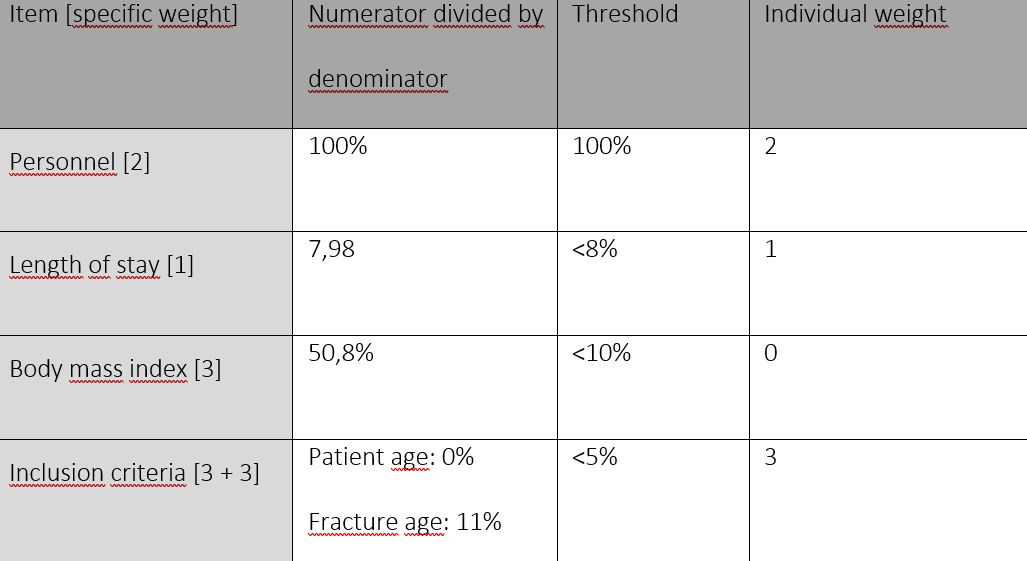
Items for scoring the data quality were analysed, individual weights calculated, and the results summarized in Table 3. On the level of organisation, all personnel at the study centre had been diligently trained, the result was 100% and the individual weight of 2 calculated. The length of stay, shown in Figure 2, hinted that some patients had a negative length of stay (meaning the registered discharge date was before the admission date), and some patients apparently had been in treatment for up to 370 days, which seemed implausible. The average length of stay of trauma patients analysed in a publication by Chona et al., was 3.8 ± 5.4 days3. Since the university hospital in Lübeck treated severely injured and complicated cases, the maximum plausible length of stay was extended to the first visibly aberrant value at 130 days. Thereby, the proportion of patients with implausible extreme values was 5.98%. This value passed the threshold for an acceptable indicator. As a result, the partial weight of 1 could be included in the score calculation.
When investigating the optional data elements height and weight, the proportion of non-calculable BMI- values at 53.8%, not passing the threshold for an acceptable data quality. As a result, the partial weight of 3 could not be included in the score calculation.
The examination of the patients’ age at admission showed that no patient was underage. This meant that the partial weight of 3 could be included in the score calculation.
The fracture age is displayed graphically in Figure 3 to identify extreme values, using the geom_density function of the package ggplot2 in R Statistics1. It can be seen that some patients had a negative fracture age (i.e. the registered fracture date was after the admission date), and some fractures were more than 7 days old (i.e. not complying with the procedural rules of excluding fractures >7 days old). The proportion of patients with a fracture age outside the inclusion criteria was 12%, exceeding the 5% threshold. As a result, the partial weight of 3 could not be included in the calculation. All results for calculating individual weights are summarized in Table 318.
The score value was calculated as follows:
Sum of individual weights (IW):
IW = 6
The sum of all specific weights (SW):
SW = 12
Values are set into the formula for scoring:
Score = IWSW×100
Score = 612×100
Score = 50
Data quality was evaluated as moderate according to the ranking of Table 2 18. The fraction of cases (n) taken of the 238 registered patients (N) as a sample for SDV, was calculated using formula 2 and formula 3.
n0 = p(1-p)δ2×z1-α/22
n0 = 0,05(1–0,05)0,03²×1,96
n0 = 103
n = n0∙Nn0+N
n = 73
Conducting the source data verification
A random sample of patients equivalent to the size of n = 73 was drawn from the registry, using the sampling function in R Statistics. The SDV documented the percentile of discrepancy between source and registry on the initially selected 12 items:
- Admission date - 2.74%
- Discharge date - 8.22%
- Treatment date - 9.59%
- Height and weight - 5.48%
- Employment status - 6.85%
- Fracture side - 9.59%
- Number of comorbidities - 15.1%
- Main diagnosis according to ICD–10 GM - 19.2%
- Fracture date - 17.8%
- Occurrence of a complication - 20.5%
- Type of fixation - 16.4%
- Type of reduction - 26.0%
Items 7 to 12, were further analysed, using graphical methods, as they had double digit aberrations from the source.
In Figure 5, the SDV of comorbidities was further analysed, showing that when no data was registered, patients tended to have 3 or more comorbidities (large grey circle and medium-sized pink circle). A tendency to register less comorbidities than present, could be detected (second column to the right).
In Figure 6, the SDV of the coding of main diagnoses in the registry was analysed, representing a data type with multiple elements. Besides defining an agreement between the registry and source data by setting source items as ‘same’ (multi-coloured vertical strip) when matching, patients with multiple main diagnoses were also noted (turquoise circle), suggesting the addition of a new category to the registry. For patients without an ICD–10 code in the registry (NA on the y-axis and grey dots horizontally at the top of the graphic), specific codes could be traced in the source data. These missing codes need to be added to the registry’s data base.
It was not possible to define an agreement between the registry and source using the attribute ‘same’, for the data element ‘fracture date’. Instead, an agreement was marked with the date 1 January 1900 to make it visibly distinguishable. In Figure 7, the agreement is visible on the left part of the graphic as a thick, blue line. A fracture registered in 2016 was noted as a fresh fracture in the source data (dark blue circle bottom right). An entry error could have led to this. The same applies to a fracture in 2019 (top right circle), which was after the pilot phase. The remaining deviations seemed to lie within the range of days and to be documented at large precisely (amorphous accumulation of dots in the right area of Figure 7).
When the source data of methods of fracture reduction were investigated, further differentiation was made. When the method of reduction was registered as closed (red circles at the bottom of Figure 8), a combination or succession of methods was often found in the source. Hence, these categories were added and are suggested to be integrated into the registry. Falsely registered reduction methods were rare (no circles in the centre and left area of the graph). If no fixation information was available in the registry, the method could be assigned to the SDV afterwards (grey circles in the upper part of the graphic). The extended differentiation, by adding additional categories, caused the double- digit percentage of deviation between the registry and source.
Testing the registration of complications
As the registration of complications was a distinguishing feature of the BFCC- registry, it was graphically displayed and analyzed in Figure 4. Complications had generally been registered correctly (large green and red circle). If no information about complications was available in the registry (large grey circle), it was likely that the patient had no complications in the source data. False positive or false negative results were rare (small red and small green circle). With a confidence interval of 0.95, a sensitivity of 89,29%, a specificity of 82,50% and positive predictive value was 78,12%, were calculated.
Discussion
The method of adaptive monitoring was previously applied by Jacke et al. on a breast cancer query database from two one- year- episodes (1996/1997, 2003/2004)10, 11. In total 877 cases were included in the study. Instead of an actual source data verification, a secondary database was taken, and distributions of data were compared. This approach is suitable for large data sets, yet somehow questionable due to a selection bias from the primary to the secondary database. Partly, a similar approach was used when scoring the data quality of the BFCC- registry, when the length of stay was oriented on 49.778 orthopaedic and trauma patients analysed by Chona et al.3.
Nonnemacher et al. developed the method of adaptive monitoring, despite having a deep mathematical foundation, with the emphasis to be used by non-mathematicians, to allow a wide application. The strength of this publication is, that the method has indeed been applied by a clinician and non- mathematician, hence proving its user- friendliness and possibility for broad usage.
Jacke et al. could reach an improvement of data- quality from 51.7% to 67.7%10, after adjusting the parameters, similar to the scoring the data quality of the BFCC fracture registry. Initially, when crude registry data was taken to calculate the score, a medium data quality with a scoring result of 50 was calculated. During the SDV it was found that the actual difference between the registry and source was a mere 5.48%, in contrast to 50.8% of missing data elements. Consequently, a new score was calculated including the Individual weight of 3 for the optional data element of “height and weight” (Table 1). An adjusted score value of 75 was the result and placed the data quality at the upper end of ‘good’ (Table 2). For future scorings of data quality, a different item for the indicator ‘optional data elements’ is recommended.
The BFCC- project chose to implement a further modification, by splitting up the indicator “compliance with procedural rules” into two investigated items. This choice was made to split the relatively high individual weight of 6 into two times 3 (Table 3). Hence the compliance with a legal procedural rule “patient age” at registration and a registry specific procedural rule of “fracture age” could be individually taken into consideration for scoring.
The Anglo-American date format of ‘month/day/year’ used in the registry’s software probably caused faults in both fracture age and length of stay recordings, since the date format of ‘day/month/year’ is used in Germany. As the pilot phase of the registry was conducted from November 2017 until February 2018, outliers in the data set are likely, as the first 12 days of single digit months like January and February were prone to error when entering data.
The registration of comorbidities hinted towards an under- registration, as the majority of patients (52.5%) had 3 or more comorbidities. A change from a categorical variable (0,1,2, >3) to a numerical variable (0,1,2,…,n) could improve precision.
Funding of the BFCC- project stopped by March 2019. Implementations of suggested improvements were only carried out to a limited extent. For example, missing ICD codes were added but the date format could not be changed by the end of the project.
Conclusion
Scoring the data quality of a registry is a unique feature to Nonnemacher et al.’s method of adaptive monitoring and demanding in its execution. The items chosen for scoring can hugely vary from registry to registry, leading to a procedure bias.
For the systematic evaluation of registry entries, the data format in the source data evaluation needs to be chosen diligently to enable statistical analysis. Certain faults (e.g. missing ICD–10 GM codes) or necessary additional options for fixation methods (e.g. the use of an external fixator followed by internal fixation) were identified, corrections recommended, and the items added by the IT- section of the BFCC- project.
Established registries use varying methods to evaluate their data quality, ranging from reproducibility of entered data sheets on cases15, over completeness and correctness of registered procedures and diagnoses7, 12, 17 up to plausibility of entered datasets4. Hence, reproducibility and comparability between registries are hardly possible—which yet again shows the strength of the method of adaptive monitoring. The score of the data quality has a direct consequence to the sample size for source data verification. On top, partly biased by the selection of parameters investigated and possible modification of thresholds, attempts for comparability between data quality in registries can be made.
The graphical method geom_count for displaying proportions of agreement between registry data and source data (Figure 1) proved to be suitable for finding systematic faults. By using R Statistics1 as a software tool to analyse registry data, automated reports can be created using a carefully written statistical script. This lowers the threshold for the re-evaluation of registry data and facilitates continuous improvement of the registry. As a freeware, it is readily available and cost- effective for institutions to use. Furthermore, the software proved excellent when using multiple, large data sets.
An outlook to monitoring data quality in the future
As the method of adaptive monitoring has yet only been applied on two registries, possibilities for further research are vast. Its application on different projects could further test its reliability, with the aim to make it the gold standard for evaluating registries’ data quality.
To limit transfer- and human error and safe time, an automated data capture should be considered in the future. The excessive manpower needed to acquire sufficient amounts of data for the BFCC- registry was outdated. Solving this issue was subject of a different branch of the BFCC- project, focusing on import- and export solutions from the HIS (Hospital Information System) to the registry’s database. It could not be fully executed by the end of the project for reasons of software and data format incompatibilities. It is advisable to any new registry to meticulously care for data formats prior to setting it up or evaluating the data quality.
A shortcoming of the project was a selection bias, as only patients able to consent were allowed be included in the registry. As orthopaedic and trauma departments often deal with fragility fractures of older and not contractually capable patients, a bypass through an opt- out system, as used in Scandinavia9, 16 or the Netherlands20, would facilitate including patients. A drop- out rate caused by this was unfortunately not tracked and is suggested to be recorded by future projects.
References
1.R Statistics, 2018, Statistical Software, Version 3.5.1 + RStudio, Version 1.1.45, https://www.r-project.org/foundation/
3.Chona, D., N. Lakomkin, C. Bulka, I. Mousavi, P. Kothari, A. C. Dodd, M. S. Shen, W. T. Obremskey, and M. K. J. I.o. Sethi, Predicting the post-operative length of stay for the orthopaedic trauma patient. International Orthopaedics, 2017. 41(5): p. 859–868.
4.Flachenecker, P., U. Zettl, U. Götze, J. Haas, S. Schimrigk, W. Elias, M. Pette, M. Eulitz, M. Hennig, and J. J. D. N. Bertram, MS-Register in Deutschland—Design und erste Ergebnisse der Pilotphase. Der Nervenarzt, 2005. 76(8): p. 967–975.
5.Gjerstorff, M. L. J. S.j.o.p.h., The Danish cancer registry. Scandinavian Journal of Public Health, 2011. 39(7_suppl): p. 42–45.
6.Google, L. Google Scholar. 2019 September 9 2018]; Available from: scholar.google.com.
7.Graves, S. E., D. Davidson, L. Ingerson, P. Ryan, E. C. Griffith, B. F. McDermott, H. J. McElroy, and N. L. J. M. J.o.A. Pratt, The Australian orthopaedic association national joint replacement registry. 2004. 180(5): p. S31.
8.Helgesson, Ö., C. Bengtsson, L. Lapidus, C. Merck, and P. J. S.j.o.s.m. Sparén, Malignant Disease Observed in a Cohort of Women A Validation of Swedish Cancer Registry Data. Scandinavian Journal of Public Health, 1994. 22(1): p. 46–49.
9.Hillert, J. and L. Stawiarz, The Swedish MS registry–clinical support tool and scientific resource. Acta Neurologica Scandinavica, 2015. 132: p. 11–19.
10.Jacke, C., M. Kalder, M. Koller, U. Wagner, and U. Albert, Systematische Bewertung und Steigerung der Qualität medizinischer Daten. Bundesgesundheitsblatt-Gesundheitsforschung-Gesundheitsschutz, 2012. 55(11–12): p. 1495–1503.
11.Jacke, C. O., M. Kalder, U. Wagner, and U.-S. Albert, Valid comparisons and decisions based on clinical registers and population based cohort studies: assessing the accuracy, completeness and epidemiological relevance of a breast cancer query database. BMC research notes, 2012. 5(1): p. 700.
12.Juto, H., M. Möller, D. Wennergren, K. Edin, I. Apelqvist, and P. Morberg, Substantial accuracy of fracture classification in the Swedish Fracture Register: Evaluation of AO/OTA-classification in 152 ankle fractures. Injury, 2016. 47(11): p. 2579–2583.
14.Larsen, I. K., M. Smastuen, T. B. Johannesen, F. Langmark, D. M. Parkin, F. Bray, and B. Moller, Data quality at the Cancer Registry of Norway: an overview of comparability, completeness, validity and timeliness. Eur J Cancer, 2009. 45(7): p. 1218–31.
15.Laustsen, J., L. Jensen, and A. Hansen, Accuracy of clinical data in a population based vascular registry. European Journal of Vascular and Endovascular Surgery, 2004. 27(2): p. 216–219.
16.Lehtinen, M., H. M. Surcel, K. Natunen, E. Pukkala, and J. Dillner, Cancer Registry follow‐up for 17 million person‐years of a nationwide maternity cohort. Cancer medicine, 2017. 6(12): p. 3060–3064.
17.Meling, T., K. Harboe, A. J. Arthursson, and K. Soreide, Steppingstones to the implementation of an inhospital fracture and dislocation registry using the AO/OTA classification: compliance, completeness and commitment. Scand J Trauma Resusc Emerg Med, 2010. 18: p. 54.
18.Nonnemacher, M., D. Nasseh, and J. Stausberg, Datenqualität in der medizinischen Forschung. Vol. 4. 2014: Medizinisch Wissenschaftliche Verlagsgesellschaft.
19.Pipino, L. L., Y. W. Lee, and R. Y. Wang, Data quality assessment. Communications of the ACM, 2002. 45(4): p. 211–218.
20.Rakhorst, H. A., M. A. Mureau, R. D. Cooter, J. McNeil, M. van Hooff, R. van der Hulst, J. Hommes, M. Hoornweg, L. Moojen-Zaal, and P. Liem, The new opt-out Dutch national breast implant registry–Lessons learnt from the road to implementation. Journal of Plastic, Reconstructive & Aesthetic Surgery, 2017. 70(10): p. 1354–1360.
22.Veen, E. J., M. L. Janssen-Heijnen, E. Bosma, M. A. de Jongh, and J. A. Roukema, The accuracy of complications documented in a prospective complication registry. Journal of Surgical Research, 2012. 173(1): p. 54–59.
23.WebMD. Medscape. 2019 September 9th 2018]; Available from: medscape.com.
24.Zaltman, G. and C. Moorman, The importance of personal trust in the use of research. Journal of Advertising Research, 1988. 28(5): p. 16–24.
List of Abbreviations
BFCC—Baltic Fracture Competence Centre
BMI—Body Mass Index
EU—European Union
ICD–10 GM—International Statistical Classification of Diseases and Related Health Problems, 10th edition, German Modification
IT—Information Technology
IW—Individual Weights
SDV—Source Data Verification
SW—Sum of Weights
UKSH—Universitätsklinikum Schleswig- Holstein
Declarations
Ethics approval and consent to participate
The research project has been approved by a suitably constituted Ethics Committee of the University of Lübeck on October 9th 2017 reference number 17–267. All study participants gave informed consent.
Consent for publication
Not applicable
Availability of data and material
The datasets used and/or analysed during the current study are available from the corresponding author on reasonable request.
Competing interests
The authors declare that they have no competing interests
Funding
Not applicable
Authors’ contributions
All authors read and approved the final manuscript.
JF—mainly contributed to writing the manuscript, statistically analysing the data as well as interpreting results and drawing conclusions
APS—contributed as leader of the BFCC Project by helping to find statistical methods to analyse data quality of the registry as well as proofreading the manuscript
AG—contributed by including patients into the study
AW—contributed to the availability of data from the hospital information system as well as the statistical analysis
GH—contributed by including patients into the study
Acknowledgements
Not applicable
Table Titles
Table 1. Items, Levels, and Indicators for Scoring of Data Quality. Values are adjusted to the BFCC- project, yet orient on recommended values by Nonnemacher et al.
Table 2. Delta value in relation to score result and data quality
Table 3. Results for the calculation of individual weights. Values are adjusted to the BFCC- project, yet orient on recommended values by Nonnemacher et al.
Figure Legends
Figure 1. Arbitrary example to introduce the statistical method for source data verification: The perception of the hospital personnel (y-axis) versus their actual function (x-axis). Prop = proportions
Figure 2. Length of stay of all patients in the registry.
Figure 3. Fracture age (in days) of all patients in the registry.
Figure 4. Occurrence of complications in all patients. Prop = proportions.
Figure 5. Source Data Verification on the registered number of comorbidities. prop = proportions
Figure 6. Graphical analysis of ICD (International Classifications of Diseases) coding in source data verification. prop = proportions
Figure 7. Source data verification of fracture date. Prop = proportions. Instead of ‘same’‘, the date 1 January 1900 was selected.
Figure 8. Source data verification (SDV) of reduction method. Prop = proportion
Formulas
Formula 1: Calculating the score result
Formula 2: Calculating the unadjusted case number
Formula 3: Calculating the adjusted case number