Animals and surgical procedures
All studies were approved by the IACUC of Texas Tech University Health Sciences Center, Lubbock, Texas (IACUC protocol# 20026). Experiments were performed in accordance with relevant guidelines and regulations. Female CD1 pregnant mice (Charles River Laboratories, Inc., Wilmington, MA; Cat# CRL:22, RRID: IMSR_CRL:22) and after delivery their offspring were kept under standardized light and dark conditions (12 h), humidity (70%), and temperature (22°C). Pregnant mice were singly housed. Offspring were separated into male and female after weaning (postnatal day 21–22) and housed in a group of 2–5. They were given ad libitum access to food and water. Animal behavior was monitored daily to minimize animal suffering. We applied the following exclusion criteria to our experiments: severe weight loss, infections, or significant behavioral deficits (decreased mobility, seizures, lethargy). No animal was excluded from this study. The research design is depicted in Fig. 1. A total number of 176 (n = 8 for mother and n = 160 for offspring) mice were used to perform this study. All experiments were conducted in compliance with the ARRIVE guidelines.
In-vivo e-cig vaping
Pregnant CD1 mice were exposed (via direct inhalation) to e-cig vapor containing 2.4% nicotine (Blu™, 24 mg/ml nicotine) mixed with oxygenated air or oxygenated air alone, 6 times/day; 1 cartridge/day from gestational day 5 (E5) until delivery, and it was continued after delivery until the pups were 7 days old. After birth, the pups would be exposed to nicotine via lactation [41, 42]. This exposure model was adopted following a study by Sifat et al. who investigated the effects of prenatal electronic cigarette exposure on offspring in mice model [6, 8]. In our study, Blu™ was used as this is one of the most popular e-cig brands still on the market, the cig-a-like structure fits well in our smoking apparatus, and there have been previously reported studies using Blu™ [6, 43, 44]. A modified CORESTA (Cooperation Centre for Scientific Research Relative to Tobacco) standard smoking protocol adapted to study e-cig exposure (27.5 ml puff depth volume, 3 s puff duration, 2 puffs per 60 s, 32 puffs/session) was followed in the laboratory. E-cig vapor was generated using a Single Cigarette Smoking Machines (SCSM, CH Technologies Inc.) following a previously published method used by our laboratory [6, 43, 44]. This method was developed to mimic the smoking behavior of a human chronic/heavy smoker/vaper and yields plasma levels of cotinine (111 ng/ml) which is in the range of blood cotinine level (30–250 ng/ml) found in other preclinical rodent models of chronic e-cig exposure [45, 46]. The smoking exposure was done between 9 a.m. to 2 p.m.
Nicotine And Cotinine Level Measurement By Lcms/ms In Offspring Plasma
Concentration of nicotine and its principal metabolite cotinine were measured from prenatally e-cig exposed mice plasma at PD7 by LCMS/MS analysis using Cotinine-d3 (MilliporeSigma, St. Louis, MO, USA) as an internal standard (IS) following a previously published method [47]. In brief, samples were prepared by protein precipitation of 25 µL mouse plasma using acetonitrile at 1:8 ratio. Mass Spectrometer was operated in positive polarity under the multiple reaction monitoring mode using electrospray ionization technique. The transitions of m/z 163.2 → 132.1, 177.2 → 98.0 and 180.2 → 101.2 were used to measure the nicotine, cotinine, and IS, respectively. The elution of nicotine (MilliporeSigma), cotinine (MilliporeSigma), and IS were at 1.89, 1.77, and 1.76 min, respectively. This was achieved with a mobile gradient phase consisting of 5 mM ammonium bicarbonate, acetonitrile, and methanol (3:1, v/v) at a 0.3 mL/min flow rate on a Kinetex EVO C18 column (Phenomenex, Torrance, CA, USA).
Body Weight Measurement
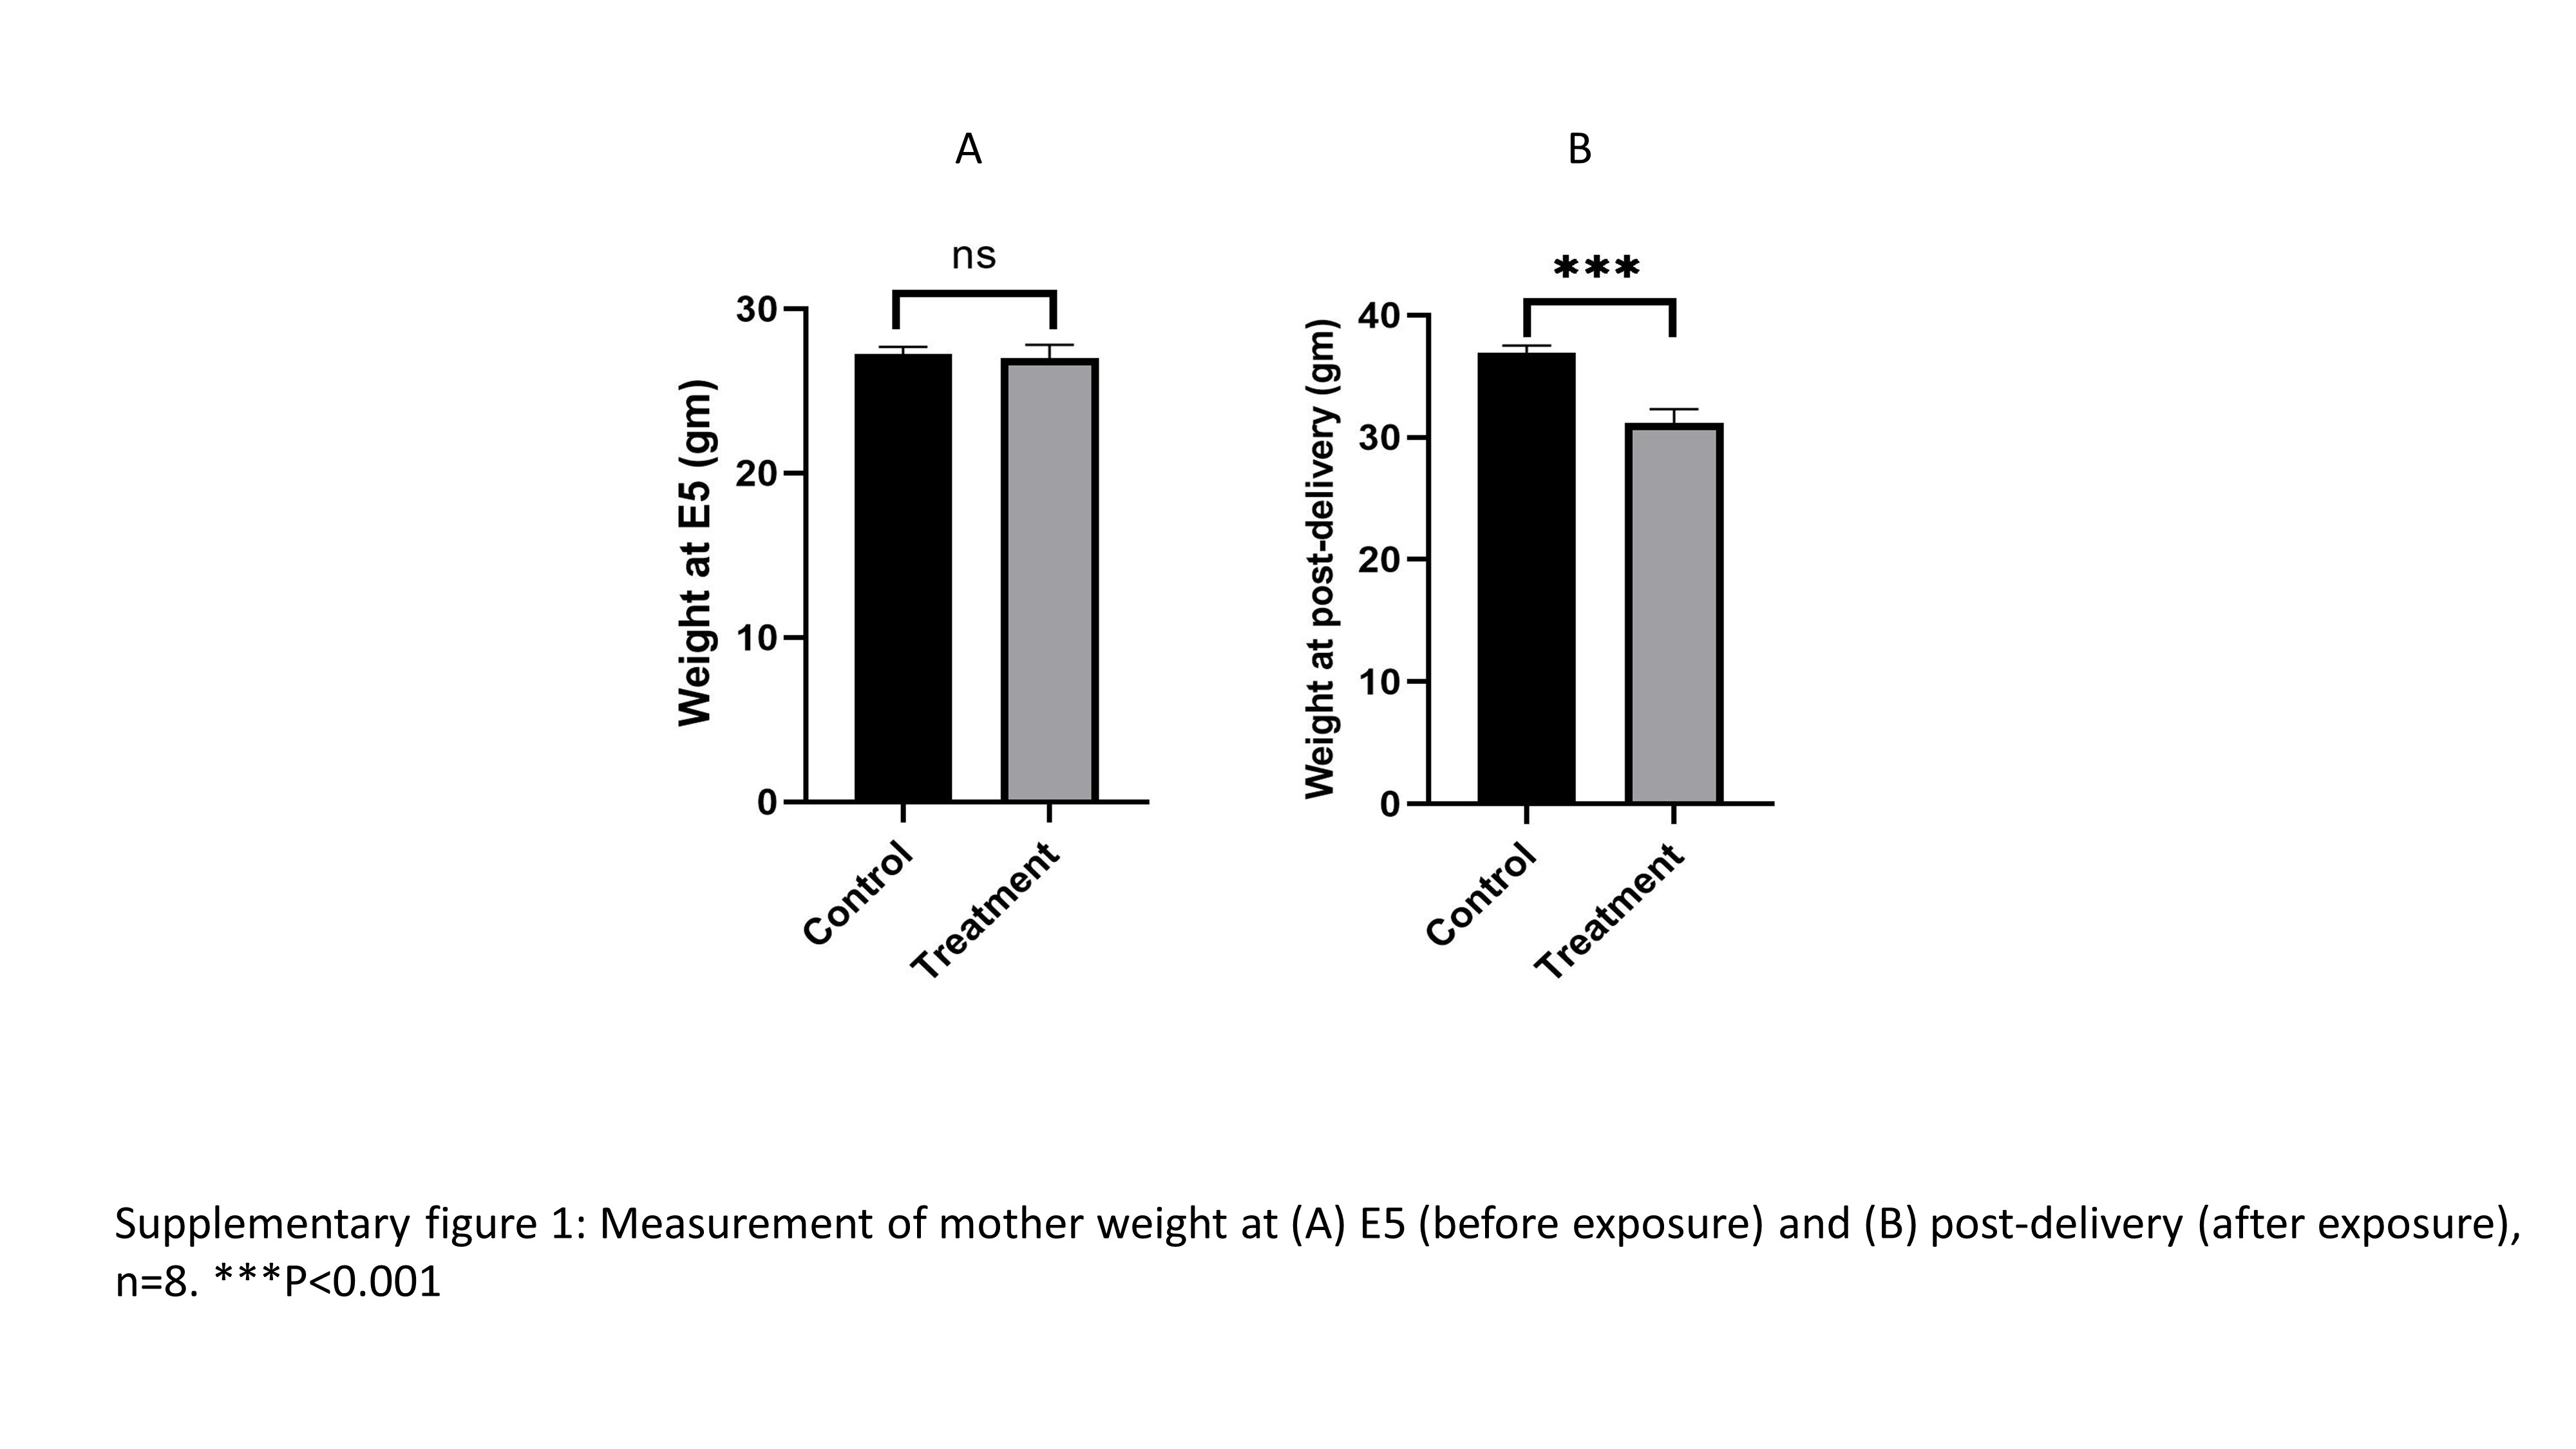
Weight of the mother was measured before e-cig exposure (E5) and post-delivery. Litter size and litter weight were also counted and measured respectively. The weight of offspring was measured at several time points including PD7, PD15, PD30, PD45, PD60, and PD90 to evaluate the body growth and development. To measure the brain to body weight ratio, brain was weighed after extraction at PD7, PD23, PD45, PD90 and brain-to-body weight was measured.
Western Blot
Prenatally e-cig exposed, or control mice were sacrificed at each time points (PD7, PD23, PD45 and PD90) and brains were isolated. Brains were lysed using RIPA buffer to isolate protein lysate. Protein concentrationof protein lysates were determined using a bicinchoninic acid (BCA) assay. Exactly 30 µg of protein from each sample was loaded and separated using a 10% Tris-glycine polyacrylamide precast gel (Bio-Rad Laboratories, Hercules, CA; Cat# 4568034). This method has been used previously to analyze Western blot immunoreactivity [6]. Protein samples were then transferred to a polyvinylidene difluoride membrane (Thermo Fisher; Cat# IPVH00010), and then membranes were incubated in blocking buffer (0.2% Tween-20 containing Tris-buffered saline (TBST) with 5% bovine serum albumin) to block the nonspecific protein bands for 2 h at room temperature. Membranes were incubated with rabbit polyclonal anti-ZO-1 antibody (1: 2000, Thermo Fisher; Cat# 40-2200), mouse monoclonal anti-claudin-5 antibody (1: 2000, Thermo Fisher; Cat# 35-2500), rabbit monoclonal anti-occludin antibody (1: 1000, Cell Signaling; Cat# E6B4R), rabbit polyclonal anti-laminin α1 antibody (1:2000, Thermo Fisher; Cat# PA1-16730), rabbit polyclonal anti-laminin α4 antibody (1:2000, Sigma; Cat# SAB4501719), rabbit monoclonal anti-GFAP antibody (1: 2000, Cell Signaling; Cat# DIF4Q), Rabbit monoclonal anti-PDGFRβ antibody (1: 1000, Cell Signaling; Cat# 28E1), mouse monoclonal anti-AQP4 antibody (1: 1000, Santa Cruz; Cat# 2), rabbit monoclonal anti-NeuN antibody (1: 1000, Cell Signaling; Cat# D3S3I), rabbit monoclonal anti-Glut-1 antibody (1: 2000, Cell Signaling; Cat# D3J3A) and mouse monoclonal anti-beta-actin antibody (1: 10000 MilliporeSigma; Cat# A5441) in TBST with 5% bovine serum albumin at 4°C overnight. After 4 times washing with TBST for 15 mins each cycle, membranes were incubated with anti-rabbit (Sigma Aldrich; Cat# GENA934- 1ML, RRID: AB_2722659) or anti-mouse (Sigma Aldrich; Cat# GENXA931-1ML, RRID: AB_772209) IgG-horseradish peroxidase secondary antibody (1:10000) in TBST with 5% bovine serum albumin for 2 h at room temperature. After 4 times of 15 mins wash with TBST, the protein signals were detected by enhanced chemiluminescence-detecting reagents (Thermo Fisher; Cat# 34577) and visualized in X-ray films in the dark. The protein bands were quantified relative to beta-actin in Image J software.
Immunofluorescence
Immunofluorescence staining was performed as previously described with modifications [48, 49]. Mice were euthanized by isoflurane overdose at each time point. The brains were sectioned at 20 µM of thickness, fixed with 4% paraformaldehyde (Thermo Fisher) for 15 minutes, then permeabilized with 0.1% Triton X-100 for 10 minutes. After washing with the phosphate-buffered saline (PBS) for 15 minutes, the sections were blocked for 1 hour and incubated overnight with primary antibodies for ZO-1 (1:100, Thermo Fisher) claudin-5 (1: 100, Thermo Fisher) and GFAP (1:100, Cell Signaling), respectively. Alexa fluorescent secondary antibodies (Thermo Fisher) were used at 1:400 dilutions for 1 hour. After counterstaining with 4′,6-diamidino-2-phenylindole (DAPI) for nucleus and washing with PBS, the sections were mounted with Permount (Thermo Fisher). The whole sections were scanned with a Leica Stellaris SP8 Falcon microscope (Leica Microsystem) and the images (20X magnitude) were captured with the same microscope. Mean total fluorescence intensity was calculated for each color channel and intensity of green color (ZO-1/GFAP) and red color (claudin-5) was expressed relative to blue color (DAPI). Cortex and hippocampus of both hemispheres of each brain section were used to evaluate the expression levels of ZO-1, claudin-5 and GFAP. To minimize the subjective bias, all images for ZO-1, claudin-5 and GFAP expression analysis were captured under the same microscopic parameter (laser power, pinhole size, exposure time) setting.
Open Field Test (Oft)
OFT was performed to evaluate the locomotor activity of the prenatally e-cig exposed or control mice both male and female at PD45 (adolescent) and PD90 (adult) following our previously published study [50, 51]. Versamax software (Accuscan Instruments., Columbus, OH) was used to automatically calculate the total distance traveled by the mice. Briefly, mice were introduced to 16″ × 16″ unobstructed glass chamber and their activities were monitored and recorded for 1 h. The first 10 min of 1 h was excluded as the acclimatization period. All experiments were performed between 8 am and 10 am. Fecal boli was counted for each mouse after completing of the OFT to measure stress/anxiety level following published literatures [52, 53].
Novel Object Recognition Test (Nort)
NORT was performed to evaluate short-term memory retention. It was done by a slight modification of previously published literature [54]. For habituation, each mouse was placed in a wooden box without any object for 10 min, 24 h before the test. On the testing day, mouse was placed in that same box containing two identical green round blocks for 5 min for the familiarization phase. After a 30-min interval, during the test phase one of the objects was replaced with an orange rectangular shaped object. The time spent by the mice exploring each object was recorded by video capture and analyzed. The results are presented as the discrimination index which is calculated by: (time exploring the novel object – time exploring the familiar object)/ (time exploring the novel object + time exploring the familiar object). It is common rodent behavior for a mouse to explore a novel object over a familiar one. The premise for this test is that a mouse with a cognitive deficit will not be able to remember the old object during the test phase, therefore will spend a similar amount of time exploring each object. All experiments were performed between 10 a.m. to 12 p.m.
Morris Water Maze Test (Mwmt)
MWMT was performed to assess spatial learning and memory function [55]. A circular tank of 4 ft diameter was filled with water and the water was made opaque by the addition of non-toxic blue paint. The temperature of the water was maintained at 22°C. Spatial cues of various shapes (round, rectangle, square, triangle) and colors (red, yellow, green, blue) were equally spaced and placed around the tank. An escape platform positioned 1 cm below the surface of the water and mice were trained to locate it. This study is of 5 days: day 1–4 are trial days and day 5 is probe test day. On trial days, each mouse had 3 training trials per day separated by 1 hr. In each trial, the mouse was placed in one of the 3 start locations which were equally spaced around the perimeter of the tank. Start location was changed in each trial. The mouse was allowed to swim for 60 s or until it reached the platform. If the mouse could not locate the platform within 60 s, the mouse was placed on the platform by the experimenter for 10 s and then placed in a home cage after making them dry with gentle wiping and keeping under a heat lamp for 5 mins. On day 5, a probe test was performed where in a 60 s trial the mice swim across the tank without the platform being present. This probe test measures reference memory of the mice as it would look for the platform from its previous memory and spend more time around the original platform location. Video capture and any-maze software were used to analyze data for this experiment. All experiments were performed between 12 p.m. to 4 p.m.
Vaginal Cytology
Estrous cycles were assessed at the same time every day during behavioral study performance day and during stroke surgery day following published protocols [56, 57]. Female mice were properly handled to minimize stress, by gently lifting the animal by the base of tail a plastic pipette filled with about 1 ml of PBS was placed on the tip of the vagina and flushed 5 times with same PBS to allow proper collection of samples for vaginal cytology. Sample was then smeared on appropriate labeled microscope slides and after 1 hr of drying time, a crystal violet (0.1%) staining was performed on slides. After drying, the slides were observed under a light microscope to visualize cells. Images were obtained using NIS Elements imaging software version 4.0.
Statistical Analysis
The sample size for the animal study was estimated based on G-power analysis. Test for normality was performed to select the appropriate statistical method. All data are expressed as the mean ± SEM. The values were analyzed by ‘t’ test to compare between two groups (Prism, version 7.0; GraphPad Software Inc., San Diego, CA). P values less than 0.05 were considered statistically significant.