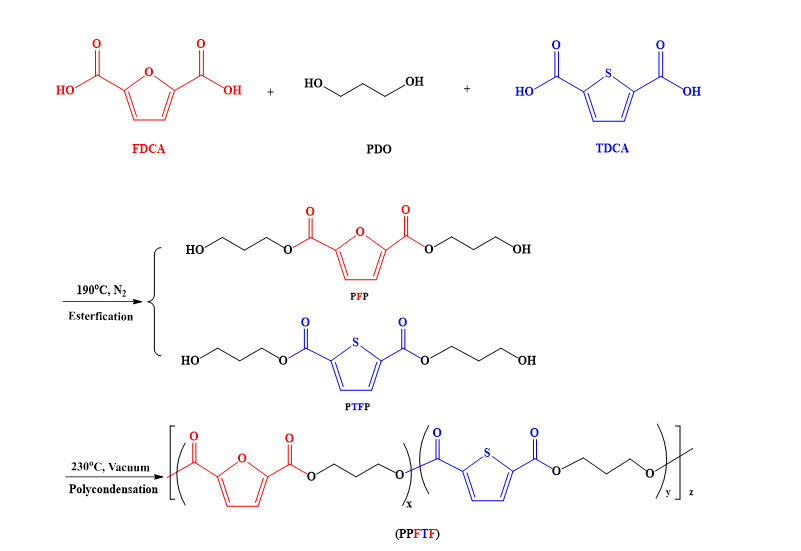
3.1 Synthesis and structures of PPF, PPTF and PPFTFs
As shown in Scheme 1, PPF, PPTF and PPFTFs were synthesized using TDCA, FDCA and PDO. As no other side reactions occurred throughout the process. Two procedures, esterification and melt polycondensation, were preferred for the experimental polymerization. GPC results show that PPF, PPTF and PPFTFs with high molecular weight were successfully prepared. Weight average molecular weight (Mw) was 17800–46800 g/mol and the polydispersity index (D) was 1.9–2.8 (Table 1). This indicates that the TDCA and FDCA can be well esterified with PDO to prepare polymers with high molecular weight.
The microstructures of the final products were characterized by FTIR and NMR. The expected chemical structures were obtained for all polymers. Figure 1 shows FTIR spectra of PPF, PPTF and PPFTFs. For PPF, the stretching vibration peak of the C-H in the furan ring is shown at 3121 cm− 1, the stretching vibration peak of C = C in the furan ring appears at 1583 cm− 1 (Peak I) and the breathing peak of the furan ring is shown at 1130 cm− 1 (Peak IV). The bending vibration peak of C-H in the furan ring is shown at 964 (Peak VI) and 826 cm− 1. The out-of-plane bending vibration peak of C-H in the furan ring is shown at 614 cm− 1 (Peak VIII). In addition, the stretching vibration of the C = O appears at 1710 cm− 1. 1261 (Peak III) and 1216 cm− 1 show the stretching vibration peak of C-O in ester group. It is clear that the intensity of Peaks I, III, IV, VI and VIII decrease as the content of TDCA increases, which is due to the decrease in the content of furan ring of the copolyester.
For PPTF, the stretching vibration peak of = CH in the thiophene ring are shown at 3102 cm− 1, the stretching vibration peak of C = C in the thiophene ring are shown at 1530 cm− 1 (Peak II), the breathing peak of the thiophene ring is shown at 1080 cm− 1 (Peak V), and the bending vibration peak of = CH in the thiophene ring is shown at 835 cm− 1. 678 cm− 1 (Peak VII) shows the out-of-plane bending vibration peak of C-H in the thiophene ring. In addition, the stretching vibration peak of C = O is shifted to a lower wave number due to the conjugation effect at 1701 cm− 1. The peak of C-O in the ester group appears at 1233 cm− 1. As the content of TDCA increases, the characteristic peaks associated with the thiophene ring (II, V and VII) are continuously prominent and increase in intensity. In particular, no significant absorption peaks attributed to OH were found, which also indicates that high molecular weight copolyesters have been successfully synthesized.
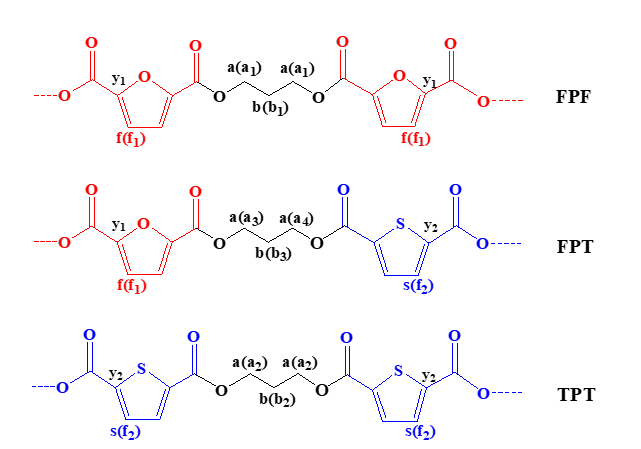
Figure 2 shows the 1H NMR spectra of PPF, PPTF and PPFTFs. The chemical structures of FPF, FPT and TPT in the copolymers are seen in Scheme 2. For PPF, CH in the furan ring (f) appears at 7.54 ppm and -OCH2- (a) linked to the ester bond is shown at 4.81 ppm. the -OCH2-CH2- (b) is shown at 2.52 ppm. For PPTF, the chemical shift of CH (s) in the thiophene ring is shown at 8.03 ppm. The -OCH2- (a) linked to the ester bond shows its characteristic signal at 4.83 ppm. The signal of -OCH2-CH2- appears at 2.56 ppm (b). For PPFTFs, the characteristic signals of two homopolymers were retained. f was shown in the range 7.52–7.57 ppm. s was shown in the range 7.99–8.03 pm. a and b appeared in the ranges 4.78–4.85 and 2.50–2.56 ppm, respectively.
Figure 3 shows the 13C NMR spectra of PPF, PPTF and PPFTFs. For PPF, the chemical shifts of the aromatic carbon in furan ring appear at 119.8 ppm (f1) and 146.4 ppm (y1). The -CH2-CH2-CH2- attached to the ester group appears at 63.3 ppm (a1) and the -CH2-CH2-CH2- at 27.0 ppm (b1). For PPTF, the aromatic carbons in the thiophene ring appear at 134.4 (f2) and 138.6 ppm (y2), and the -CH2-CH2-CH2- appear at 63.4 (a2) and 26.9 ppm (b2). All copolymers also show the characteristic peaks of homopolymers as seen in the 13C NMR spectra. Above chemical shifts are reasonable.
In addition, the molar percentage of propylene 2,5-thiophenedicarboxylate units in the copolymer (ΦPTF) was calculated using Eq. (1) and the results are shown in Table 1.
Φ PTF (mol%) = Is /(If +Is)*100% (1)
where Is and If represent the integral of the chemical shift s and f. Table 1 illustrates that ΦPTF is nearly equal to the feed ratio of TDCA. It was not able to determine the number average sequence length and randomness of PPFTF since the chemical structures of TDCA and FDCA are highly similar and methylene peaks overlap in 1H NMR. However, methylene peaks do not overlap in 13C NMR, so the number-average sequence length of propylene 2,5-furandicarboxylate unit (PF) and propylene 2,5-thiophenedicarboxylate unit (PTF) can be calculated. Ln,PF, Ln,PTF, and randomness (R) were estimated according to the equations (2)-(4), respectively, and their corresponding results are listed in Table 1.
Table 1
Microstructure and molecular weight of PPF, PPTF and PPFTFs.
| Sample | ΦPTF in feed (mol%) | 1H NMR | 13C NMR | Mw (g/mol) | D |
| ΦPTF in copolymer (mol%) | Ln,PF | Ln,PTF | R |
| PPF | 0 | 0 | - | - | - | 36700 | 2.5 |
| PPFTF25 | 25 | 25 | 3.52 | 1.24 | 1.1 | 46800 | 2.8 |
| PPFTF50 | 50 | 50 | 2.00 | 1.96 | 1.1 | 34800 | 1.9 |
| PPFTF75 | 75 | 75 | 1.47 | 3.79 | 0.9 | 24200 | 2.3 |
| PPTF | 100 | 100 | - | - | - | 17800 | 2.3 |
L n,PF =1+2Ia1 /Ia3+ a4 (2)
L n,PTF =1+2Ia2 /Ia3+ a4 (3)
R = 1/Ln,PF + 1/Ln,PTF (4)
3.2 Thermal properties
The composition dependence of the thermal transition data such as glass transition temperature (Tg) and melting enthalpy (ΔHm) was studied by DSC. Figure 4 shows the DSC curves of all polyesters. The corresponding thermal data are outlined in Table 2.
The thermal behavior of PPFTFs is closely related to their composition. In the first heating scan, both PPF and PPTF exhibited distinct semi-crystalline properties. Melt and cold crystallization peaks were found for PPF at 173.5 and 139.9°C, while melt and cold crystallization peaks for PPTF appeared at 186.9 and 93.8°C, respectively. The above thermal behavior is basically the same as the related literature [21]. However, compared to the melting enthalpy of PPF (ΔHm = 4.65 J/g), the ΔHm of PPTF is relatively high (36.2 J/g). This indicates that PPTF can undergo rapid crystallization and has good crystallization properties. Therefore, TDCA-based polyesters may have better crystallization rates compared to FDCA-based polyesters when the same diols are used. However, PPFTF25 and PPFTF50 did not show significant melt and cold crystallization peaks after the introduction of TDCA into PPF, indicating that they exhibited an amorphous state. When the content of TDCA reached 75 mol%, the cold crystallization peak of PPFTF75 was observed in both heating scans. This indicated that PPFTF75 was easier to crystallize than PPFTF25 and PPFTF50.
T g values of PPF and PPTF were 55.6 and 38.9°C, respectively, which was close to the values in other literatures [22, 23]. It was also evident that Tg of the copolyesters dropped linearly as the content of TDCA rises, indicating that the addition of TDCA promoted chain flexibility. This may also be explained by the fact that the sulphur atom in the thiophene ring has a lower electronegativity than the oxygen atom in furan ring, which causes weaker intermolecular chain interactions.
As shown in Table 2, the Tm value of PPF was 173.7°C. The Tm value of PPTF reaches 186.9°C, which can be attributed to the more perfect crystalline phase. The angle between two carboxyl groups in PPTF is larger (148o), resulting in easier folding of the molecular chain.
It is also known that compared with polyesters with even number of methylene groups, the polyesters with odd number of methylene groups have lower melting temperature and crystallinity. PPF are less crystalline (ΔHm = 4.65 J/g) and has a slower crystallization rate than poly(propylene terephthalate) (PPT) due to the lower flexibility and the asymmetric structure of the FDCA ring. The melt crystallization peak of PPF was not observed during the cooling scan. PPFTF25 and PPFTF50 also did not exhibit melt crystallization behaviour, suggesting that the resistance to chain folding by the three CH2 groups outweighed the ability of TDCA to promote chain folding. It is noteworthy that the angle between two carboxyl groups in PPTF is larger (148o) may be responsible for the melt crystallization peak at 131.1°C, suggesting that PPTF can melt crystallization. Notwithstanding, its enthalpy of melt crystallization (ΔHc) was very low (1.44 J/g).
Table 2
Thermal properties of PPF, PPTF and PPFTFs obtained by DSC.
| Sample | 1st heating | Cooing | 2nd heating |
| Tm (oC) | ΔHm (J/g) | Tcc (oC) | ΔHcc (J/g) | Tc (oC) | ΔHc (J/g) | Tg (oC) | Tm (oC) | ΔHm (J/g) | Tcc (oC) | ΔHcc (J/g) |
| PPF | 173.5 | 4.65 | 139.9 | 3.84 | | | 55.6 | 173.7 | 0.74 | 145.0 | 0.64 |
| PPFTF25 | | | | | | | 54.0 | | | | |
| PPFTF50 | | | | | | | 48.2 | | | | |
| PPFTF75 | 172.3 | 16.1 | 128.4 | 15.7 | | | 44.8 | 170.9 | 2.23 | 138.3 | 1.77 |
| PPTF | 186.9 | 36.2 | 93.8 | 28.6 | 131.1 | 1.44 | 38.9 | 186.6 | 36.6 | 104.2 | 24.8 |
3.3 Thermal stability
For the purpose of evaluating the thermal stability, thermogravimetric analysis (TGA) was utilized. TGA curves are depicted in Fig. 5. Table 3 lists the characteristic temperature at the maximal decomposition rate (Td,max ) and the characteristic temperature with a weight loss of 5% (Td,5% ). The Td,5% values range from 352–355°C and the Td,max values range from 382–391°C. The Td,5% value of 352°C for PPTF is slightly lower than that of the furan-based polyester PPF (Td,5% = 357°C) and the thermal stability of the resulting homopolymer is equivalent to that previously research findings [24, 25]. However, TDCA-based PPTF still has high thermal stability. TGA data showed that all copolyesters showed similar thermal stability to PPF and showed good thermal properties. At temperatures exceeding 380°C, all polyesters exhibit a one-step substantial breakdown process and significantly lose weight. At 350°C, there is a weight loss of around 5% of the polyester's entire weight. It is evident that the produced polyesters may be treated in a safe manner at temperatures above their melt temperature, which is enough to enable their usage in a variety of applications.
Table 3
Characteristic decomposition temperatures of PPF, PPTF and PPFTFs.
| Sample | Td,5% (oC) | Td,max (oC) |
| PPF | 357 | 391 |
| PPFTF25 | 353 | 387 |
| PPFTF50 | 355 | 388 |
| PPFTF75 | 355 | 389 |
| PPTF | 352 | 382 |
3.4 Crystal structure
As the polymers exhibited a low crystallinity, all samples were treated by annealing at 120°C for 5 hours to induce crystallization. Figure 6 shows the WAXD diffraction curves for all the copolyesters, from which it can be seen that all polyesters exhibit distinct characteristic peaks. PPFTF25 and PPFTF50 also show semi-crystalline properties. For PPF, the main diffraction peaks are located at 2θ values of 16.4°, 19° and 27.1°, as well as less intense peaks at 20.1°, 21.4°, 23°, 25.1° and 28.8°. 16.4°, 19°, 23°, 25.1° and 28.8° belong to the α-crystals of the PPF, while 20.1°, 21.4° and 27.1° belong to the β-crystals. This suggests that different α and β crystals are able to coexist in PPF, which may depend on their crystallization temperature. This was similarly concluded by Maria Cristina et al. in their study of the influence of the PPF crystal structure and crystallisation process on the final properties [26]. PPF can exhibit polycrystalline phenomena when crystallizing from the melt (α', α, and β crystalline phases) as well as change from a defective crystal structure (α'-crystalline phase) to a more perfect crystal structure (α-crystalline phase) when heated. For PPTF the main reflection peaks are exhibited at 2θ values of 16.3°, 23.1° and 25.8°. Furthermore, PPTF shows a crystalline structure that is close to the more stable β-PPF crystals mentioned previously in the relevant literature [21].
It is clear that the introduction of TDCA into the PPF matrix resulted in a significant change in the crystal structure. It is noticeable that the addition of TDCA induces the development of β-PPF crystals, and it is also evident that α-PPF crystals are very similar to the more stable β-crystals of PPTF. Thus, all copolyesters exhibit similar crystals to PPTF. Furthermore, in particular, the peak intensities of PPFTFs are significantly higher than those of PPTF. Above results indicate that the addition of TDCA can make the copolyester develop towards a more stable crystal.
3.5 Dynamic mechanical analysis
Dynamic mechanical properties (DMA) give an insight into the viscoelastic properties of the polymer and also give the glass transition temperature (Tg) of the copolymer. Figure 7 displays changes in DMA curves for PPF, PPTF and PPFTFs with increasing temperature. The data obtained from the DMA tests include the loss factor (tan δ), the loss modulus and the storage modulus. The storage modulus represents the elastic properties of the polyester material and is a measure of its ability to fully recover from deformation. The loss modulus, a measurement of the heat consumption during the deformation process, describes the viscous characteristics of the polyester substance; the higher the loss modulus, the more viscous the substance. The loss factor (tan δ) measures how well a material absorbs vibrations and is calculated as the ratio of the loss modulus to the energy storage modulus. As shown in Fig. 7a, for the storage modulus, all polyesters show the first stage of a more stable decline as they rise from low temperatures (approximately − 90°C) to a range of 52°C. As the temperature continued to rise, reaching the glass transition temperature, the energy storage modulus showed an almost linear second-stage downward trend before reaching a plateau.
As shown in Fig. 7b, the loss modulus increases with increasing temperature, with the energy consumption owing to the motion of the molecular chain snippets overcoming environmental viscosity reaching its highest value in the glass transition region. As the content of TDCA increases, the peak value of the loss modulus curve of the copolyester shifts towards lower temperatures but with a smaller difference.
The glass transition temperature can be determined as the temperature at which the loss factor (tan δ) achieves its highest value. As shown in Fig. 7c, the maximum tan δ value is located around Tg (DSC) where the chain segments start to move. A Tg value of 65.5°C is observed for PPF and Tg is observed at 55.5°C for PPTF. It tends to be seen that as the content of TDCA increases, the molecular chains has
stronger mobility, causing the α-relaxation peak gradually shifts towards lower temperature except PPFTF25 and the Tg decreases. The glass transition temperature of PPFTF25 (70.3°C) is higher than that of PPF, which should be due to the higher molecular weight of PPFTF25. The Tg values measured by the DMA method are higher than the Tg values measured by the DSC method due to the different measurement principles. In addition, Fig. 7c shows that the intensity of the β-relaxation peak increases with increasing the content of TDCA. Meanwhile, the β-relaxation peak of PPTF exhibits a significantly larger and wider than that of PPF. For β-relaxation peaks of PEF and PETF, Sun et al. [27] also found that the β-peak of poly(ethylene 2,5-thiophenedicarboxylate) (PETF) was wider than that of poly(ethylene furanoate) (PEF). They suggested that this was related to the different rings in PEF and PETF. The furan ring with higher polarity makes PPF require more energy for chain segment movement during the occurrence of β-relaxation compared to PPTF.
3.6 Rheological behaviour
The rheological properties have an impact on the processing properties A rotating rheometer was used to analyze the rheological characteristics of PPF, PPTF, and PPFTFs. The dependency curves of complex viscosity (η*), loss modulus (G") and energy storage modulus (G') for PPF, PPTF and PPFTFs at various temperatures are depicted in Fig. 8.
At the same time, the storage modulus of all polyesters decreases with increasing temperature, which can ascribe to the increased chain flexibility of the molecular structure. Similarly, the loss modulus showed a similar trend with increasing temperature. Furthermore, as the free volume between chain segments increases with increasing temperature, the ability of the molecular chain segments to move increases and the density of intermolecular interactions or inter-chain entanglement of the polymer decreases. In result, the mobility of the molecular chains increases and the complex viscosity decreases. In addition, the complex viscosity of PPFTFs and PPTF is significantly higher than that of PPF. Due to larger bond angle between two carbonyls (148°) and weaker electronegative S atom of thiophene ring, the molecular chain of the copolyester have rigid (propylene 2,5-furandicarboxylate unit) and flexible (propylene 2,5-thiophenedicarboxylate unit) structures, and the molecular chain of copolyester is more prone to entanglement. Therefore, the complex viscosity of the copolyester is obviously higher than that of PPF. At the same time, compared with PPFTFs, the molecular chain of PPTF is more flexible. Therefore, the entanglement density of PPTF should be less than that of PPFTFs, but more than that of rigid PPF. Therefore, the complex viscosity of PPTF is between PPFTFs and PPF.