Cell culture and reagents
Human breast cancer cell lines MDA-MB-231 and CAL-51 and human prostate cancer cell line LNcap were obtained from the Public Laboratory of Tianjin Medical University Cancer Institute and Hospital. Human breast cancer cell line MDA-MB-453 was purchased from the BeNa Culture Collection (BNCC, China). All of the cell lines were identified and characterised by mycoplasma assays, DNA profiling (short tandem repeat, STR), cell viability, morphology, and isoenzymes. Cells were incubated at 37℃ in an incubator with 95% air and 5% CO2. CAL-51 and LNcap lines were maintained in RPMI 1640 medium (Gibco, USA, C11875500BT). MDA-MB-231 cells were maintained in Dulbecco’s modified Eagle medium (DMEM; Gibco, C11995500BT), and MDA-MB-453 cells were maintained in L15 medium (SH30525.01; Hyclone, USA). The above medium were supplemented with 10% foetal bovine serum (FBS) (Gibco, 10270–106) and 1% penicillin streptomycin (Gibco, 15140122). Enz was purchased from Solarbio (China, 915087-33-1) and Chid was kindly provided by Chipscreen Biosciences Ltd. (China). Enz and Chid were stored at a concentration of 1 mM in DMSO. AMG510 was provided by Beigene (China). The antibodies used in this study are listed in the Supplementary Table S1.
Growth Assay
MTS assay (Promega, G3582) was used to test the inhibitory effect of Enz and Chid both individually and in combination. Cells in the logarithmic growth period were collected and inoculated into 96-well plates (5 × 10³ cells per well, six biological replicates) with 200 µL medium. Cells were pre-treated with Enz or Chid at a drug gradient concentration for 48 h. Then, 20 µL MTS reagent was added to each well and cultured for 2h. Absorbance was measured at 490nm using a microplate reader (BioRad, Laboratories, Inc.). The half-maximal inhibitory concentration (IC50) was calculated based on cell viability rate.
Combination Treatment Synergy Quantitation
LNcap, MDA-MB-231, MDA-MB-453, and CAL-51 cells were treated with Enz and Chid for 48 h at corresponding concentrations based on IC50. The combination index (CI) was calculated using CompuSyn software to evaluate the combined effect on cells. A CI value greater than 1.0 indicates an antagonistic effect, a value lower than 1.0 indicates a synergistic effect, and a value of 1.0 indicates an addictive effect.
Colony Formation Assay
Cell proliferation was analysed using a colony formation assay. A total of 800–1000 cells were inoculated in 6-well plates were cultured overnight, then treated with Enz or Chid alone or in combination for 48 h. The plates were cultured for 10–14 days and the medium was replaced every 3 days. The colonies were fixed with 4% paraformaldehyde for 30 min and then stained with 0.5% crystal violet for 30 min. Use Adobe Photoshop software to calculate the colony count.
Cell Migration Assay
Migration ability was assayed using a Transwell (Corning, USA). The cells were pre-treated with the corresponding drugs for 48 h, and 1 × 10⁵ pre-treated cells(200 µL FBS-free medium) were subsequently inoculated in the upper chamber of the Transwell, and 500 µL medium supplemented with 20% FBS was inserted into the lower chamber. The upper chamber was fixed and stained with a Three-Step Stain Set (Thermo Fisher, USA) once a single adherent cell was detected. The membrane was then cut, placed on a slide, and sealed with paraffin. The migrated cells were imaged under 200⋅ magnification and counted using Adobe Photoshop.
Cell Cycle Analysis
Cell cycle profiles were analysed using flow cytometry. The cells pre-treated with Enz or Chid individually or in combination were collected and fixed with 95% pre-cooled ethanol at -20°C overnight, followed by washing with PBS and stained with 3 µM propidium iodide (PI). Cell cycle distribution was identified and quantified using a flow cytometer (BD Biosciences). The cell cycle distribution was analysed using ModFit LT software.
Western Blot
Western blot
Cells were lysed in RIPA buffer (Solarbio, R0020) supplemented with 1% phenylmethylsulphonyl fluoride (PMSF; Solarbio, R0020) to extract total protein. The lysates were centrifuged at 12,000 rpm for 10 min to collect the supernatants, and protein concentrations were measured using a Pierce™ BCA Protein Assay Kit (Thermo Fisher, 23227). The protein lysates were mixed with 5x SDS-PAGE sample loading buffer (Beyotime, P0015) and boiled at 95°C for 5 min. A total of 25 µg of protein was separated by SDS-PAGE and the gels were then transferred to PVDF membranes (Millipore). The membranes were incubated with the primary antibody overnight, according to the manufacturer’s instructions, and incubated for 60 min with the secondary antibody.
Xenograft In Vivo Model
All in vivo experiment abided by the NIH Guide for the Care and Use of Laboratory Animals. The animal protocol was ratified by the Animal Ethics Committee of TMUCIH. CAL-51 cells (4 × 10⁶ cells per mouse) were collected and resuspended in 100 µL pre-cooled PBS buffer supplemented with 5 µL Matrigel® matrix (354248, Corning). Cells were injected into the mammary gland fat pad of female NSG mice aged 4 to 5 weeks and weighing 18–20 g. Mice were maintained at a temperature of 18–22°C and humidity of 50–60% with 12/12 h light-dark cycles. Each cage contained six mice, and standard rodent diet and water were freely available. Tumour volumes were measured with a Vernier calliper every 3 days and calculated using the following formula: length × width2 / 2. Mice were randomly allocated to four groups (six mice per group) when the average tumour volume reached approximately 100 mm3. The four groups were treated with the control solvent, Enz, Chid, or their combination (Enz + Chid) at approximately the same time each day. Enz was dissolved in 0.5% CMC-Na for intragastric administration at 25 mg/kg body weight (BW) every two days. Chid was dissolved in 0.5% CMC-Na for intragastric administration and dosed at 12.5 mg/kg BW five times a week. Mice were sacrificed and tumours were collected after the 2-week treatment.
RNA-seq
Total RNA from CAL-51 cells treated with 20 µM Enz, 2 µM Chid, or Enz + Chid for 48h was extracted with TRIzol reagent (Thermo Fisher). RNA was quantified using the RNA Nano 6000 Assay Kit of the Bioanalyzer 2,100 system (Agilent Technologies, CA, USA). Each sample 1 µg RNA per sample was used for cDNA library construction. The library preparations were sequenced on an Illumina Novaseq platform according to the manufacturer’s instruction and 150 bp paired-end reads were generated.
The Kyoto Encyclopedia of Genes and Genomes (KEGG) database was used to identify enriched signalling pathways from the differentially expressed genes. KEGG pathway enrichment analysis was performed using the R packages clusterProfiler, enrichplot, org.Hs.eg.db, and ggplot2, with p value < 0.05 and q value (adjusted p value) < 0.05 were used as the screening criteria.
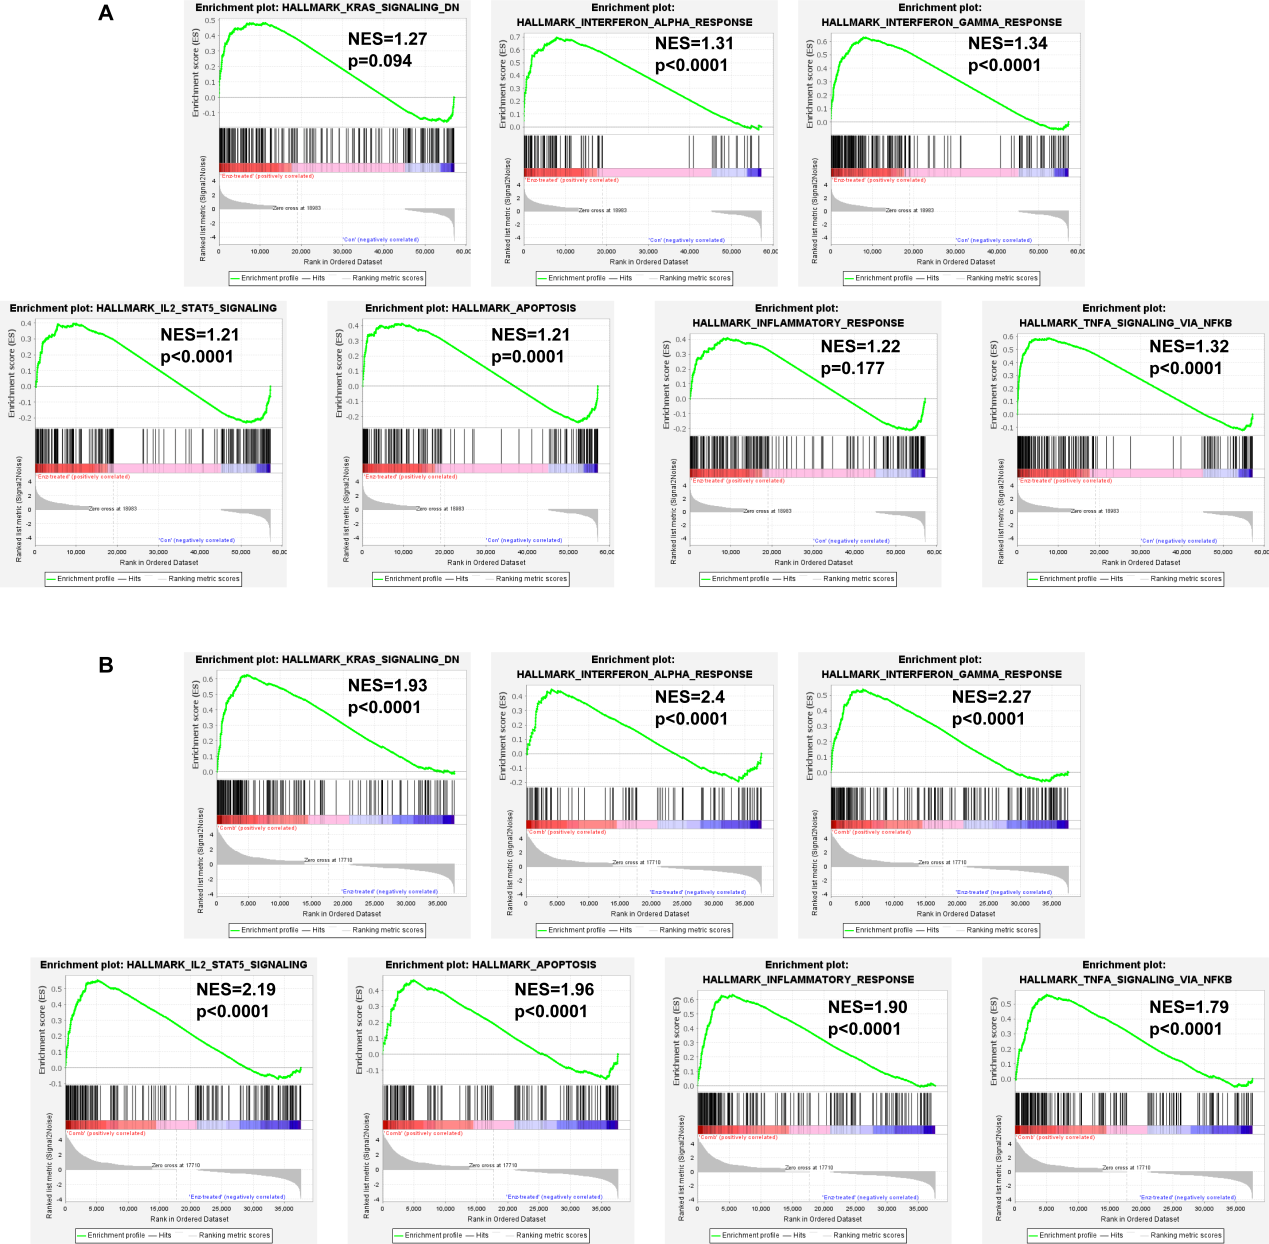
Gene set enrichment analysis (GSEA) was used to explore significantly dysregulated pathways between the groups. Gene expression files and phenotype label files were generated and loaded into GSEA software (v4.1.0, Broad Institute, Cambridge, MA).22 The enrichment analyses were focused on the MSigDB HALLMARKER gene set. The permutation test was carried out 1,000 times, and the criteria were NES absolute value > 1.5, NOM p value < 0.05, and FDR q value < 0.05.
Haematoxylin and eosin (H&E) and immunohistochemical (IHC) staining
Fresh tumour tissues were fixed with 10% neutral buffered formalin immediately for at least 12 h. Fixed tissues were embedded in paraffin blocks and cut into 4 µm-thick sections for H&E and IHC staining.
For H&E staining, tissue sections were stained with modified Lillie-Mayer Haematoxylin solution (Solarbio, G4070) and counterstained with Eosin Staining Solution (Beyotime, C0109).
For IHC staining, the slides were de-paraffinised in dimethylbenzene and hydrated in a series of ethanol solutions. The antigen was repaired in microwave oven with citric acid buffer (pH 6.0) and cooled to room temperature. The endogenous peroxidase activity was quenched using 3% H2O2. The tissues were blocked and incubated with primary antibodies overnight at 4°C. On the second day, the sections were stained with HRP-labelled secondary antibody (ZSGB-BIO). Slides were visualised using a DAB horseradish peroxidase colour development kit (ZSGB-BIO). Antibodies used in this study are listed in Table S1.
The slides were observed using light microscopy (200⋅ magnification) and quantified using a semiquantitative immunoreactivity score. The staining intensity (0 = no, 1 = weak, 3 = strong) and the percentage of positive staining (0 = negative, 1 ≤ 10%, 2 = 10–50%, 3 ≥ 50%) in each sample were recorded, and the immunoreactivity score (IRS) was determined by multiplying staining intensity and positive staining percentage. Low expression was defined as IRS < 6 and high expression as IRS ≥ 6.
Real-time quantitative PCR (RT-qPCR)
Total RNA was extracted using TRIzol reagent and 1000 ng was used to generate cDNA using the PrimeScript RT Reagent Kit (TaKaRa, Japan, RR047A). RT-qPCR was performed using SYBR Premix Ex Taq (TaKaRa, RR420A) on a CFX96 Touch Real-Time PCR Detection System (Bio-Rad, USA) in triplicate, according to the manufacturer’s instructions. All primers were synthesised by Tsingke Biotechnology Co., Ltd., and the sequences of the primers are listed in Supplementary Table S2. The results were analysed using 2−ΔΔCT and normalised to β-actin levels.
Statistical analysis
Quantification and statistical analyses were performed using GraphPad Prism 8.0 (GraphPad Software, Inc.) or R software (v4.0.5), and the statistical tests described in the text and figure legends were utilised. The unpaired two-tailed t-test was used to compare the differences between the two groups. All p values were two-sided, and p values < 0.05 were considered statistically significant.