Animals
All procedures were approved by the Institutional Animal Care and Use Committee of the Fourth Military Medical University and adhered to the Guide for the Care and Use of Laboratory Animals published by the National Institutes of Health. BKS-db mice (Strain NO. T002407) were purchased from GemPharmatech (Nanjing, China) and C57BL/6 mice were purchased from the Laboratory Animal Center of the Fourth Military Medical University. Eight-week-old male db/db and db/m mice were used to establish cutaneous wound healing models, and 8-week-old male wildtype (WT) C57BL/6 mice were used for cell isolation. Mice were housed in a pathogen-free environment (24°C, 12-h light/dark cycle, 50% humidity) with access to food and drink at all times. CO2 euthanasia was used to end the lives of all experimental mice. To summarize, the mice were placed in the Automated CO2 Delivery System and gradually lost consciousness. After increasing the concentration to 100% to guarantee that the mice did not have a pinching finger response or dystonia, CO2 was ventilated for 2 minutes to execute euthanasia.
Cell culture
UCMSCs were provided by Department of Obstetrics and Gynecology, Tangdu Hospital of the Fourth Military Medical University. The cells were cultured in alpha minimum essential medium (α-MEM) (Gibco, USA) supplemented with 10% fetal bovine serum (FBS) (Gibco, USA), 2 mM L-glutamine, 100 U/ml penicillin, and 100 g/ml streptomycin (all from Invitrogen, USA) at 37°C with 5% CO2. Every 3 days, the culture media was replenished. Well-grown passage 3–6 cells were used for experiments.
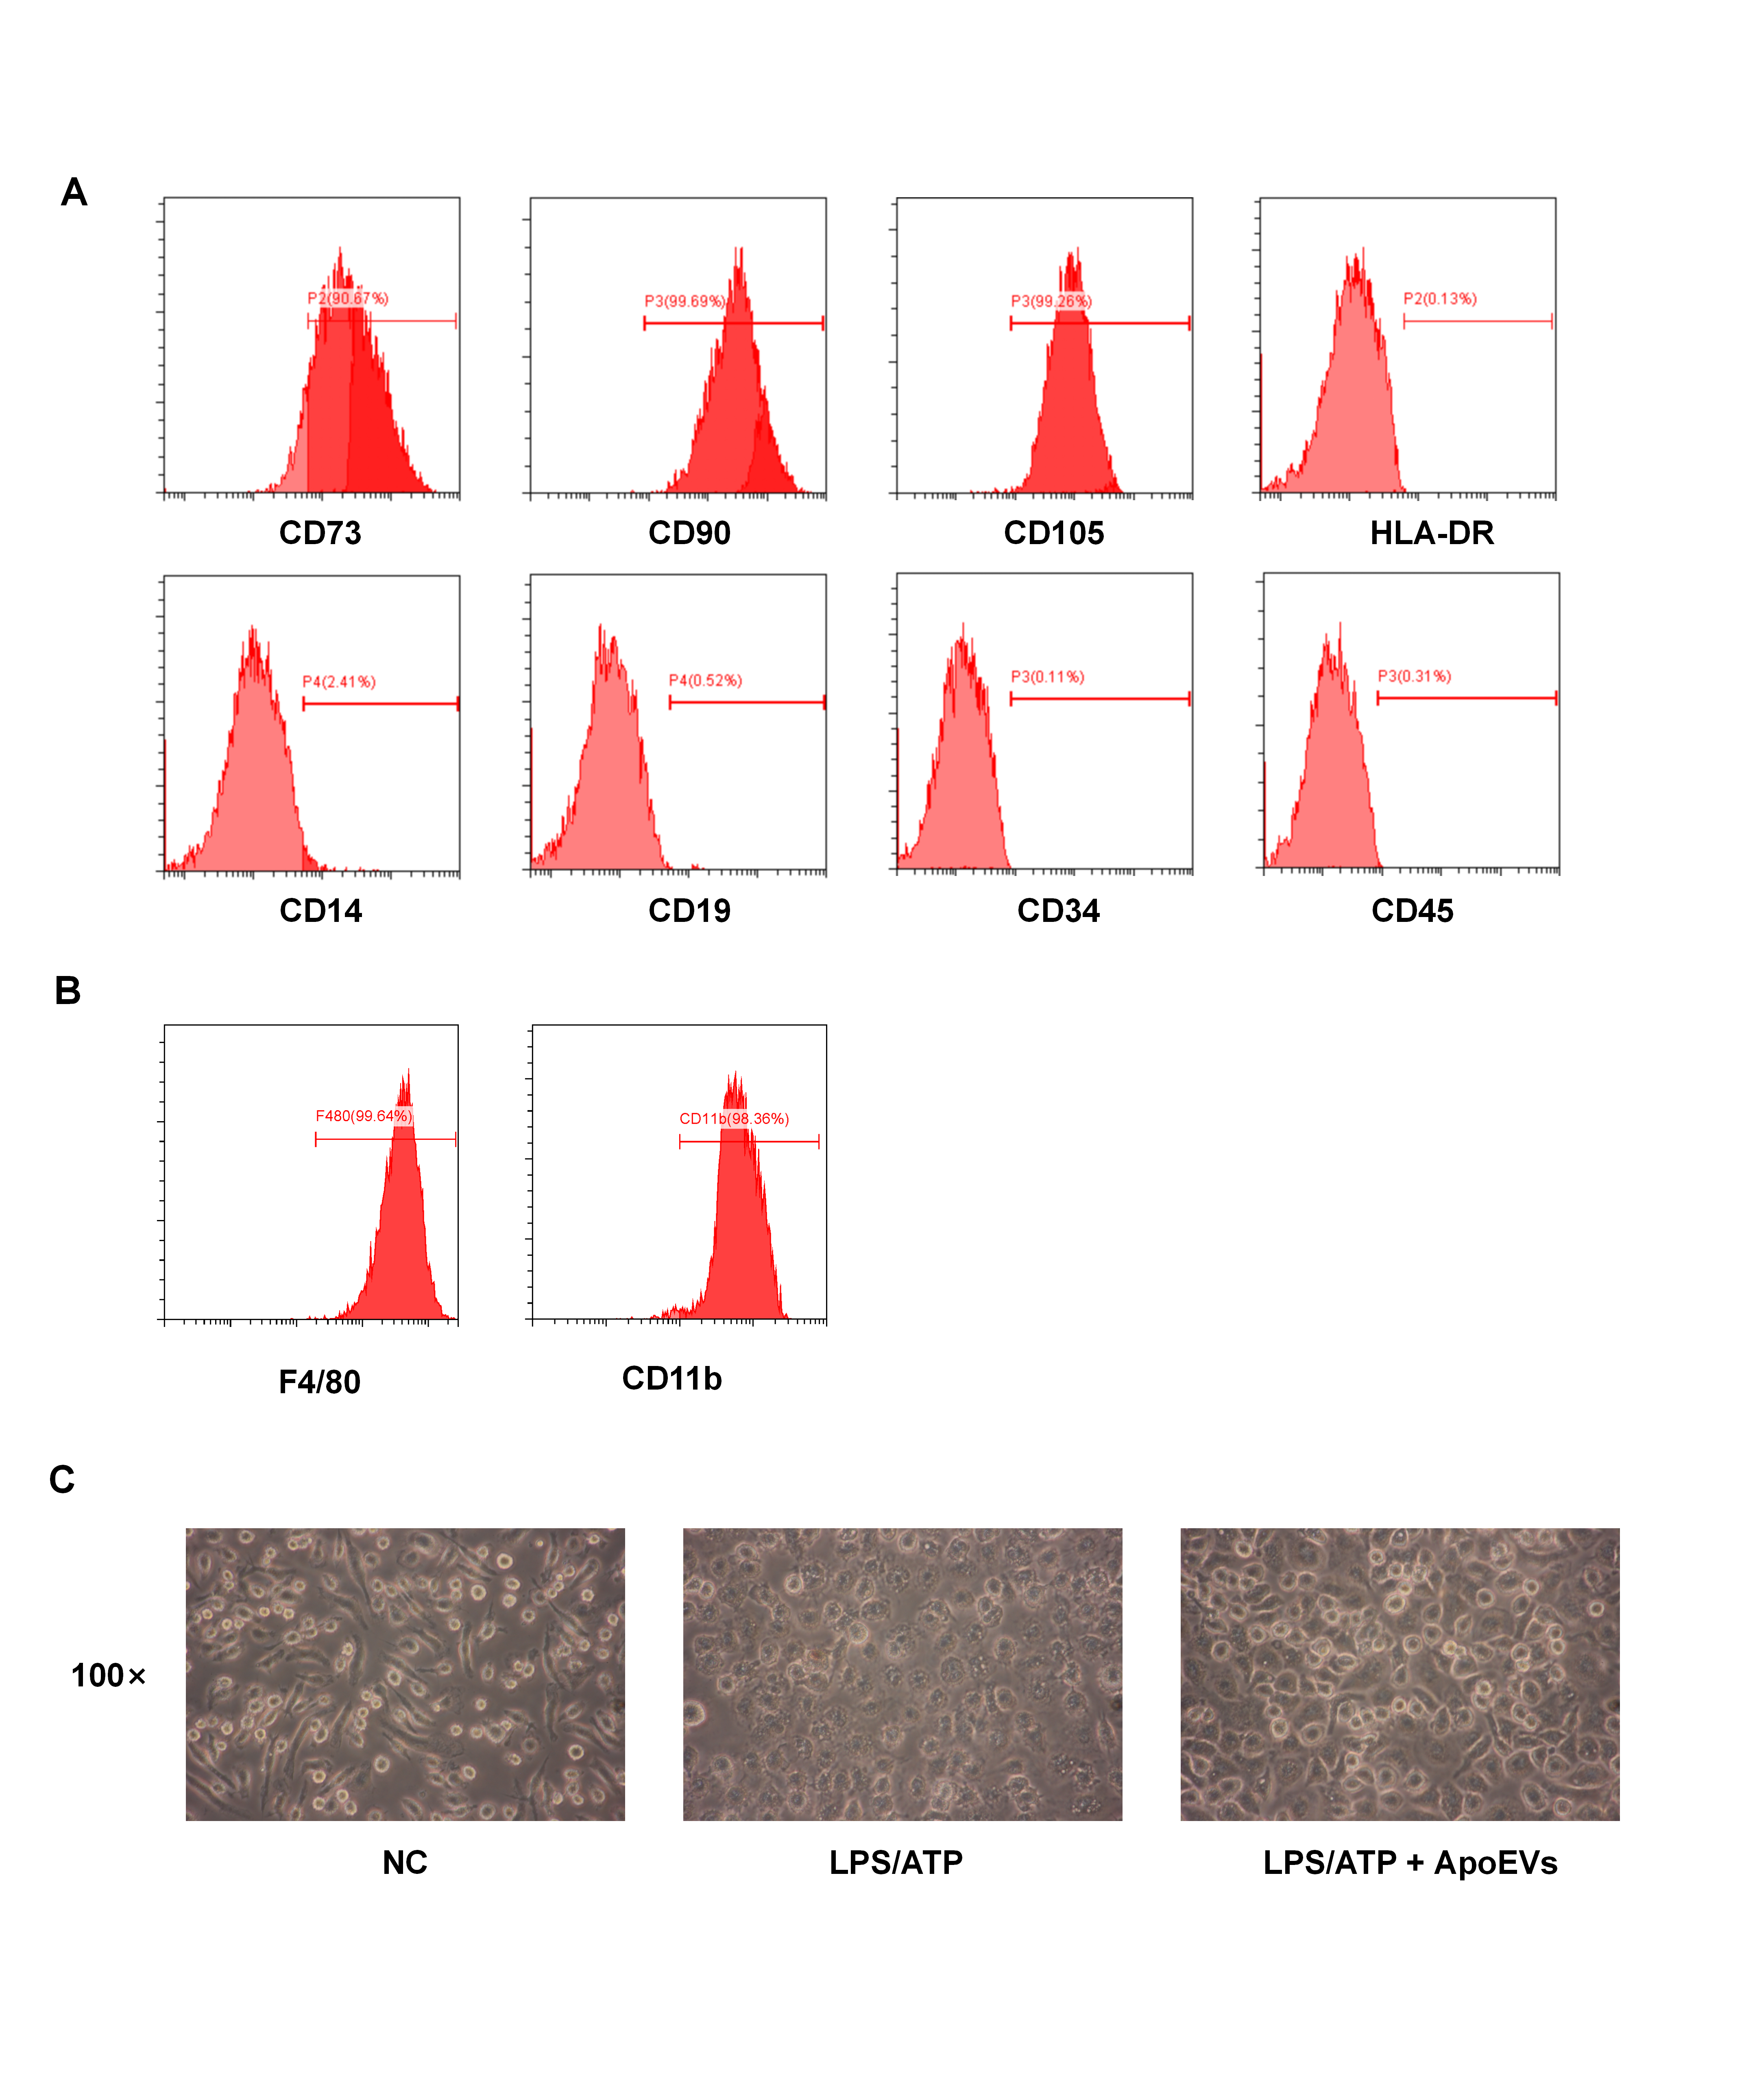
Bone marrow-derived macrophages (BMDMs) were isolated from hind limbs of C57BL/6 mice. Bone marrow cells were isolated and washed with erythrocyte lysis buffer (Beyotime, China). After centrifugation at 100 g for 5 min, the cell suspension was resuspended and seeded in high glucose (25 mM) Dulbecco's modified Eagle's medium (DMEM) (Gibco, USA) supplemented with 10% FBS, 2 mM L-glutamine, 100 U/ml penicillin, and 100 g/ml streptomycin. Mature macrophages were induced by culturing with recombinant mouse macrophage colony-stimulating factor (M-CSF) (R&D, USA) at 50 ng/ml for 7 days. After 7 days, macrophages were treated with 1 µg/ml lipopolysaccharide (LPS) (Sigma-Aldrich, USA) to stimulate the inflammatory response for 12 h. ApoEVs at concentrations of 5 µg/ml, 10 µg/ml, and 20 µg/ml were used to stimulate the experimental group for another 6 h (the original culture media was changed in the control group), and pyroptosis was induced by high glucose DMEM containing 4 mM adenosine triphosphate (ATP) for 30 min. Light microscopy photos were then taken.
After induction of pyroptosis, BMDMs were fixed with 2.5% glutaraldehyde for 12 h and washed three times with phosphate-buffered saline (PBS) for 20 min each. After final dehydration in graded alcohols, hexamethyldisilazane was utilized for drying. Dried samples were sent to the Instrumentation Center of the State Key Laboratory of Oral Medicine at the the Fourth Military Medical University for spraying and scanning electron microscope photography.
Isolation and characterization of ApoEVs
ApoEVs were isolated by an optimized method. First, UCMSCs were treated with American staurosporine (STS) (Cell Signaling Technology, USA) at a concentration of 0.5 µM for 10 h to induce apoptosis. Supernatants were collected and centrifuged at 1000 g for 10 min at 4°C to remove cells and debris. The supernatant was then centrifuged at 16,000 g for 30 min at 4°C and washed twice in PBS. Isolated vesicles were resuspended in 100 µl PBS and stored at − 80°C for further investigation. ApoEV content was quantified using the bicinchoninic acid (BCA) assay (Tiangen, China) before use. Apoptosis-induced UCMSCs were detached with 0.25% trypsin and centrifuged at 100 g. The apoptotic state was detected by flow cytometry using an Annexin V-FITC Apoptosis Detection Kit (7Sea Biotech, China), according to the instructions. The morphological characteristics of ApoEVs were observed by scanning electron microscopy (SEM), and the size distribution and zeta potential of ApoEVs were determined using a Zetasizer Nano ZSE (Malvern, UK) dynamic light scattering instrument (DLS). Immunofluorescence staining was used to detect Annexin V and C1q expression in ApoEVs. Annexin V staining was performed using the Annexin V-FITC Apoptosis Detection Kit (7Sea Biotech, China). The protein expression levels of caspase-3 and cleaved caspase-3 in UCMSCs and ApoEVs were detected by immunoblotting. To examine phagocytosis function by macrophages in vivo and in vitro, ApoEVs were labeled with PKH26 or PKH67 and their co-localization with labeled fluorescent F4/80 cells was examined under confocal microscopy. Primary antibodies used in this study included F4/80 (1:200, ab6640, monoclonal, UK), C1q (1:200) (CEDARLANE, CL7501F, monoclonal, Canada), GAPDH1 (1:1000) (CWBio, CW0100, monoclonal, China), caspase-3 (1:1000) (CST, 9662, polyclonal, USA), and cleaved caspase-3 (CST, 9961, polyclonal, USA).
Flow cytometry identification of cell phenotype
UCMSCs and BMDMs were isolated with 0.25% trypsin and resuspended in PBS containing 3% FBS for flow cytometry analysis of cell surface markers. UCMSCs were then incubated in the dark for 30 min with phycoerythrin (PE)-conjugated human anti-CD34 antibody (Biolegend, 343506, USA), anti-CD45 antibody (Biolegend, 304058, USA), anti-CD105 antibody (Biolegend, 800504, USA), anti-CD90 antibody (eBioscience, 12-0909-41, USA); allophycocyanin (APC)-conjugated human anti-CD14 antibody (eBioscience, 17-0141-81, USA), anti-CD19 antibody (Biolegend, 302212, USA); and fluorescein isothiocyanate (FITC)-conjugated human anti-CD73 antibody (Biolegend, 344015, USA) and anti-HLA-DR antibody (Biolegend, 307603, USA). BMDMs were incubated with APC-conjugated mouse anti-F4/80 antibody (Biolegend, 123116, USA) and anti-CD11b antibody (Biolegend, 101206, USA) in the dark for 30 min. Associated conjugated immunoglobulins, provided by eBioscience and Biolegend, USA, were used as negative controls. Finally, cells were washed twice in PBS, and flow cytometry was used to detect positive cells (Beckman Coulter, USA).
Establishment of a cutaneous wound healing model in T2DM mice
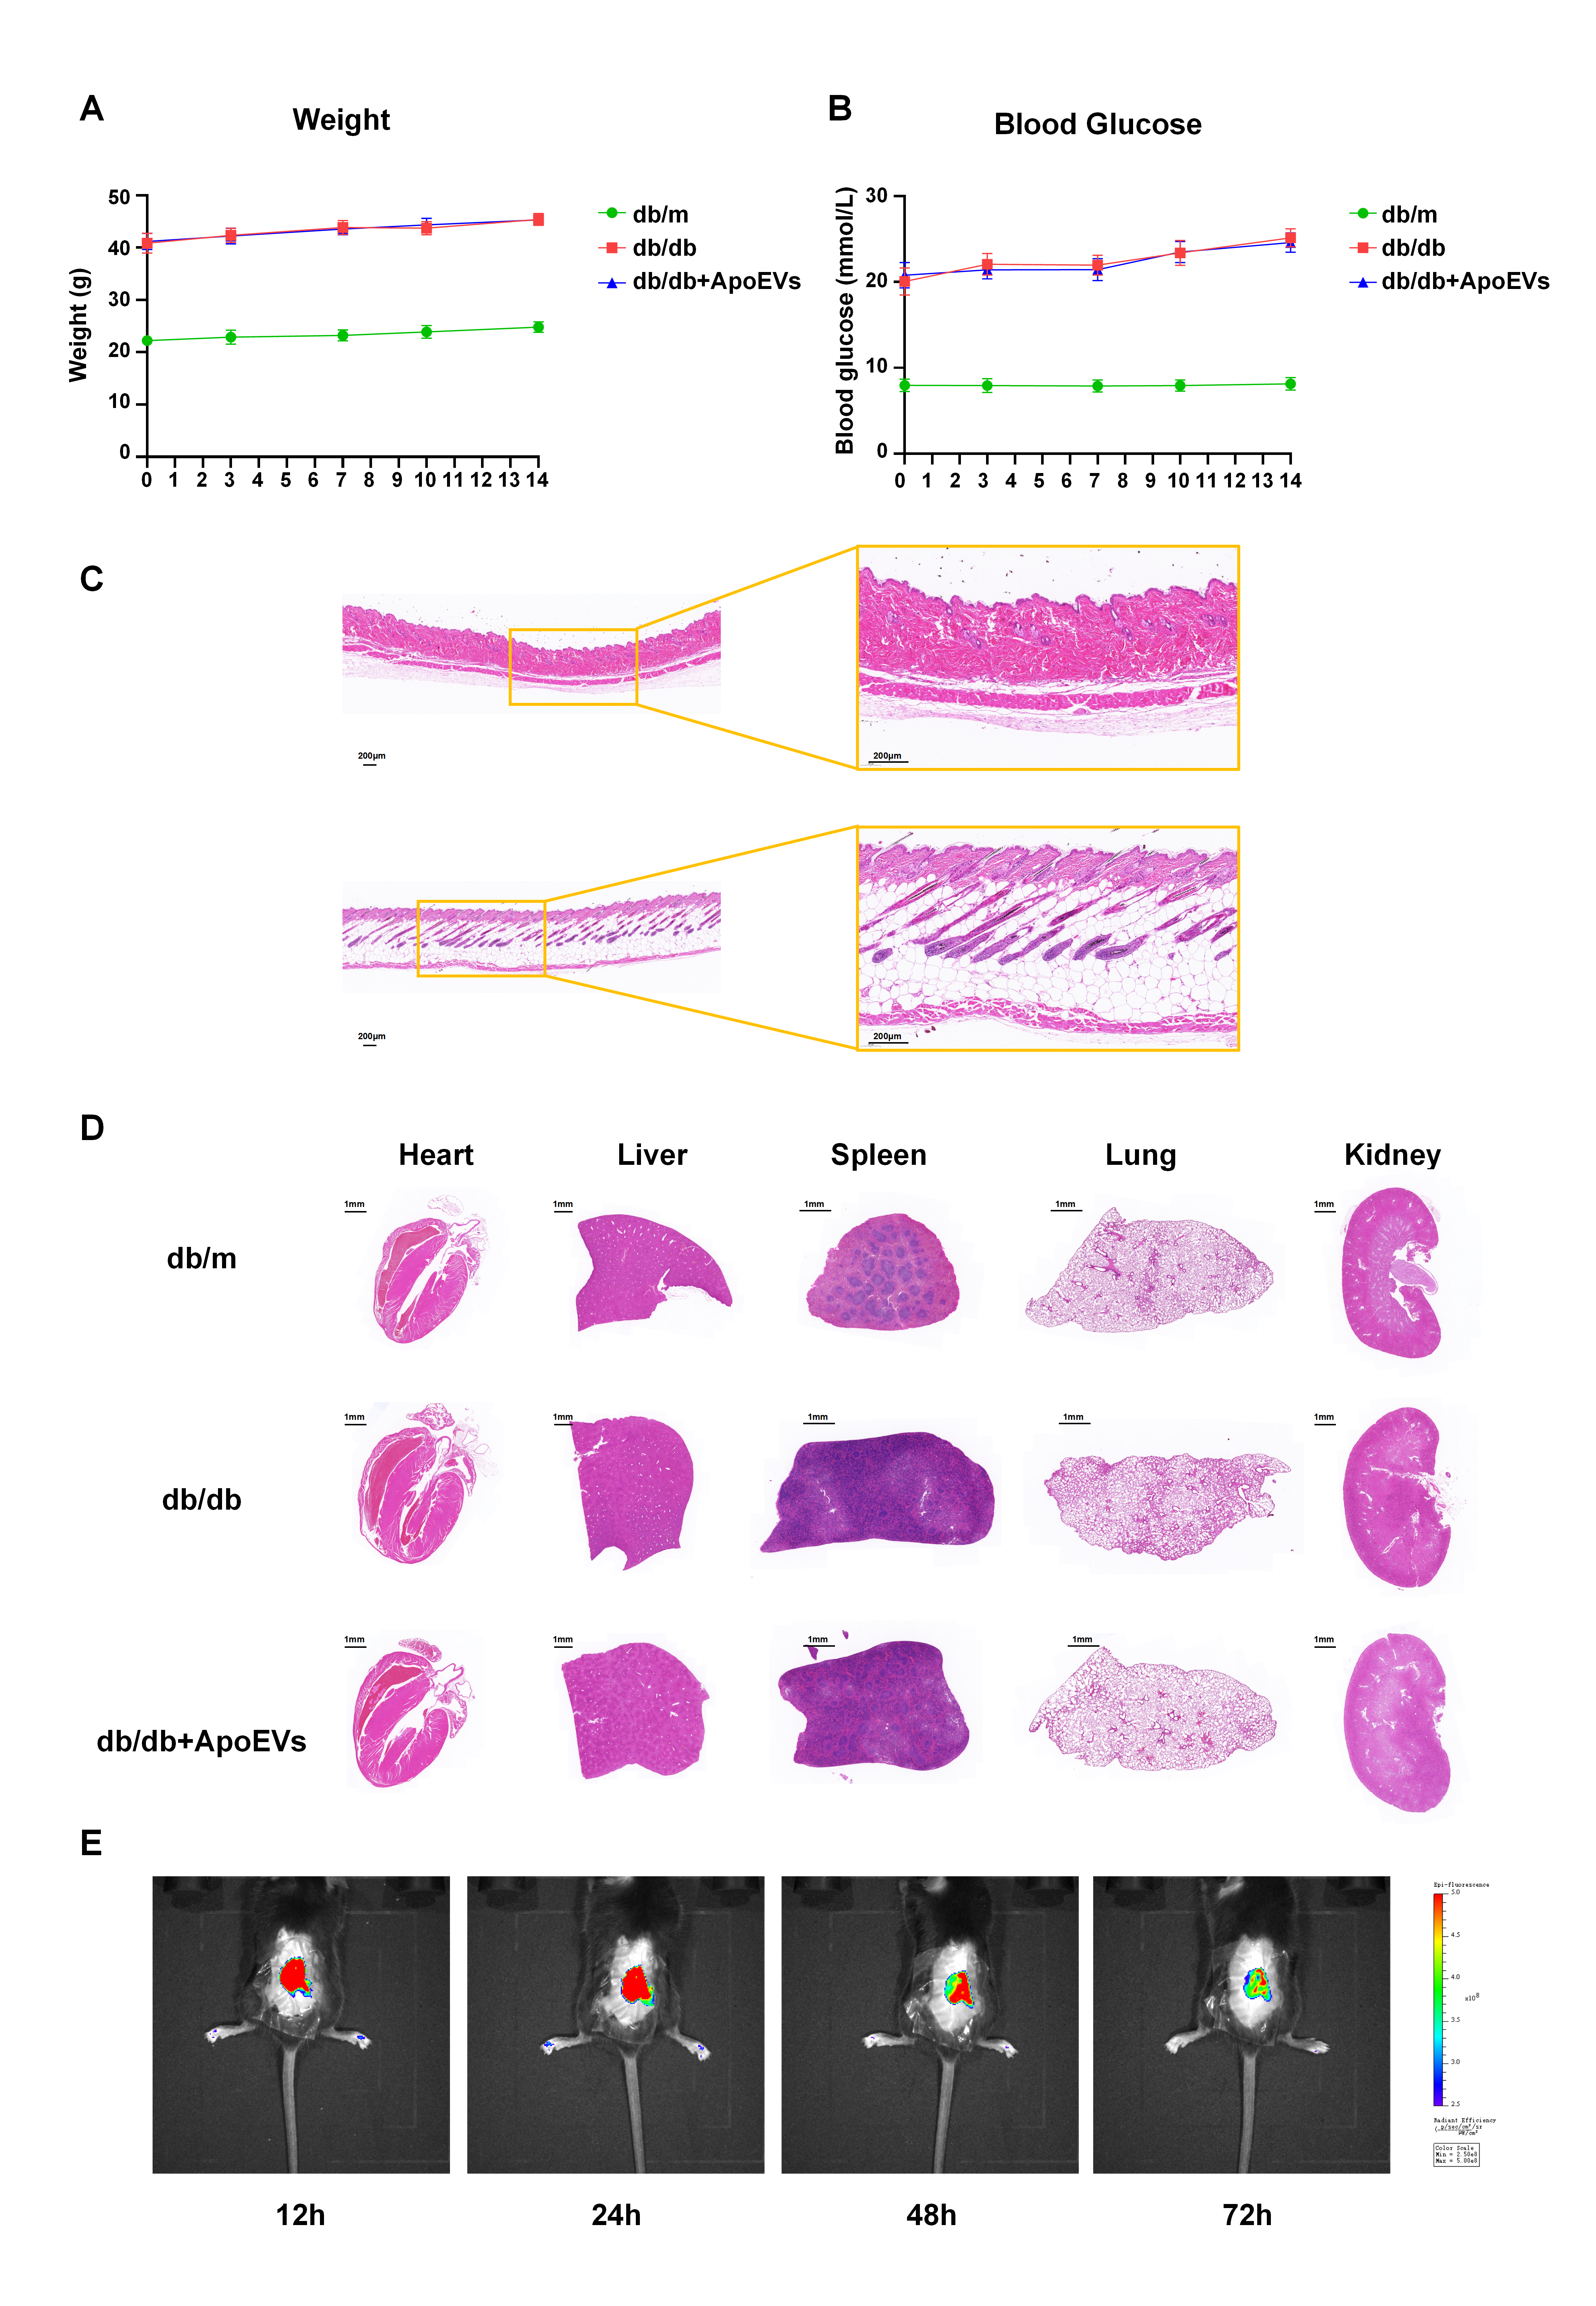
Eight-week-old male db/db and db/m mice were used to establish skin defect healing models (n = 7). Mice were anesthetized with pentobarbital sodium (40 mg/kg) via intraperitoneal injection before modeling. After shaving and cleaning the back, a 1 cm in diameter full-thickness wound was produced on the back skin. Fourteen db/db mice were randomly separated into two groups: the db/db group and the db/db + ApoEVs group. Seven db/m mice served as healthy controls. Commercially available hydrogel Pluronic F-127 (PF-127) (Sigma-Aldrich, USA) was dissolved in PBS at a concentration of 30% at 4°C. UCMSC-derived ApoEVs were then embedded in the PF-127 solution at 4°C, and the amount of vesicles applied to the wounds of db/db + ApoEVs group was 50 µg (100 µl PF-127 solution), as assessed by the BCA assay. Equal volumes of blank gel were applied to db/db and db/m groups, and the wounds were covered with American 3M surgical dressings after surgery. Mice were fed separately. The gel was applied on days 0 and 3, and the dressing was placed on the wound bed until the next time point. The wound area, body weight and blood glucose were measured at 0, 3, 7, 10, and 14 days after surgery, and the wound healing rate was calculated according to the formula: Dn wound healing rate = (D0 wound area − Dn wound area)/D0 wound area × 100%. On day 14, mice were euthanized, and skin tissues were collected for further study.
Histological staining
Specimens of skin tissue were fixed for 24 h in 4% paraformaldehyde and dehydrated with graded ethanol. The samples were then embedded in paraffin and sectioned to a thickness of 3 µm. Hematoxylin and eosin (H&E) staining and Masson staining were conducted with commercially available kits (Baso Technology, China). Digital images were obtained on a slice Pannoramic MIDI scanner (3DHISTECH, Hungary).
Immunofluorescence staining
Cells and skin tissue samples were fixed overnight in 4% paraformaldehyde. Skin tissue samples were dehydrated with 30% sucrose, embedded in optimal cutting temperature (OCT) compound (Lecca, Germany), and cut into 10-µm-thick sections. Cells and sections were permeabilized with 0.05% Triton X-100 (Sigma-Aldrich, USA) at room temperature for 10 min, blocked with 5% bovine serum albumin (Sigma-Aldrich, USA) for 30 min at 37°C, then incubated with primary antibodies overnight at 4°C. The next day, sections were incubated with fluorescent secondary antibodies (Sigma-Aldrich, USA) for 1 h at room temperature. Finally, they were left for 10 min at room temperature with DAPI (Sigma-Aldrich, USA). Cell photographs were taken by confocal microscopy and slice images were scanned by a Pannoramic MIDI scanner (3DHISTECH, Hungary). F4/80 and NLRP3, cleaved caspase-1, and GSDMD double-positive cells were enumerated in cell pictures. Intensities of immunofluorescence were assessed in both cell and slice pictures. Primary antibodies involved in this study included F4/80 (1:200, ab6640, monoclonal antibody), NLRP3 (1:300, ab270449, monoclonal antibody), cleaved caspase-1 (1:1000, 89332s, Cell Signaling, USA), and GSDMD (1:100, ab209845) (all from Abcam, UK).
ELISA
For animal tissues, after 3 days of skin defect modeling, the skin defect area and the surrounding 5-mm-wide full-thickness skin tissues were taken from the mice in each group, homogenized in normal saline, centrifuged at 1000 g. The supernatants were collected for ELISA detection of IL-1β and IL-18. In vitro-cultured BMDMs were stimulated with LPS/ATP and various doses of ApoEVs, and the supernatant was collected and centrifuged at 1000 g following the final induction. The supernatant was collected for IL-1β and IL-18 ELISA detection. IL-1β and IL-18 concentrations were detected by mouse ELISA kit (Neobioscience, China) in accordance with the manufacturer's instructions.
Western blot
For animal tissues, after 3 days of skin defect modeling, the skin defect area and surrounding 5-mm-wide full-thickness skin tissues were taken from the skin, homogenized in RIPA buffer containing protease inhibitors (Beyotime, China), and proteins were extracted. For BMDMs cultivated in high glucose DMEM in vitro, cells at the bottom of the dish and dead cells in the supernatant were collected after stimulation with LPS/ATP and different concentrations of ApoEVs. Proteins were extracted with RIPA buffer containing protease inhibitors (Beyotime, China). All proteins were loaded onto sodium dodecyl sulfate-polyacrylamide (SDS) gels and transferred to polyvinylidene fluoride (PVDF) membranes following BCA quantification (Milipoll, USA). The membranes were then blocked with 5% bovine serum albumin for 2 h at room temperature, treated overnight at 4°C with primary antibodies, and then incubated for 2 h at room temperature with peroxidase-conjugated secondary antibodies (CWBio, China). Protein bands were detected with an imaging system (Tanon, China) and quantified with ImageJ software. The main antibodies included β-actin (1:1000) (CWBio, CW0096, monoclonal, China), GAPDH1 (1:1000) (CWBio, CW0100, monoclonal, China), NLRP3 (1:300, ab270449, monoclonal, UK), caspase-1 (1:100, ab138483, polyclonal, UK), and cleaved caspase-1 (1:1000, 89332s, Cell Signaling, USA) GSDMD (1:100, ab209845, UK).
Lactate dehydrogenase (LDH) assay
BMDMs cultured in high glucose DMEM in vitro were stimulated with LPS/ATP and different concentrations of ApoEVs. The supernatant was collected after the final induction, centrifuged at 1000 g to remove dead cells and cell debris, and the final supernatant was collected and detected with the LDH cytotoxicity assay (Nanjing Jiancheng, A020-2, China), according to the protocol outlined in the instructions.
Reactive oxygen species (ROS) detection
For mouse skin tissue, we modeled the skin defect for 3 days, then removed the skin defect area and the surrounding 5-mm-wide full-thickness skin tissue from each group of mice, homogenized them in normal saline, and filtered them through a 100-µm filter to obtain the cell suspension. The suspension was centrifuged at 100 g to obtain the cell pellet. For in vitro cultured BMDMs, after induction with LPS/ATP and different concentrations of ApoEVs, cells were detached using 0.25% trypsin and centrifuged at 100 g to obtain cell pellets. The above cell pellets were stained with F4/80-APC (Biolegend, 123116, USA) and ROS-FITC fluorescence (50101ES01, Yeasen, China) using a staining working solution according to the staining protocol provided by the manufacturer, washed twice with PBS, and the positive rates and fluorescence intensities of F4/80 and FITC were detected by flow cytometry.
Detection of oxidative stress-related enzymes and products
For mouse skin tissues, after 3 days of skin defect modeling, the skin defect area and surrounding 5-mm-wide full-thickness skin tissues were taken from the mice in each group and homogenized in the extraction buffer or lysis buffer provided by the kit. The supernatant was taken for the detection of oxidative stress-related enzymes and products according to the kit's instructions. For BMDMs cultured in vitro, after induction by LPS/ATP and different concentrations of ApoEVs, 0.25% trypsin was used to detach the cells. Both the dead cells in the supernatant and the cells at the bottom of the culture dish were collected and combined following lysis in the extraction buffer or lysis buffer. Reagents were added according to the kit instructions. Oxidative stress enzymes and products were detected by a microplate reader. The kits involved in this experiment were Catalase (CAT) (KTB1040, abbkine), Reduced Glutathione (GSH) (KTB1600, abbkine), Micro Lipid Peroxidation Malondialdehyde (MDA) (KTB1050, abbkine), and Micro Superoxide Dismutases (SOD) (KTB1030, abbkine).
Statistical analysis
In this study, all data are presented as mean ± standard deviation (SD). Two-tailed Student’s t tests were used to compare two groups, and one-way analysis of variance (ANOVA) with Tukey correction was used to compare multiple groups, using Statistical Software for Social Sciences (IBM, Armonk, NY, USA). P < 0.05 was considered as statistically significant.