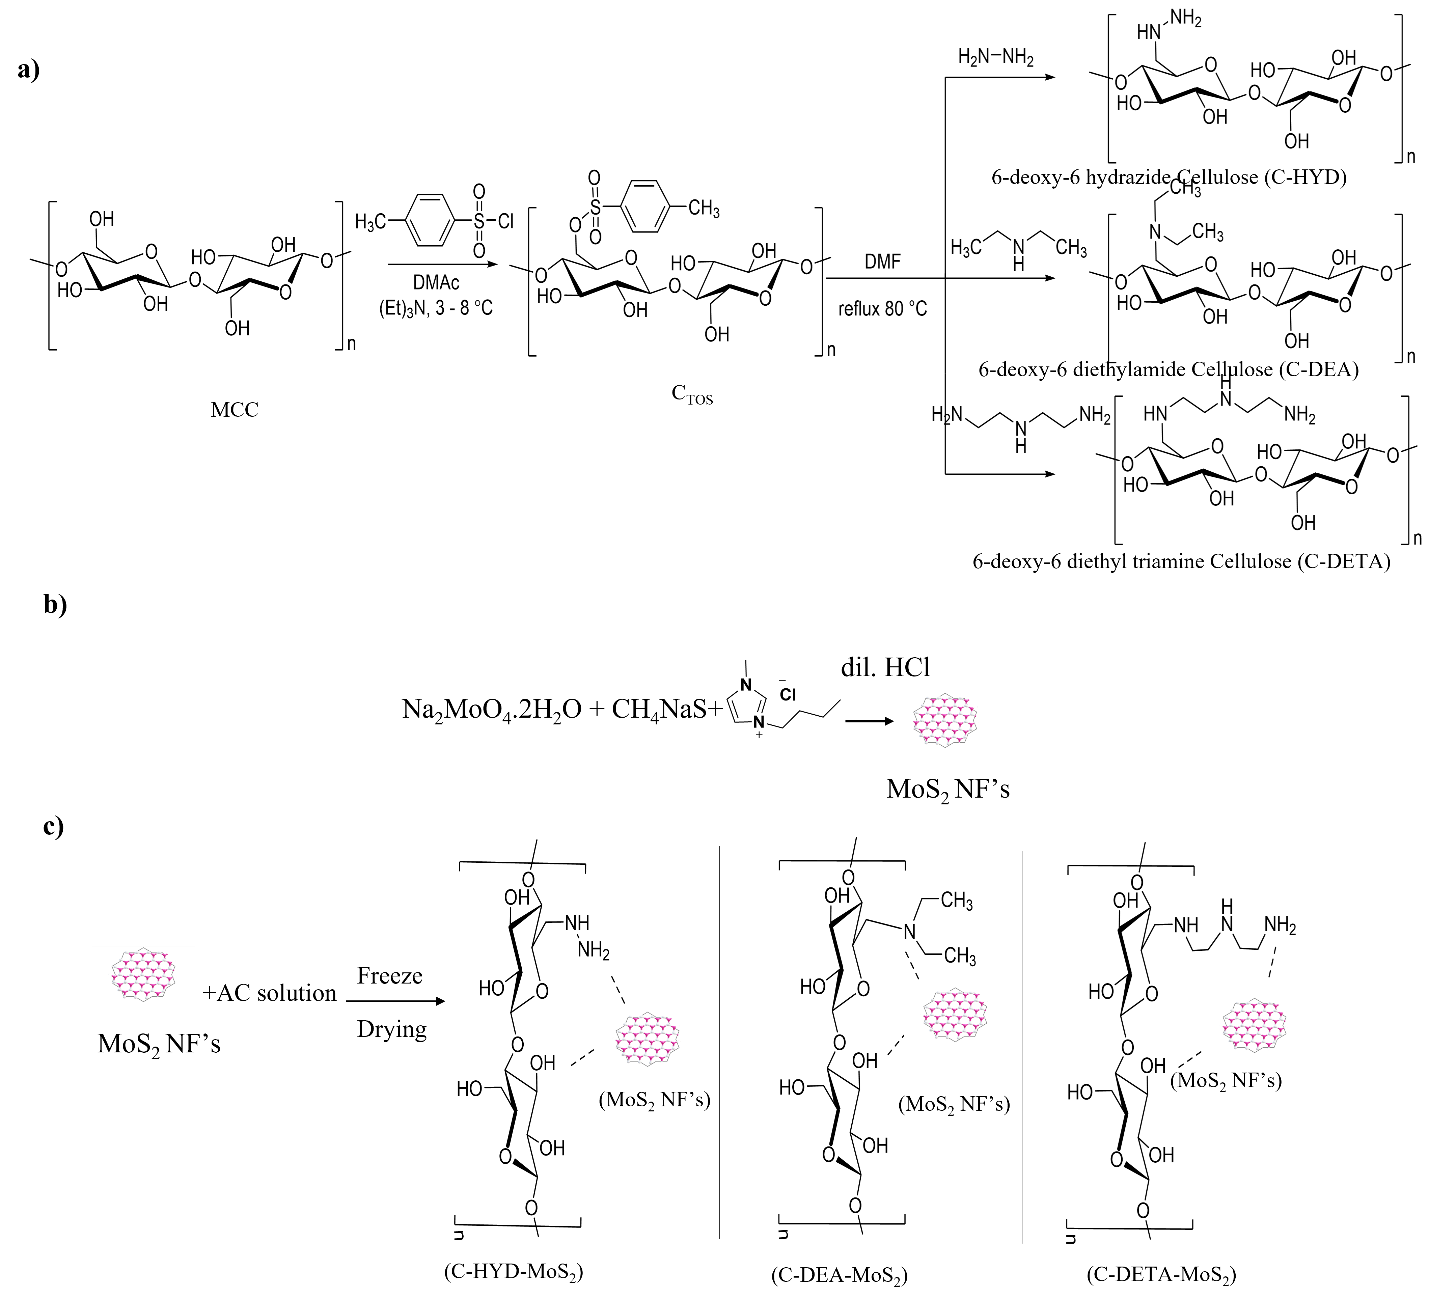
In the beginning MCC was coverted to CTOS by an already reported method. Next, Amino cellulose derivatives (AC’s) were prepared by a simple nucleophilic substitution reaction where CTos was replaced by three different amines to obtain C-Hyd, C-DEA, and C-DETA [25], as presented in scheme 1a). In next step, MoS2 NF’s were synthesized as hsown in scheme 1b)
Finally, to obtain the AC-MoS2 nanocomposites as shown in scheme 1c), AC’s were decorated with MoS2 on their surface by mixing the AC’s solution with MoS2 solution and subsequent freeze-drying to remove the solvent. Due to the presence of nitrogen as a donor atom, amino-functionalized cellulose now coordinated with MoS2 NF’s and improved their dispersal and stability on polymer surfaces.
Synthesized MoS2 NF’s nanoflowres, AC’s and AC-MoS2 were charav = chterized as follows to elucidate their potential as cancer therapeutics.
3.1 Structural Charachterization of MoS2 NF’s
MoS2 NF’s were prepared by the cost effective, high yield hydrothhermal method and charachterized by XRD, and Raman spectra as shown in Fig. 1a) and b). XRD pattern as shown in Fig. 1a) matches with the JCPDS card no. 37-1492 indicating single phase MoS2 NFs. The characteristic XRD pattern was observed at 14.1°, 33.4°, 40.8°, and 57.8° corresponding to (002), (100), (103), and (110), respectively [26]. First peak belonging to (002) plane is broad, and is of low intensity which implicit that the synthesized MoS2 NFs have an astounding fraction of single and few layer MoS2 NF’s [24]. The 002 peak showed a slight shifting of 0.45° which confers a little higher lattice spacing ~ 0.64 nm as compared to reported literature of 0.62 nm [27]. Increase in lattice spacing indicates uniaxial strain along (001) plane of MoS2 NF’s. MoS2 NF’s were further elucidated by raman spectroscopy as shown in of Fig. 1b). MoS2 NF’s clearly exhibit a shorter distance, uniform, and broad Raman band related to E12g and A11g vibrations at 381 and 408 cm− 1at room temperature [28]. FTIR spectra of MoS2 NF’s showed the characteristic peaks of (S = O), ν(Mo-O), δ(Mo-O) at 1197.53, 914, 658 cm− 1, respectively. MoS2 NF’s spectra revealed a high-frequency a band with a broad shoulder extending up to 1900 cm− 1, and having a weakly resolved band at roughly 1700 cm− 1. There are multiple bands of impurities below 1400 cm− 1, as well as 904 cm− 1 for Mo-O and 595 cm− 1 for Mo-S [29].
3.2 Structural Characterization of Aminocellulose (AC’s)
Cellulose amine derivatives AC’s were obtained by nucleophilic substitution reaction. Hydroxyl groups on the MCC surface were activated by tosylation of MCC. Tosylated cellulose was prepared by reacting MCC with p-toluenesuphonylchlrordie in a 1:6 ratio. Elemental analysis using a previously reported method [30] was carried out to confirm the degree of substitution. The degree of tosylation was found to be 0.48, which indicates that 50% of the OH groups were activated to be replaced. The obtained CTOS was then reacted with the selected amines (1:25) to substitute amines on the MCC backbone via “click chemistry. Hydroxyl groups on MCC surface were replaced by hydrazide, diethyl amine and diethyl tetraamine as shown in Scheme 1. In case of AC’s, degree of amination for different amines varied between 0.40 to 0.43. AC’s were watersoluble and zeta potential values confirmed that these have positive charge on its surface. Color, % yield, elemental analysis, Zeta potential, and degree of amination are presented in Table 1.
Table 1
Representing the Color, Elemental Analysis, and Degree of Substitution
| | Color | Yield (%) | Elemental Analysis | Zeta Potential ζ (mV) | DS (Degree of Tosylation) | DS (Degree of Amination) |
| | | | C (Found) | H (Found) | N (Found) | S (Found) | | | |
| MCC | White powder | | 39.82 | 6.39 | - | 0.15 | −4.24 | - | - |
| CTOS | White powder | 77 | 45.55 | 5.55 | 5.01 | 4.8 | | 0.48 | - |
| C-Hyd | Tea pink | 82 | 40.11 | 6.66 | 7.98 | 0.51 | + 32.8 | - | 0.41 |
| C-DEA | Off-white | 80 | 46.01 | 6.26 | 3.45 | 1.00 | + 13.9 | - | 0.40 |
| C-DETA | Brown powder | 89 | 44.01 | 7.71 | 10.55 | 0.66 | + 27 | - | 0.43 | |
3.4 NMR of AC’s
Synthesis of the AC’s from MCC via tosylation was confirmed by the NMR. Figure 2 represents the 1HNMR of the MCC and AC’s. 1HNMR and 13CNMR data of the C-HYD, C-DEA, and C-DETA is represented as follows.
C-Hyd : 1HNMR δ ppm; 3.10–3.00 (m, H of Cellulose), 3.23 (s, –NH2), 3.91–3.46 (m, H of Cellulose), 4.36–4.20 (m, H of Cellulose), 4.69 (s, OH of Cellulose), 5.03–4.96 (d, OH of Cellulose), 5.15–5.09 (d, OH of Cellulose), 5.42 (d, anomeric H of Cellulose), 6.20 (s, –NH) 13C NMR: 109.19 (anomeric), 82.31, 79.57, 76.19, 69.67.
C-DEA: 1HNMR δ ppm; 5.23 (d, anomeric H of Cellulose), 5.03–4.94 (d, H of Cellulose), 4.68 (s, H of Cellulose ), 4.37–4.22 (m, H of Cellulose), 3.92–3.43 (m, H of Cellulose), 3.12–3.01 (m, H of Cellulose), 2.59 (m –CH2–), 1.15 (t, 6H, –CH3). 13C NMR: 101.74 (anomeric), 81.37, 79.16, 67.07, 62.63, 52.44 (–N–CH2–), 7.95 (–CH3).
C-DETA: 1HNMR δ ppm;4.39–4.20 (m, H of Cellulose), 3.74–3.40 (m, H of Cellulose), 3.34–3.19 (m, H of Cellulose), 3.18–3.06 (m, H of Cellulose), 3.09–2.98 (m, H of Cellulose), 3.7 (s, –NH) 2.59–2.69 (m, 8H, CH2), 1.77 (s, –NH–), 1.03 (s, –NH2). 13C NMR: 104.76 (anomeric), 102.84 (anomeric), 81.99, 75.13, 70.15, 69.12, 65.73, 57.18 (–CH2–CH2–NH–CH2–CH2–), 48.61, 46.79, 37.90 (–CH2–CH2–NH–CH2–CH2–).syn.
From Fig. 1 it is clear that along with the MCC backbone hydrogens distinct peaks confirming the synthesis of AC’s were clearly visible in spectra. For instance, C-HYD, NH singlet appeared around 6.2ppm, while NH2 hydrogens were present at 3.23ppm. CH3 triplet at 1.15ppm and CH2 multiplet at 2.59 indicated C-DEA successful synthesis. C-DETA synthesis was evident from NH2 singlet at 1.03 ppm, NH at 1.77 ppm, CH2 multiplet around 2.59-2.69ppm, followed by NH bonded to MCC at 3.7 ppm.
3.4 FTIR of AC and AC-MoS2
Figure 3a) presents the FT-IR spectra of the MCC, amino cellulose derivatives AC’s (C-Hyd, C-DEA, and C-DETA). Table 2 reprents the characteristic peaks observed for the AC. From Fig. 3a) and table it is evident MCC shows characteristic FTIR band positions [31]. Microcrystalline cellulose (MCC) virgin has bands of 3333 (ⱱstrOH), 2891 (ⱱsymCH), and 1625 (ⱱasymC–O–C). Other peaks at 1433, 1364, and 1312 are for ⱱbendCH2 and ⱱwagg vibrations. Skeletal vibrations of CO 1012, ß-glycosidic link 897, out of plane OH bending was at 667 cm− 1. In the case of the C-Hyd, C-DEA, and C-DETA. Table 2 represents the characteristic peaks observed for the AC.
Table 2
Infrared Spectral data of MCC, C-HYD, C-DEA, and C-DETA
| Characteristic Wavenumber cm− 1 |
| MCC | AC |
| Functional Group | Wavenumber | Functional Group | C-HYD | C-DEA | C-DETA |
| ⱱstrOH | 3333 | broad ⱱstr N–H, or –OH | 3276,3325 | 3362 | 3337 3288 |
| ⱱCH | 2891 | ⱱCH | 2889 | 2883 | 2897–2878 |
| ⱱasymC–O–C | 1625 | ⱱasymC–O–C | 1658 | 1662 | 1656 |
| ⱱarom C–H or | 1433 | ⱱbend N–H | 1589 | | 1570 |
| ⱱ CH/CO | 1364 | ⱱasymm, ben C–H | 1466 | 1467 | 1471 |
| ⱱasymm,benC–H, | 1312 | ⱱ CH/CO | 1370 | 1375 | 1367 |
| ⱱstr C–O | 1018 | ⱱasymm,benC–H, | 1314 | 1310 | 1312 |
| ⱱ bridge C-O-C sym. | 897 | ⱱstrC–N | 1170 | 1166 | 1152 |
| oop OH | 668 | ⱱstr C–O | 1032 | 1029 | 1035 |
| | | ⱱ bridge C-O-C sym. | 814 | 845 | 820 |
| | | oop OH | 662 | 664 | 666 |
From Fig. 3a) and Table 2 it is clear that along with the backbone bands of MCC new bands are appearing in AC’s. In C-HYD bands at 3276,3325 (N–Hstr,–OHstr), 1170 (C- N arom), 1589(NH bend), for C-DEA bands at 3362 (OHstr), 1166 (C–Nstr), and DETA bands at 3337, 3288 (NHstr, OHstr), 1570(NHben), and 1152(C–Nstr) are of special interest. Modification of MCC in AC is confirmed by the emergence of the C–N stretch band around 1170 − 1160 cm− 1. This indicated that the OH group of the MCC bone is removed while amines have been decorated on the MCC backnone. For C-Hyd and C-DETA spectra the distinct change in the band intensity in the 3600 to 3200 cm− 1 area verified the addition of NH2 containing molecules on the MCC backbone by replacing OH groups. For Cell-DEA decrease in band intensity validated the substitution of -N-(CH2-CH3)2 in place of OH. These results corroborate the NMR results.
Figure 3b) presents the AC-MoS2 Nanocomposites. In AC-MoS2 nanocomposites, there were found clear indications of the interaction between the MoS2 NF and cellulose. For instance, in the case of MoS2 and MCC bands at 1031 cm− 1 is intensified at 1024 cm− 1 related to anti-symmetric ring stretching is diminished, and 658 cm− 1 related to oop bending of OH shifted to 640 cm− 1, while the band at 555 cm− 1 intensified. In the case of C-HYD-MoS2, the OH band intensity is decreased at 3311 cm− 1, while the band at 1658 cm− 1 is shifted to 1648 cm− 1, the band at 1036 is reduced in intensity and appeared at 1004 cm− 1, band at 619 cm− 1, and 567 cm− 1 are diminished, implying that the NH2 and O-H are involved in an interaction with the MoS2 NFs. In the case of C-DEA-MoS2, the broad band of O-H region 3370 cm− 1 becomes less intensified and appeared at 3354 cm− 1, the band at 1654 cm− 1 become rudimentary, while C-O-C band appears at 1026 cm− 1 shifted to 1006 cm− 1. This can be attributed to the involvement of the O-H of MCC backbone is involved in the interaction with MoS2 NF’s. In case of C-DETA-MoS2, the results were quite interesting, a very low-intensity band at 3280 cm− 1 O-H/N-H was found, whereas bands at 1656 were found at 1642 cm− 1 with a very low-intensity similar band at 1024 was found at 1006 cm− 1. The presence of band position between 1170 to 1160 cm− 1 related to C-N confirmed that during all the modifications to obtain MoS2-loaded amino cellulose derivatives amines are decorated on the MCC backbone. Figure 3b) represents the MoS2 NF loaded AC’s there is a clear change in the intensity of the band position in the O-H and N-H bond area which imply the occurrence of bonding between the MoS2 NFs and amino cellulose. Skeletal vibration related to C-O also lowered in intensity verifying the interaction between the MoS2 NF and the polymer. Shifting of the C-O vibrations to the lower wavenumber indicates strong hydrogen bonding between amino cellulose and MoS2 [32]. Reduction in the band position at 1654 cm− 1 ascribed to in-plane bending of NH2 not only reduced but showed a shift in the position indicating the MoS2 NF and ligand coordination by the amine group. Moreover in literature, band broadness around 1650 cm− 1 is indicative of S-O stretch. Bands around 650 cm− 1 represent the interaction of cellulose with Mo-S as explained in literature [33].
3.4 XRD structure of AC and AC-MoS2
Figure 4 represents the crystallographic structure of the amino cellulose derivatives and AC-MoS2 nanocomposites. MCC was found to be having cellulose type I crystallographic patterns without any doublet in the main peak intensity [18, 34]. MCC has characteristics peaks related to semicrystalline monolithic cellulose type I planes at 2Ѳ = 15.43°, 16.21°, 22.4°, and 34.7° corresponding to the crystallographic planes (110)/(110¯), (200), and (004). The surface of the 200 is hydrophobic while the surface of the (110)/(110¯) planes is hydrophilic [35]. AC has diffraction pattern showing an amorphous structure resulting from the dissolution and chemical modification at 80°C. Diffraction pattern of amino cellulose C-Hyd, C-DEA, and C-DETA at angles 2 Ѳ = 20.6°, 22°, 34.8°, 2 Ѳ = 20.5°, 22.1°, 36.5°, and 2 Ѳ = 20.6°, 22.3°, 35.1°, demonstrate the coexistence of Cellulose I and Cellulose II. For AC-MoS2 nanocomposites, both the amino cellulose derivatives peaks and MoS2 peaks were present. Similar results were observed in the case of g-C3N4/MoS2 composites [23]. In Cell-Hyd-MoS2, derivatives peaks at 22.5° (200) have increased in intensity while at 33.6° (100) and 59.0°(110), peak-related MoS2 was observed. In C-DEA-MoS2, XRD pattern, there was a peak around 22.5° (200) area was still a broad halo, and at 33.6° (100) peak related to MoS2 was present. In C-DETA- MoS2, the Peak related to Cellulose at 22.5° (200) increased in intensity while MoS2 presence was confirmed by a peak around 33.6° (100). From these results, we infer that the MoS2 has been successfully adsorbed on the Amino cellulose derivatives. Furthermore, MoS2 NFs are not only adsorbed but are acting as anchoring sites for the cellulose chains leading to a more crystalline structure as indicated by the increase in the intensity of the peaks for (200) planes around 22.5°. The slight difference between the pristine MoS2 and MCC indicates the assembly and rearrangement during the adsorption process. After nanocomposite formation, the MoS2 crystal plane peak shows a slight shifting as in the case of Cellulose/ MoS2 [36].
3.5 SEM structure of AC and AC-MoS2
SEM micrographs were captured to understand the surface morphology of MoS2, MCC, and AC-MoS2 nanocomposites as shown in Fig. 5. MCC was showing a short rod like morphology under SEM [37]. MoS2 nano-spheres look like a plump and thin fluffy flower as shown in Fig. 5b) [38]. In Fig. 5c-e) amino cellulose derivatives have a smooth surface with highly interconnected structure. There was homogeneous amination of cellulose with a consistent morphology. The dissolution, and freeze drying of the amino cellulose derivatives and adsorption of MoS2 have altered the surface morphology. Moreover, the MoS2 have tightly anchored the surface of the Amino cellulose derivatives as shown in Fig. 5f-k). As anticipated the MoS2 NFs were visible on the surface randomly distributed on the surface. Cell-Hyd-MoS2, and Cell-DETA-MoS2 has a homogenous rough structure where the MoS2 NFs are on the different layers of the amino cellulose backbone, while Cell-DEA-MoS2 has clusters on the surface of MoS2 NFs. It is clear that the concentration was under critical concentration which was enough to have the random distribution and no agglomeration was observed. Energy disperse X-ray spectroscopy (EDS) as shown in Fig. 5l-n) also reinforced the adsorption of MoS2 on amino cellulose by showing corresponding Mo, S, C, and N element detection in sample. In case of MCC/MoS2/Fe3O4, MoS2 and Fe3O4 nanoparticle adsorption on polymer surface made the nanocomposites surface rough [39]. In another report, many MoS2 nanosheets were adsorbed on cellulose surface [40].
3.6 Zeta potential values of AC and AC-MoS2
Zeta potential values of MoS2 NFs were found to be -16 mV. While the Zeta potential values of the MCC were found − 4.24, Cell-HYD + 32.8, Cell-DEA + 13.9, and Cell-DETA + 27 mV. Zeta potential values shift confirmed the successful amination of MCC, these amine groups on the surface of the MCC resulted in the cationic character of the amino cellulose derivatives [25]. MoS2 has a negative charge on its surface [41], we expected that the electrostatic force of attraction between the AC and MoS2 NFs is the binding force on the surface of amino cellulose [10]. These results corroborate the SEM results where MoS2 NFs are found tightly anchored on its surface. Brownian motions and oppositely charged surface potentials governed the heterocoagulation of MoS2 onto cationic amino cellulose backbone. The cationic amino cellulose was found to aggregate in the presence of MoS2 due to the reduced net charge of the colloidal suspensions [42, 43].
3.7 Swelling and degradation studies of AC and AC-MoS2
Swelling analysis of the materials for tissue engineering describes the solute substrate interaction such as solute diffusion, surface chemistry, and solvent retaining capacity. Swelling is important as it gives information about the interaction of the body fluid and the polymer composites [44]. MCC is hydrophilic, while amine derivatives also exhibited swelling. The addition of MoS2 NF’s on the surface of AC’s fine-tuned the swelling ratio of the AC-MoS2. The swelling trend is shown in Fig. 6a). AC MoS2 exhibited slightly higher swelling as compared to the MCC. A similar increase in swelling was observed in the case of Carboxymethyl Cellulose/β-Cyclodextrin/Chitosan with magnetic nanoparticles hydrogel exhibited [45]. GO/MoS2-PVA composite revealed a limited increase in swelling ratios where Mo and S atoms increased the water permeability [46].
Degradation studies elucidate the rate at which ACs and AC-MoS2 will degrade in a physiological environment. Figure 6b) represents the mass remaining at different time intervals. Polymers are large molecules and show degradation by extracellular enzymes [47]. AC and AC-MoS2 were incubated with collagenase type II for 24 hours and the remaining mass was evaluated. MCC degraded faster as compared to the AC with MoS2 NF’s. MoS2 NF’s acted as a nucleating site for the polymer chains and because of increased crystallinity, the AC-MoS2 composites acted stable. Moreover, MoS2 acts as an enzymatic inhibitor and resists enzymatic degradation [48].
3.8 Cell culture studies of AC and AC-MoS2
Negatively charged surface of the MoS2 impede its efficacy against negatively charged surfaces such as cancer cells [49]. As a result, one method to fully exploit MoS2 NF’s anticancer potential is to mix it with a cationic, biocompatible anticancer agent. One such example is Chitosan/MoS2 nanocomposites with remarkable bactericidal capability and excellent biological compatibility [50]. In another instance, MoS2 nanosheets were coated with amino-contained poly((polyethylene glycol) methyl ether methacrylate) (PPEGMA) for drug delivery and photothermal cancer treatment [51]. Therefore we fabricated cationic charge containing AC’s adsorbed with the MoS2 NF’s to use as anticancer therapeutics. To validate our hypothesis we first evaluated the cytotoxicity against four different cell lines against AC’s and then varied the MoS2 concentration from 10, 20,30, 40, 50, 60, 80, and 100µg/mL adsorbed on AC’s to get the IC50 of MoS2 effective in combination with AC’s.
IC50 (half maximal inhibitory concentration)
AC cytotoxicity was assessed by adding serially diluted concentrations of derivatives to four different cell lines such as NIH3T3, B16F10, MDA-MB-231, and MCF-7 in a 96-well plate. IC50 curves were plotted, and these dose-response curves revealed amino cellulose is found selectively cytotoxic against cancer cell by inhibiting metabolic activity as shown in Fig. 6c). From Fig. 6c) Based on IC50 values, for NIH3T3 (263.9 µg/mL), B16F10 (207 µg/mL), MDA-MB-231 (201.6 µg/mL), and MCF-7 (238.9 µg/mL), MCC was not found cytotoxic to any cell line. Amino cellulose derivatives showed the following cytotoxicity trend
MCC˃ Cell DEA ˃ Cell Hyd ˃ Cell DETA.
While the cell lines have the following sensitivity order
B16F10 ˃ MCF-7 ˃ MDA-MB-231 ˃ NIH3T3.
For B16F10 we had the IC50 between 130 to 101µg/mL. Cell DETA outperformed Cell Hyd in anticancer activity against melanoma and breast cancer cell lines, where IC50 values were found between 75 µg/mL and 101µg/mL.
From this data we took 200 µg/mL was safe concentration against the NIH3T3 cells and below this value, the AC’s were selectively cytotoxic against B16F10, MDA-MB-231, and MCF-7, as reported previously [52].
Effective MoS2 concentration with IC50 of AC
Figure 6d, e, and f) represent the concenteration of MoS2 in combination with AC’s, to evaluate the IC50 (half maximal inhibitory concentration) of the AC-MoS2. To check the effect of MoS2 NF’s on the cytotoxicity, we added MoS2 from 10, 20, 30, 40, 60, 80, 100, 200, 250, 500, and 600 µg/mL and plotted IC50 curves. From the analysis of IC50 curves against four cell lines, we found that the cells were sensitive to the dose-dependent response of MoS2. The cytotoxicity effect of AC’s-MoS2 derivatives was increased as compared to the AC’s alone. Figure 6d) indicated that for B16F10, against Cell-Hyd 32 ug/mL of MoS2, for Cell-DEA 32 µg/mL of MoS2, for Cell-DETA 38 µg/mL of MoS2 was found at IC50. Similarly, Fig. 6e) showed that for the MCF-7 cell line, 33, 34, and 32 µg/mL of MoS2 with Cell-Hyd, Cell-DEA, and Cell-DETA were found respectively, at IC50. Figure 6f) showed that in the case of MCF-7 30, 36, 37 µg/ mL of the MoS2 with Cell-Hyd, Cell-DEA, and Cell-DETA, was found effective at IC50.
Further, the cytotoxicity and proliferation inhibition for day 1 to day 3 of MoS2 labeled nanocomposites was carried out by adding 1, 3, and 5 wt % of MoS2 in amino cellulose. These nanocomposites were also monitored against four cell lines, as shown in Fig. 7a, b, c, and d).
In Fig. 7a) or the three days trials in case of AC’s with MoS2 1wt% cells viability decreased from 85–20%, while for 5wt % these values decreased to 12%. In the case of amino cellulose, the cell viability was up to 80% on day 1 when concentration of MoS2 was up to 3%. For 5wt% cell viability changed from 70% on day 1 to 16% on day 3.
Cell DETA has cell viability on day 1 at around 80% which decreased to around 16–20% on day 3. The lowest cell viability was for Cell DEA at 5wt% when 67% of cells survived.
In case of B16F10 cell line, we had the most promising results. Cell viability percentage was as high as 20% for MCC-HYD-MoS2 at 5wt%, Cell Hyd and DETA have 18 to 15% cell viability at all MoS2 loadings, on day 1. For day 3 the cell viability was lowest for Cell DETA at 5 wt %, while all other amino cellulose MoS2 derivatives have cell viability of 6–7%. For MDA-MB-231 cells as in Fig. 7c), interesting results were obtained. On day 1, cell viability was from 28–64%. On day 3, the cell viability was lowest at 19%. While Cell DETA had the minimum cell viability of 12%, for 5wt% MoS2 loadings. Figure 7d) For the MCF-7 cell line 24 hour contact time was found effective, for instance in Cell-HYD we have 30% cell viability on 1% MoS2 loadings, while 29% for 5wt% MoS2 loading. On day 3 cell viability decreased to 16 and 13% for the same above loadings. poly(2-aminoethyl methacrylate) (poly(AEM))and poly(N-(2-aminoethylmethacrylamide) (poly(AEMA)) deposited with gold nanoparticles showed decreased cell viability of J774A1 (mouse monocyte cells)and MCF-7 (human breast adenocarcinoma cells)and were found suitable for biomedical applications [43]. carboxymethyl cellulose and silver nanoparticles (CMC-AgNPs)based nanocomposites exhibited a strong cytotoxic effect on liver cancer cells (HepG2). hydroxypropyl cellulose (HPC), or hydroxypropyl methylcellulose (HPMC) with silver [53].
LIVE/DEAD staining
LIVE/DEAD assay depicts the chromatin and morphology of the cells which is a reliable indicator of healthy, apoptotic, and necrotic cells. Through microscopic examination of Calcein-AM ( live cells fluorescent green, indicating intracellular esterase activity) and ethidium homodimer (dead cells fluorescent as red, indicating loss of plasma membrane activity) stained cells, the apoptosis induction properties of the samples after treatment of the fibroblast (NIH3T3), melanoma (B16F10), human epithelial adenocarcinoma (MDA-MB-231), and human breast adenocarcinoma (MCF-7) cell line were examined in this study. Figure 8a, b, c, and d) displays representative microscopic pictures of LIVE/DEAD stained cells after being exposed for 24 hours to MCC, Cell-Hyd, Cell-DEA, and Cell-DETA with 5wt% MoS2 as found effective in the previous experiment against four cell lines. Apoptotic cells (red) are visible in both AC’s but cell death was found higher in the case of MoS2-loaded AC’s, as shown in Fig. 8. While a higher number of viable cells are visible in AC’s derivatives, it appears that MoS2 loaded AC’s cause more cell death exposing the DNA/chromatin to bind with the ethidium homodimer, than free AC’s does at the same time IC50. While both control and AC’s treated cells did not exhibit a significant amount of cell death.
According to our findings, we suggest that the AC’s with MoS2 NFs provide a reliable anticancer delivery system. In vitro testing compared the cytotoxicity of the pristine amino cellulose derivatives has improved efficacy with MoS2 NF’s concentration. Therefore, it can be asserted that when higher doses of MoS2 NFs 5wt% are used, the administration dose for developed AC’s can be decreased to have an effective clinical response. The dose-dependent side effects are also thought to be lessened. We suppose that our MoS2 decorated AC’s can be used as cancer theranostics.