Research Article
Preparation of Polypropylene-grafted Graphene and its application on Polypropylene/Graphene Nanocomposites
https://doi.org/10.21203/rs.3.rs-2369662/v1
This work is licensed under a CC BY 4.0 License
published 09 Feb, 2023
Read the published version in Journal of Inorganic and Organometallic Polymers and Materials →
You are reading this latest preprint version
Composite materials
Electrical properties
Nanocomposites
The advent of polymer-based nanocomposites has accelerated research on polyolefin nanocomposites [1–5]. Due to the fact that polypropylene (PP) is the most widely used commercial polymer on a global scale, it has garnered considerable attention, particularly for research on PP/carbon-based fillers (such as graphite [6–8], graphene [9–11], and carbon nanotube [12–14]). Graphene is the strongest filler reported to date, according to theoretical and experimental reports [15–17]. As a result, research on graphene-based polypropylene nanocomposites has garnered considerable attention from researchers due to their superior physical and chemical properties [18–20]. However, it has been widely recognized that the performance of PP composites is limited by graphene dispersion and interfacial adhesion between graphene and the nonpolar PP matrix. Given this, extensive research has been conducted on the functionalization of graphene to overcome the aforementioned limitations. Hu et al., [21] described a graphene oxide reinforced polypropylene that was covalently functionalized. The addition of 1 wt% functionalized graphene oxide resulted in a 15.4% improvement over neat PP. Fu et al., [22] discovered that the addition of graphene oxide that was coated with PP latex significantly improved the mechanical and thermal properties of PP. Wang et al., [23] prepared graphene oxide sheets functionalized with 4,4′-diphenylmethane diisocyanate and stearic acid to improve their compatibility with PP. Although there have been a lot of reports conducted on PP/graphene nanocomposites, graphene oxide was used to begin the production of raw graphene materials [24, 25]. Generally, graphene oxide was obtained by oxidizing graphite with KMnO4/H2SO4, which frequently destroys the complete π-electron system of graphene, reducing its reinforcement efficiency [26–28]. Simultaneously, KMnO4 and H2SO4 are unsustainable reagents. Additionally, some researchers have compared graphene oxide and graphene in terms of enhancement efficiency, confirming that the enhancement effect of graphene is more significant than that of graphene oxide [29–31]. In our previous work [32], we synthesized PP/graphene nanocomposites via an in-situ propylene polymerization process. The graphene is evenly dispersed in the PP matrix, which enhances the mechanical properties. However, the enhancement in mechanical properties is less owing to the weak interfacial adhesion between graphene and the nonpolar PP. Thus, it is necessary to explore a new way to modify graphene without introducing new defects.
As a result, we present a facile and rapid method for decorating PP on the edge of graphene via the Friedel-Crafts reaction of chlorinated PP with graphene in this research. The resulting PP grafted graphene (PPG) fillers were used as a master-batch for melting blends with commercial PP. The effects of filler content on the performance of PP/PPG nanocomposites were investigated.
Graphene was purchased from Ma’anshan Wanene New Materials Ltd., China. Anhydrous aluminum trichloride (AlCl3), and carbon tetrachloride (CCl4) were purchased from Tansoole Company, China. Chlorinated PP was purchased from Jiangsu Yihe New Material Co., Ltd. Polypropylene (PP, isotactic, T30s, melt-flow rate: 2.3g/10 min) was purchased from SINOPEC Maoming Company, China.
The PP graft graphene was synthesized by reacting chlorinated PP with graphene and using AlCl3 as a catalyst. The preparation of PPG and the PP/PPG nanocomposites is depicted in Fig. 1.
The graphene was first grafted using CPP via the Friedel-Crafts reaction [33, 34]. A typical experiment began with dissolving 5 g chlorinated PP in 500 mL CCl4 to obtain a homogeneous solution. After that, 5 g graphene was gradually added to the reactor. Following that, the reactor was filled with 0.5 g of AlCl3. Mechanical stirring was used to maintain the reaction temperature at 50 ℃. The Friedel-Crafts reaction was terminated after 24 h by adding 100 mL distilled water and repeatedly washing with water until the PH value reached 7. The PPG product was then precipitated and washed with ethanol and dried for 24 h in a vacuum oven at 80 ℃.
The PP/graphene nanocomposites were synthesized in the second stage by melt blending PPG with commercial PP. The resulting PPG was used as the masterbatch to blend with commercial PP for 10 min at 190 ℃ and 100 rpm in a twin-screw mixer (WLG10G, Shanghai Xinshuo Precision Machinery Co., Shanghai, China). As a comparison, the PP/graphene nanocomposites were also prepared by directly melting the PP and graphene filler in a twin-screw mixer.
The melting temperature (Tm) of the synthesized polymer was measured by differential scanning calorimetry (DSC, TA Instruments) at a heating rate of 10 ℃/min. In order to eliminate the influence of thermal history, the sample was heated to 200 ℃ and kept for 3 minutes. Then the polymer melt was cooled to 30 ℃. The melting point of the material was examined during the second scan. Decomposition temperature analysis was performed using a thermogravimetric analyzer (TGA, Shimazhu) in a N2 atmosphere programmed to heat from 25 to 650 ℃. Additionally, the mechanical properties of PP and PP/PPG composites were determined by a universal testing machine (Instron M4465). The sample gauge had a length of 20.0 mm and a speed of 10.0 mm/min. A scanning electron microscope (SEM), was used to examine the dispersion state and interfacial adhesion of graphene in the PP nanocomposites. The 1H NMR spectra of chlorinated PP and PPG were recorded in 1,2-dichlorobenzene-d4 using a Varian Unity spectrometer (Bruker Advance 400, Switzerland). At room temperature, we use RST-4 four-probe multimeter to measure the conductivity of PP, PP/ graphene and PP/PPG (Guangzhou 4 Probes Tech Co. Ltd, China).
3.1 Fourier Transform Infrared spectroscopy (FT‑IR)
The FT-IR spectra of CPP and PPG are shown in Fig. 2. The CPP and PPG both contain distinctive alkyl (CH and CH2) bands in the range of 2800–3000 cm− 1 and 1440 cm− 1, respectively, which are associated with PP chains. In comparison to the CPP spectrum, the formation of grafted PP at the graphene edge is confirmed due to the presence of C-Cl stretching vibrations between 600 and 700 cm− 1. As can be seen from the figure, the C-C bond is the link between CPP and graphene; however, it is difficult to establish new C-C bond formation by FT-IR method due to the large number of C-C bonds in CPP chain.
The grafting of PP on graphene was also characterized through 1H-NMR. As illustrated in Fig. 3, the chlorinated PP exhibited multiple peaks at 3.4-4.0 ppm and 1.8–2.3 ppm corresponding to the C-H bond near the Cl region. Conversely, the peaks at 3.4-4.0 ppm and 1.8–2.3 ppm are almost completely eliminated after grafting with graphene. As a result, we can confirm that graphene was successfully grafted with PP.
3.3 Thermogravimetric Analysis (TGA) of Graphene, CPP and PPG
TGA under N2 was used to investigate the thermal stability of graphene, CPP and PPG over a temperature range of room temperature to 650 ℃. As illustrated in Fig. 4, graphene is extremely thermostable, with mass loss of > 1 wt%, when heated to 650 ℃. Two degradation steps are observed for CPP. For pure CPP, the 1st weight loss was observed between 250 and 350 ℃, which corresponds to the evolution of HCl molecule. Around this temperature, the Cl radicals formed as a result of the cleavage of -C-Cl bonds abstract hydrogen from the neighbor C-H bond, bring about the loss of HCl molecules from the CPP chain. Between 350–500 ℃, a 2nd significant weight loss occurred. This stage involves the thermal degradation of the CPP backbone, which results in the formation of volatile aromatic compounds and a stable carbonaceous residue. In comparison, between 300–500 ℃, only one broad thermal degradation process was observed for PPG. Additionally, with the addition of graphene, the thermal decomposition process is significantly shifted toward higher temperatures, and the amount of carbonaceous residue is significantly increased. CPP has a char yield of 0.4 wt%, whereas PPG has a char yield of 68 wt%. Given that PPG contains 50 wt% CPP and 50 wt% graphenes, there should theoretically be 50 wt% carbonaceous residues. The residual carbon content, on the other hand, is close to 70 wt%. These findings are not surprising, which layer shaped fillers have been shown to enhance the thermal stability of polymer via the physical barrier effect that slow down the diffusion of degradation products, gases, and heat [35–38].
Figure 5 shows a photograph of graphene and PPG dispersed in xylene at a concentration of 1 mg/ml. After dispersing the nanosheets by ultrasound for 30 min, the mixtures were stand for 24 h. Graphene disperses poorly in xylene. In contrast, the grafting of graphene with organic PP chains makes it lipophilic, so in this case, PPG can be stably dispersed in xylene to form a homogeneous suspension. The good dispersion of PPG becomes further evidence for the successful grafting of PP to the graphene edge.
The resulting PPG filler was then melt blended with commercial PP to create PP/PPG composites with varying levels of PPG filler. The dispersion state of PPG fillers in the PP matrix was investigated by hot-pressing the resulting PP/PPG nanocomposites into films. The micrograph obtained by studying the film in transmission mode with an optical microscope is shown in Fig. 6. The PPG fillers are extremely compatible with the PP matrix and disperse uniformly throughout it. PPG was visible in the morphology of PP/PPG nanocomposites, even at the lowest PPG filler concentration (1 wt%, equivalent to 1wt% graphene). Increased graphene feed resulted in an increase in the amount of graphene nanofiller in the PP matrix.
|
Sample |
PPG Content (wt%) |
Tm (℃) |
Tc (℃) |
∆H (J/g) |
|---|---|---|---|---|
|
PP |
0 |
164.5 |
114.2 |
81.2 |
|
CPP |
0 |
156.2 |
105.1 |
54.5 |
|
PP/PPG Nanocomposites |
1 |
164.7 |
123.7 |
81.9 |
|
2 |
165.8 |
125.6 |
87.2 |
|
|
5 |
166.9 |
125.4 |
74.1 |
|
|
10 |
167.0 |
126.3 |
72.3 |
DSC was used to characterize the effect of PPG on the crystallization of PP. CPP and PP had Tm values of 156.2 ℃ and 164.5 ℃, respectively, as shown in Table 1. PPG has a very weak melting and crystallization peak. The addition of PPG to the PP matrix resulted in a Tm of 164.7–167.0 ℃ for PP/PPG nanocomposites, which was 0.2–2.5 ℃ higher than that of commercial PP. This phenomenon can be attributed to the strong interaction between PPG filler and PP matrix, which limits the movement of PP chain in the process of temperature rise. Additionally, when PPG fillers were added to commercial PP, the non-isothermal crystallization temperature (Tc) increased by 9.5–12.1 ℃. The significantly increased Tc caused by the addition of fillers indicated that the PPG could act as effective nucleating agents for the crystallization of PP. While higher Tc values are critical for industrial applications because they enable the processing cycle to be reduced, thereby increasing production rate. The value of ∆H revealed that the increased crystallinity and decreased fusion heat could have been caused by the doping of PPG fillers, which interferes with the crystallization of PP.
TGA was used to investigate the thermal degradation of PP and PP/PPG nanocomposites with varying PPG filler weight fractions. As illustrated in Fig. 8, we discovered that adding PPG fillers significantly enhanced the thermal stability of PP. Each TGA curve corresponds to a single degradation process. The degradation temperatures of PP and PPG are 402.9 ℃ and 358.0 ℃, respectively, at 5 wt% loss (Td5%). In comparison to the PP and PPG curves, the thermal degradation temperatures of the nanocomposites increased linearly as the PPG filler content increased, indicating a significant enhancement in the thermal oxidation stability of PP. When PPG fillers were added to the PP, the Td5% increased by approximately 18–32 ℃. Additionally, when PPG fillers are added, the Tdmax of the PP/PPG nanocomposites is increased to 478.1-480.9 ℃, which is higher than the Tdmax of pure PP (475.5 ℃). Due to the good dispersion of the PPG filler in the PP matrix, the thermal stability of PP was significantly enhanced after the addition of the PPG filler. This may act as an insulator between the heat source and the surface of the PP where combustion occurs.
Additionally, the char yield of PP/PPG composites was markedly greater than that of neat PP (0.3 wt% at 600 ℃). As a result, PPG fillers may serve as a catalyst for the formation of char in the degradation of PP polymer. The char yields of neat PP and PP/PPG composites containing 1 wt%, 2 wt%, 5 wt%, and 10 wt% PPG fillers were used in the following proportions: 0.3 wt%, 1.5 wt%, 2.0 wt%, 3.4 wt%, and 4.4 wt%. This is not surprising since layered fillers have been shown to enhance the thermal stability of composites by retarding the physical barrier effect [35–38].
|
Sample |
Filler Content (wt%) |
Tensile Strength (MPa) |
Modulus (MPa) |
Elongation at Break (%) |
|---|---|---|---|---|
|
PP |
- |
30.2 |
560 |
920 |
|
PP/PPG Nanocomposites |
1 |
35.1 |
719 |
1000 |
|
2 |
39.4 |
825 |
880 |
|
|
5 |
42.4 |
861 |
930 |
|
|
10 |
39.5 |
1130 |
860 |
|
|
PP/Graphene Nanocomposites |
0.5 |
30.3 |
651 |
1400 |
|
1 |
28.4 |
880 |
714 |
|
|
2 |
27.5 |
707 |
13 |
|
|
5 |
27.3 |
826 |
12 |
The effects of PPG fillers on the mechanical properties of PP have been investigated, and the results are summarized in Table 2. Additionally, the mechanical properties of PP/graphene nanocomposites were investigated for comparison. In comparison to PP, the addition of graphene fillers to the PP matrix does not result in a noticeable increase in tensile strength, especially at higher graphene feed contents, which could be owing to the poor dispersion states of the graphene fillers in the PP matrix and graphene aggregation via π-π stacking. The low dispersion state of pristine graphene in the PP matrix may be a result of the poor compatibility between graphene and the PP matrix. When the graphene content was greater than 1 wt%, the elongation at break values significantly decreased. It is very remarkable that the presence of PPG filler has a significant strengthening effect. When 5 wt% PPG filler is added, the tensile strength is increased by 40.4% and the modulus is increased by 53.8%. When 10 wt% PPG filters were used, the modulus increased by 102% when compared to PP. Interestingly, despite the incorporation of a large amount of PPG to PP matrix, the elongation at break values remained nearly unchanged. These results can be attributed to the well dispersed PPG nanosheets in PP/PPG nanocomposites, because the PP chain is connected to the edge of graphene, which makes it hydrophobic, thus enhancing the compatibility between graphene and PP matrix. Generally speaking, the good dispersion of PPG filler in PP matrix and the strong interfacial adhesion between two different components contribute to the transfer of stress from PP matrix to dispersed PPG phase.
The fracture surface of PP/graphene and PP/PPG nanocomposites was characterized by SEM (Fig. 9). PP has a typical semi-brittle fracture surface with a relatively smooth surface. Whereas, when graphene or PPG is present, the surface becomes coarser and more ductile, with numerous fracture ditches and apparent plastic deformations. This indicates that PP/graphene and PP/PPG nanocomposites show ductile fracture mode and consumption. In the case of PP/graphene nanocomposites containing 1 wt% graphene, the graphene fillers are dispersed within the PP matrix and exhibit no obvious aggregation. When a significant amount of graphene is added to the PP matrix, graphene aggregates. Simultaneously, due to the low interfacial compatibility of PP and graphene fillers, phase separation between graphene and PP was observed. In the case of PP/PPG nanocomposites, the PPG filler was visible within the PP matrix. When a large amount of PPG is added to the PP matrix, it can be seen that the PPG fillers are distributed uniformly throughout the PP matrix. It is worth noting that, in comparison to PP/graphene nanocomposites, PPG and PP are nearly completely compatible and tightly bound, making phase separation almost impossible to detect. These findings are strongly related to the PP chains connected to the graphene edge, which render the surface of PPG fillers hydrophobic, thereby increasing their compatibility with the PP matrix.
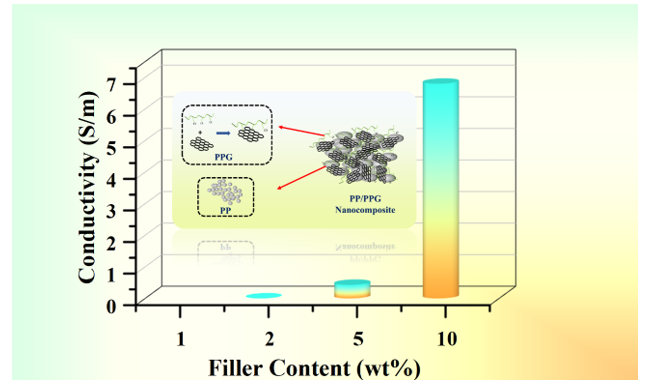
Generally, increased dispersion of conducting fillers in the polymer matrix aids in the formation of a conducting network. Additionally, because the Friedel-Crafts reaction occurs only at the graphene edge, the overall π-π conjugated structure is retained, thus preserving the high electrical conductivity of graphene. As shown in Table 3, PP/graphene nanocomposites conduct significantly less than PP/PPG nanocomposites. Even with 5 wt% graphene fillers, the PP/graphene nanocomposite has a low conductivity of 6.2×10− 4 Sm− 1. Compared with pp/ graphene nanocomposites, PP/PPG nanocomposites showed significantly improved conductivity, resulting in a sharp transition from insulation to conductivity. Additionally, with 10 wt% PPG fillers (equivalent to 5 wt% graphenes), the conductivity approaches 6.8 Sm− 1. The resulting PP/PPG nanocomposite was used as conductors in a light-emitting diode (LED) lamp lighting test. When PP was connected to the circuit, the LED lamp did not illuminate. Conversely, the LED lamp illuminated when PP/PPG nanocomposites with 10 wt% PPG fillers were used to connect the circuit. The results corroborated those obtained from conductivity measurements. The conductivity difference between PP/graphene and PP/PPG nanocomposites highlights the key role of improving the dispersion of conductive fillers and conductivity of polymers.
|
Sample |
Filler Content (wt%) |
Conductivity (S/m) |
|---|---|---|
|
PP |
- |
- |
|
PP/PPG Nanocomposites |
1 |
- |
|
2 |
8.4×10− 9 |
|
|
5 |
4.3×10− 1 |
|
|
10 |
6.8 |
|
|
PP/Graphene Nanocomposites |
0.5 |
- |
|
1 |
- |
|
|
2 |
- |
|
|
5 |
6.2×10− 4 |
A PPG was successfully prepared in this study via the Friedel-Crafts reaction of chlorinated PP on a graphene edge. We successfully fabricated PP/PPG nanocomposites using PPG as a masterbatch via the melt blending method. Compared with pure PP, on the one hand, PPG shows a better dispersion state, on the other hand, there is a strong interfacial adhesion between PP and PPG filler. As a result, PP/PPG nanocomposites exhibit significantly enhanced thermal stability and mechanical properties. Additionally, with 10 wt% PPG fillers (equivalent to 5 wt% graphenes), the conductivity approaches 6.8 Sm− 1. Therefore, this work established a new idea for the preparation of high-performance PP composites with excellent thermal stability, rigidity and toughness.
Acknowledgements
This work was supported by the National Research foundation of Korea (NRF) grant funded by the Korea government (MIST) (No. NRF-2018R1A5A1025137 and No. NRF-2019R1A2C3003890), and the National Natural Science Foundation of Jiangsu Province (No. BK20210894).
No competing interests reported.
published 09 Feb, 2023
Read the published version in Journal of Inorganic and Organometallic Polymers and Materials →
Editorial decision: Major revision
07 Jan, 2023
Reviews received at journal
16 Dec, 2022
Reviewers agreed at journal
15 Dec, 2022
Reviewers invited by journal
15 Dec, 2022
Editor assigned by journal
13 Dec, 2022
Submission checks completed at journal
13 Dec, 2022
First submitted to journal
12 Dec, 2022
You are reading this latest preprint version