4. 1 Generation of knockout mice
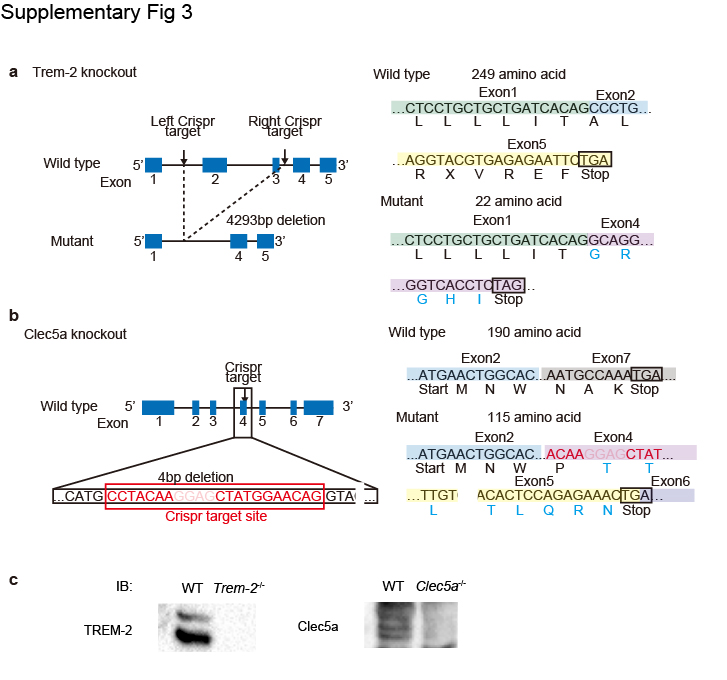
We conducted all animal studies following protocols approved by the institutional committee on animal resources (# 20-0062). Mice were maintained under specific pathogen-free conditions. All mice strains used in the study had a C57BL/6 background. Siglec-15-/- mice were generated by homologous recombination as previously described [7]. FcRγ-/- mice generated by homologous recombination were donated by Dr. Takai (Tohoku University) [35]. Trem-2-/- and Clec5a-/- mice were generated using the CRISPR/Cas9 gene-editing technique (Supplementary Fig. 3). The guide RNA (gRNA) was briefly inserted into the pX330-U6-Chimeric BB-CBh-hSpCas9 plasmid vector using the BbsI restriction enzyme site, and the vectors were injected into the pronuclei of pronuclear-stage embryos of C57BL/6J female mice. These embryos were transferred into foster mothers, and then the male and female founders carrying a heterozygous (+/−) deletion mutation were inbred to produce homozygous (−/−) mice. The design of the pX330-guide and injection, followed by the transfer of embryos, was performed at the Laboratory Animal Resource Center at the University of Tsukuba. DAR/FcRγ double knockout mice were obtained by crossing each DAR-deficient strain with the FcRγ-deficient strain. The presence of mutations in knockout mice was confirmed by PCR genotyping and sequence analysis using primer sequence sets (Supplementary Table 1). We investigated body length and weight of the deficient mice longitudinally for a period of one year starting at 10 weeks of age.
4.2 X-ray imaging and BMD measurement
X-ray imaging and DXA of the 14-week-old mice were performed by Kureha Special Laboratory Co. (Fukushima, Japan). The left femur BMD (mg/cm2) was calculated from the bone mineral content (mg) and bone area (cm2).
4. 3 Micro- CT analysis
The left femurs of the 14-week-old mice were scanned by micro-CT (R_mCT2; Rigaku, Japan) at a 10 μm isotropic resolution. One hundred slices covering a 1000-μm area of interest and encompassing the distal metaphysis region, which started from 300 μm proximal to the growth plate, were used to assess bone morphology. Measures of trabecular bone and cortical bone parameters, including trabecular BV/TV, Tb.Th, Tb.N, Tb.Sp, and cortical bone thickness (Ct.th), were performed using TRI/3D-BON software (Ratoc System Engineering Co., Japan) following guidelines previously mentioned [36].
4.4 Histology and histomorphometry
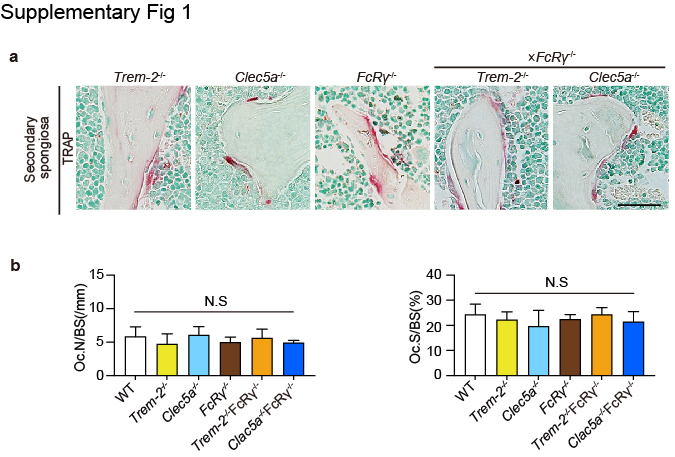
The distal femur of 14-week-old mice was fixed in paraformaldehyde, decalcified with 5% ethylenediaminetetraacetic acid disodium salt, and embedded in paraffin. Sections were stained for TRAP with methyl green (Vector Laboratories, Ontario, Canada) counterstain to observe osteoclasts. The images were obtained using a BX53 microscope (Olympus, Tokyo, Japan). For dynamic bone histomorphometry, tetracycline (25 mg/kg, Sigma-Aldrich, MP, USA) and calcein (20 mg/kg; Dojindo Laboratories, Kumamoto, Japan) were subcutaneously injected at 4 and 2 days before the mice were euthanized. The right tibias of 14-week-old mice were fixed in 70% ethanol and stained with Villanueva Bone Stain. The undecalcified bone sections were prepared, and histomorphometric analysis was performed blindly at the Ito Bone Histomorphometry Institute (Niigata, Japan). The number of osteoclasts on bone surface (N.Oc/BS) and Oc.S/BS at the primary and secondary spongiosa were measured using ImageJ software (National Institutes of Health, Bethesda, MD, USA). Primary spongiosa was defined as the area 250-μm proximal to the growth plate. The secondary spongiosa was defined as the area 250–1000-μm proximal to the growth plate. Cartilage remnant at the primary spongiosa was measured as a percentage of the trabecular bone area using sections stained with Safranin O.
4.5 In vitro osteoclastogenesis
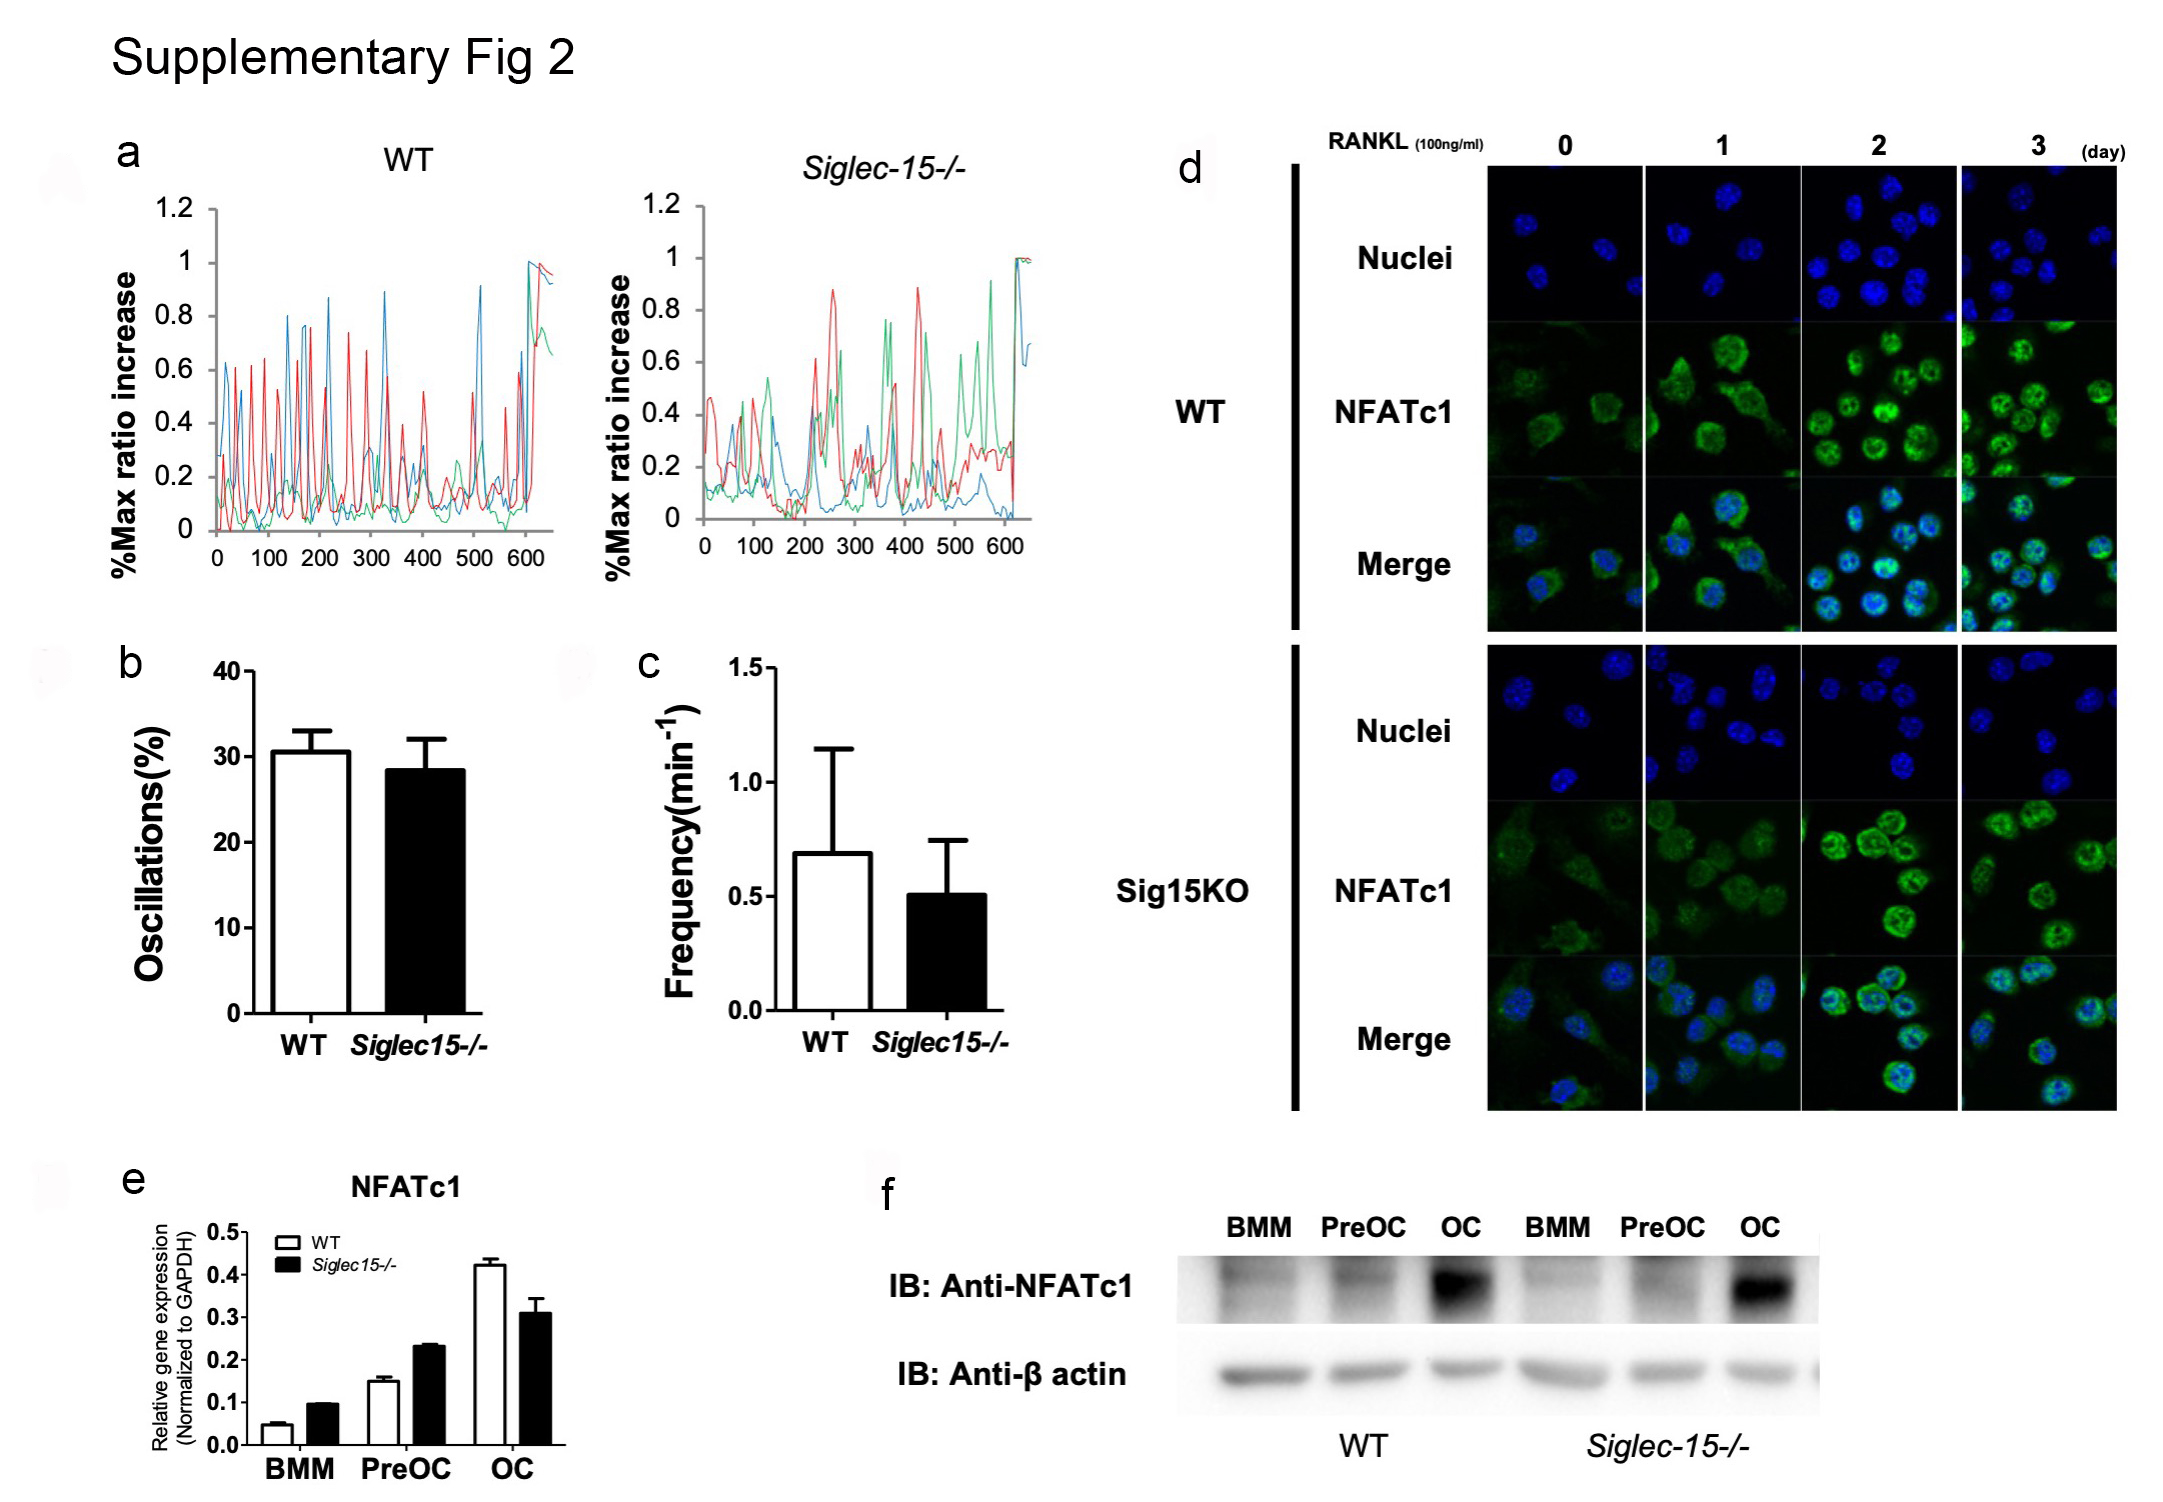
BMMs were harvested from the femurs and tibia of 7- to 9-week-old mice, and osteoclast differentiation from BMMs was performed as previously reported [7]. The BMMs were cultured with 10 ng/ml M-CSF (PeproTech, London, UK) and 100 ng/ml RANKL (PeproTech) to generate osteoclasts for five days at 37 °C in a 5% humidified CO2 incubator, and osteoclastogenesis was confirmed by TRAP staining using a histochemical kit (Sigma-Aldrich, MO, USA). TRAP-positive multinucleated cells with at least three nuclei were counted as multinucleated osteoclasts.
4.6 In vitro resorption assay
The BMMs were cultured with M-CSF and RANKL to generate osteoclasts on bovine bone slices for ten days. Cells were removed by ultrasonic disruptor and then stained with 20 μg/ml peroxidase-conjugated wheat germ agglutinin (Sigma) and 3,3’-diaminobenzidine (0.52 mg/ml in phosphate buffered saline (PBS) containing 0.1% H2O2) (Tokyo Kasei Industries, Tokyo, Japan). Resorption pit areas were measured using ImageJ software. [7].
4.7 RNA sequencing
pOC were generated by treatment with M-CSF and RANKL for 3 days. The BMMs and pOCs of wild type (WT) and Siglec-15-/- mice were lysed with TRIzol Reagent (Thermo Fisher scientific, MA, USA) and harvested for RNA extraction. Total RNA was extracted using RNeasy Plus Mini Kit (Qiagen, Hilden, Germany) according to the manufacturer's instructions. The integrity of samples was assessed by determining 28S/18S ribosomal RNA bands with an Agilent 2100 bioanalyzer (Agilent Technologies, Santa Clara, CA). High-quality libraries assayed by Bioanalyzer High sensitivity DNA kit (Agilent) were subjected to NovaSeq 6000 (Illumina, CA, USA). Sequencing yield was typically ∼25 million strand-specific reads. The obtained mRNA sequencing reads were mapped against the mouse genome (GRCm38) using STAR version 2.5.3a and gene expression level was quantified using RNA-Seq by expectation-maximization (RSEM) version 1.2.31 [37]. Differential expression analysis was performed with the edgeR package (version 3.22.5) within the R programming environment (version 3.5.1). Genes with a FDR < 0.01 were judged to be DEGs. Furthermore, GO analysis and KEGG analyses were used to investigate the roles of genes upregulated by M-CSF and RANKL stimulation in WT but not in Siglec-15-/- cells by using the Database for Annotation Visualization and Integrated Discovery online tools (DAVID: https://david.ncifcrf.gov/). The RNA-seq data included in this study are publicly available at the Gene expression omnibus (GEO) database (https://www.ncbi.nlm.nih.gov/geo/) with an accession number GSE218768.
4.8 Immunoblot analysis.
The BMMs were cultured in the presence of M-CSF (30ng/ml) and RANKL (100ng/ml) . The medium was removed, and the cells were washed twice with ice-cold PBS. Cell lysates were then extracted using the PhosphoSafe Extraction Reagent (Novagen, Madison, WI, USA) with protease inhibitor cocktail set Ⅲ (Calbiochem, San Diego, CA, USA). Immunoprecipitation experiments were performed using the Dynabeads Protein A immunoprecipitation kit (Invitrogen, Carlsbad, CA, USA) according to the manufacturer’s instructions. Lysates were subjected to immunoblot or immunoprecipitation analyses using the indicated antibodies. The sources of antibodies are as follows: anti-phosphotyrosine (p-Tyr) antibody (4G10, 05-321) was purchased from Merk-Millipore (Darmstadt, Germany); anti-p130Cas (397666) and anti-Crk (397452) antibody were purchased from Becton-Dickinson biosciences (NJ, USA); Syk (#2712), phospho-CrkⅡ (Tyr221, #3491) phospho-Syk (Tyr519/520, #2710), Src (#2108), phosphor-Src (Tyr416, #2101), and β-Actin (#4967) antibodies were purchased from Cell Signaling Technology (MA, USA). The amount of active Rac1 or Rap1 was determined by affinity precipitation using the active Rac 1 pull-down and detection kit (Thermo Fisher scientific) and Rap1 activation assay kit (Millipore, MA, USA).
4.9 Statistical analysis
Statistically significant differences among groups were determined by one-way analysis of variance (ANOVA) followed by the Tukey test for multi-group comparison. In the longitudinal analysis, Two-way ANOVA followed by the Tukey test was used to test for significant difference. P < 0.05 was considered statistically significant. All data are shown as mean ± standard deviation Statistical analysis was performed using Prism software (Graph Pad Prism version 8.4.3, USA).
4.10 Data Availability
The datasets generated during and/or analysed during the current study are available in the GEO repository, https://www.ncbi.nlm.nih.gov/geo/query/acc.cgi?acc=GSE218768.