2.1 Synthesis of SiO2@FexOy
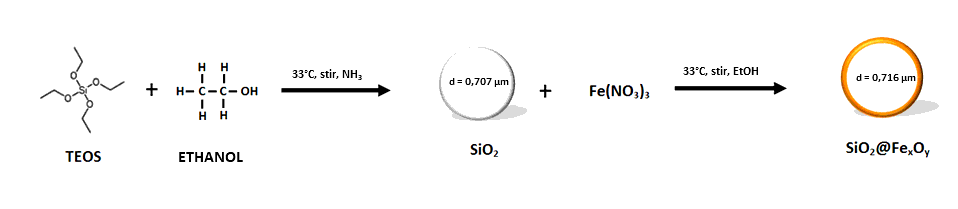
SiO2@FexOy particles were synthesized in a two-step process. In step 1, monodisperse silica spheres were synthesized following a sol-gel process previously reported [18]. Shortly, 4.2 mL of tetraethyl orthosilicate (TEOS) were injected (one-way 10 mL syringe with metallic needle) through a septum into a solution of 22 mL NH3 in H2O (30% w/w) and 64 g of absolute ethanol. This solution contained in a 500 mL round bottom flask with one neck was previously warmed up in water at 33°C. One hour after injecting TEOS, the white solid particles were separated from the solution (centrifugation at 5000 rpm for 5 min). Then, particles were washed by dispersing in 100 mL of distilled water and separating the liquid (centrifugation at 5000 rpm for 5 min) three times. Afterwards, particles were washed three times using a similar procedure, but using absolute ethanol instead of water. Finally, the solid particles were dispersed in 100 mL of absolute ethanol.
In step 2, a solution of 0.14 g of Fe(NO3)3.9H2O in 10.00 mL of absolute ethanol was added drop-wise from a burete a to the dispersion of silica spheres in a 500 mL round flask with one neck under magnetic stirring. Previously, the flask with the dispersion was allowed to warm up in water at 33°C (closed with a septum). After addition of the iron precursor, the flask remained closed under stirring overnight. The originally white dispersion turned yellow (Scheme 1). Finally, the solid particles were separated from the solution (centrifugation at 5000 rpm for 4 min) and dried at 60°C overnight
2.2 Characterization of Materials
Scanning Electron Microscopy (SEM). SEM images were obtained for silica and SiO2@FexOy particles after covering with ca. 10 nm gold. Measurements were performed with a microscope JEOL JCM-6000 Neo Scope. To determine particle size distribution, the diameter of 96 silica particles and 66 SiO2@FexOy particles were measured. A detailed description of the procedure is in the supplementary information. Thickness of shells was estimated by subtracting the mean diameter of particles after and before addition of the iron precursor.
Energy-dispersive X-ray Spectroscopy (EDX). Presence of oxygen, silicon, and iron and their distribution in particles was estimated with EDX. Measurements were performed with a microscope JEOL JCM-6000 Neo Scope.
Thermal Gravimetric Analysis Differential Thermal Analysis (ATG-DTA). ATG-DTA were performed with the equipment TG-DTA and TMA Rigaku Evo plus II either under air or N2 from room temperature up to 1000°C at 10°C.min− 1.
X-Ray Diffraction (XRD). The diffractogram from the material after the synthesis was obtained in reflexion mode with the x-ray diffractometer Philips PW-3710.
Removal of Fluoride in batch systems. The removal of fluoride in batch systems with SiO2@FexOy was studied with 22 factorial design [19]. Studied factors were solid-to-liquid ratio (S/L) and time after forming the batch system. Levels were 1 and 10 g.L− 1 in the former and 30 and 120 min in the latter. The fluoride concentration in an aqueous solution was measured with a selective fluoride ion electrode (VAN LONDON-PHOENIX) according to [20]. For each measurement, a sample was taken from the batch system, and it was centrifuged at 1500 rpm for 15 min. The supernatant was then separated and diluted 1:1 with TISAB buffer. Finally, the electrode was immersed in that solution while stirring, and the reading was taken in mV. The concentrations in milligrams per liter were obtained from the calibration curve data as indicated by the method.
Cyto- & Genotoxicity of SiO2@FexOy particles
Cell culture. The A549 human lung carcinoma cell line was cultured in DMEM supplemented with 10% FBS, 100 U/mL penicillin, and 100 µg/mL streptomycin at 37°C in a humidified atmosphere with 5% of CO2. Cells were seeded in a T75 flask, and when 80–90% of confluence was reached, cells were subcultured using TrypLE™. Experiments were carried out in multiwell plates, where cells were allowed to attach and were washed with DMEM before each treatment.
Cell viability assay. Monolayer cell viability was determined using 3-(4,5-dimethylthiazol-2-yl)-2,5-diphenyltetrazolium bromide (MTT), which is reduced by mitochondria in viable cells to a purple formazan dye [1]. Briefly, 2.5 x 10⁴ cells were seeded on 96-well plates and incubated at 37°C. After 24 h, cells were exposed to different suspensions of each particle for 24 h. Afterward, the monolayers were washed and incubated with 0.5 mg/mL of MTT in DMEM for 3 hours. The absorbance of the formazan extracted with DMSO (100 µL/well) was recorded at a wavelength of 570 nm by using a multiplate reader Multiskan FC (Thermo Scientific). The cell viability is shown graphically as a percent of the control value.
Genotoxicity study. For detection of DNA damage, the single cell gel electrophoresis assay (Comet assay) was employed based on the method of Singh et al. [2] with minor modifications. Briefly, A549 cells were treated with different suspensions of the particles. After 24 h, cells were suspended in 0.5 % low melting point agarose and immediately poured onto microscope slides precoated with 0.5 % normal melting point agarose. Two slides were prepared for each condition; one slide was used to observe double and single-stranded DNA breaks and the other was used to obtain information on the presence of oxidized DNA bases using digestion with the enzyme EndoIII [3]. Slides were immersed in ice-cold lysis solution (2.5 M NaCl, 100 mM Na2-EDTA, 10 mM Tris–HCl, 1% Triton X-100, 10% DMSO at 4°C, pH 10) for 1 h to lyse the cells, remove cellular proteins and to allow DNA unfolding. After that, the slides were washed three times with enzyme buffer (0.1 M KCl, 0.5 mM Na2-EDTA, 40 mM HEPES–KOH, 0.2 mg/ml bovine serum albumin (BSA), pH 8.0) and incubated for 45 min at 37°C with EndoIII in the enzyme buffer or with buffer alone. Then, the slides were placed on a horizontal gel electrophoresis tank, and the DNA was allowed to unwind for 20 min in freshly prepared alkaline electrophoresis buffer (300 mM NaOH and 1 mM Na2-EDTA, pH 12.7). Electrophoresis was carried out in the same buffer for 30 min at 25 V (≈ 0.8 V/cm across the gels and ≈ 300 mA) in an ice bath condition. Afterward, slides were neutralized and stained with SYBR Green. The analysis was performed in an Olympus BX50 fluorescence microscope. A total of 150 randomly captured cells per experimental point were used to determine the Tail Moment using Comet Score version 1.5 software. A pulse of 20 min of 10 µg/mL bleomycin just before the cells were harvested was employed as the positive control.
2.3 Statistical analysis
Three independent synthesis of SiO2@FexOy were performed. All three samples were mixed into one batch. All experiments were performed with this mixture.
In estimating mean particle size and shell thickness, we use the Student's t-test with unknown but equal variances (pp337-344 [21]). To corroborate the equality of variances we carried out a quantitative hypothesis test using the F distribution (α = 0.05) (pp355-359 [21]). The result of the layer thickness was expressed as the mean difference between the particles before and after shell formation ± the 95% confidence interval on the difference in means (pp345-347 [21]) (LCL and UCL for lower and upper confidence limit of the interval). To perform the t-test it is necessary that the distributions under study are normal. For this, a qualitative normality test was carried out using Q-Q plot graphs (pp212-251 [21]) and a quantitative normality test using the modified Shapiro-Wilks normality test [22] (α = 0.05). Both tests were performed with INFOSTAT software [23]. Faced with the evidence of the absence of normality of the data, the presence of anomalous data (outliers) within each distribution was confirmed by means of the Q-Q plot. Therefore, the Grubbs test [24] for the detection of anomalous values (α = 0.05) was used. This test detects one outlier at a time. This outlier is removed from the data set and the test is repeated until no outliers are detected. This procedure was performed in OriginPro 2016 software. Once the distributions without outliers were obtained, it was confirmed whether they are normal with the same methods described above. From these distributions, the statistically significant difference between the areas of the particles obtained in step 1 and 2 of Sect. 2.1 (determination of layer thinness) was determined by means of the t-test. This test was carried out in INFOSTAT.
In fluoride removal, statistical analysis of the data was carried out by ANOVA (pp472-479 [21]), followed by the Fisher' Least Significant Difference (LSD) (p497 [21]) (α = 0.05) procedure to discriminate among the means using INFOSTAT software.
In cyto- and genotoxicity studies, statistical analysis of the data was carried out by ANOVA, followed by the Fisher' Least Significant Difference (LSD) procedure to discriminate among the means. Results were expressed as the mean of three independent experiments and plotted as mean ± standard error of the mean. The total number of repeats (n) is specified in the legends of the figures. Analysis of the data was performed with STATGRAPHICS Centurion XVI.I.