Animal care
In accordance with the ARRIVE (Animal Research: Reporting In Vivo Experiments) guidelines for animal research, adult male Wister rats weighing 250–300 g were purchased from the Laboratory Animal Center of Harbin Medical University (Harbin, China). The experimental protocol and animal care were approved by the Ethics Committee of Animal Care and Guidelines in Harbin Medical University for the care and use of laboratory animals.
Experimental protocol
Eighty-five rats were divided randomly into three groups: control group (normoxia, FiO2 21%, PaCO2 35–45 mmHg), hypoxia-ischemia (HI) group (FiO2 15%, PaO2 50–59 mmHg, PaCO2 35–45 mmHg), and hypercapnia group (PaCO2 60–80 mmHg + HI group). The rats in the control group (n = 25) were anesthetized with an intraperitoneal injection of 30 mg/kg pentobarbital sodium (Abbott, North Chicago, IL) and underwent left common carotid artery (CCA) was exposed and ligated. At 1 h of ligation, rats were mechanically ventilated with air via tracheostomy (Harvard ventilator 683, USA) for 3 h. 0.5% ropivacaine was injected for local infiltration when the brain skin was made incision and when performed tracheostomy. In the HI group (n = 30), under the same anesthetic conditions and surgical procedures as rats in the control group, the CCA was ligated, and at 1 h of ligation, followed by ventilation and inhalation of a gas mixture of 15% O2 for 3 h. In the hypercapnia group (n = 30), rats received the same HI protocol and the same fraction of inspired oxygen as described for the HI group with an additional 8% CO2, but hypercapnia was applied at the beginning of ventilation. The body temperature of rats was kept constant at 37 °C using a rectal thermometer and a servo-controlled heating pad. The skull was fixed in a stereotaxic frame (model 51600; Stoelting Co., Wood Dale, IL) for preparation of the cranial window over the left parietal hemisphere for laser Doppler flowmetry assessment. We first made a midline incision of the rat brain skin, then carefully stripped the subcutaneous tissue as well as skull periosteum of the left parietal lobe to make the skull surface smooth and clean. Then we used a 20 ml syringe needle to drill a craniotomy (a diameter of 1.5 mm) to perfectly place a laser doppler flow probe (PeriFlux 5000, Perimed, Sweden) onto the surface of dura and was fixed in place by dental acrylate to record regional cortical blood flow every 30 min. In this process, the probe was inserted to 1–2 mm, avoiding to puncture the dura. When the probe was pulled out, the craniotomy was sealed by dental acrylate. Inhaled and exhaled CO2 and O2 were monitored continuously using a gas monitor (MindaryBeneView T8, Mindray Medical International Limited, P. R. China). Systemic mean arterial blood pressure (mmHg) was measured in the left ligated proximal CCA. A cannula was inserted to the left femoral vein for blood gas determination and peripheral drug administration. After 3 h of ventilation, the catheters were removed, a thin layer of erythromycin ointment on each layer of tissue before the closure of skin as prophylactic antibiotics and the animals were extubated and placed in an oxygenated Plexiglass box until the animals were awake. Rats were given free access to food and water immediately after recovering from anesthesia. Rats that died during systemic hypoxia with or without hypercapnic ventilation were excluded from measuring infarct size and BBB permeability. The neurological severity scores (mNSS) were calculated for the HI and HP groups and used as an important parameter to assess the beneficial effect of hypercapnia.
Assessment of BBB permeability
Five rats from each group were randomly selected to assess the BBB permeability. The quantitative evaluation of BBB disruption during HI and hypercapnia was achieved by measuring fluorescence in the defined brain areas as previously described [21]. Before the end of ventilation with hypoxic and hypercapnic gas for 10 min, rats were injected (0.5 mL) with fluorescent dextran (10 kDa in saline, 2 mg/mL) via a unilateral cannula implanted into the left CCA. The rats were then transcardially perfused with 0.9% saline to remove the intravascular dextran. The brain was rapidly removed, and the left and right hippocampus and left and right cortex were dissected. Brain tissues were homogenized in 50% wt/vol trichloroacetic acid (Sigma, St. Louis, MO, USA). After centrifugation (10,000 g), the supernatant was collected. The fluorescence intensity (ng/mL) in 96-well plates was measured by a microplate fluorescence reader (TECAN Infinite M200, Mӓnnedorf, Switzerland) and analyzed at an excitation wavelength of 495 nm and an emission wavelength of 520 nm. The differences in the fluorescence intensity between the control and HI groups were calculated as tracer leakage, and the data are presented as percent changes from the control (normoxia) tissues.
Infarct volume measurement
Infarction volumes were measured by analysis of the 2,3,5-triphenyltetrazolium chloride (TTC) staining in brain sections taken 24 h after HI using standard protocols [22]. Briefly, five rats from the HI and HP groups were randomly selected for analysis. Brain tissues were immediately collected and cut into 2 mm coronary slices using a stainless steel mold (68709, RWD Life Science Co., Ltd., China). These slices were placed flat in 2% TTC (Sigma, St. Louis, MO, USA) for 30 min. The sections were immersed in 10% formalin at 37 °C for 12 h. Non-infarct tissues were stained red, and the infarct regions were white after TTC staining. The slices were photographed, and the area of ischemic injury as well as the hemisphere area was measured by Image-Pro Plus software (Version 6.0, Media Cybernetics, Bethesda, MD, USA). The infarct volume was calculated as follows: (a1 + a2 + a3…+a6) × t, where a1 to a6 is the infarct area of each section, and t is the serial section thickness. Edema area was defined as the ipsilateral hemisphere area minus the contralateral hemisphere area. For elimination of the effects of edema, the percentage of ischemic area was assessed according to the following formula: percentage of infarction=[measured infarct area-edema area]/[(ipsilateral hemisphere area + contralateral hemisphere area)-edema area].
Anti-Endothelial Cell antibody (RECA-1) expression in the brain
After hypoxia for 3 h with or without hypercapnic treatment, four rats from each group were randomly selected. Rats were transcardially perfused with ice-cold phosphate buffered saline (PBS) (pH 7.2) under anesthesia. The brain was removed, fixed with 4% paraformaldehyde and sliced into coronal sections (4 µm thick). The brain sections were incubated in the primary antibody anti-RECA-1 (mouse monoclonal antibodies, 1:20 dilution, ab9774; Abcam, Cambridge, MA, USA) overnight at 4 °C. After washes with PBS, the sections were then incubated with a goat anti-mouse fluorescein-conjugated secondary antibody (1:1000 dilution, 1031-01; Southern Biotech, Birmingham, USA) for 20 min at 37 °C. The sections were incubated with DAPI (1:1000) in 1% bovine serum albumin for 10 min, mounted on albumin-coated slides, and sealed. Images were captured under a laser scanning confocal microscope (Fluoview 1000; Olympus, Tokyo, Japan).
Evaluation of neurological function
The neurological function test was performed in a double-blinded manner by two unbiased investigators. The neurological function was evaluated at 2 h before and 3 ,7,14d after hypoxia with or without hypercapnic exposure using the mNSS score as described in a previous modified assay. [23] The mNSS was a composite of motor, sensory, reflex, and balance tests. The neurological function evaluation was graded on a scale of 0–18 (0 = normal score; 18 = maximal deficit score). In the injury severity scores, 1 score point was awarded for the inability to perform the test or for the lack of a tested reflex; thus, the higher the score is, the more severe is the injury.
Primary cell culture
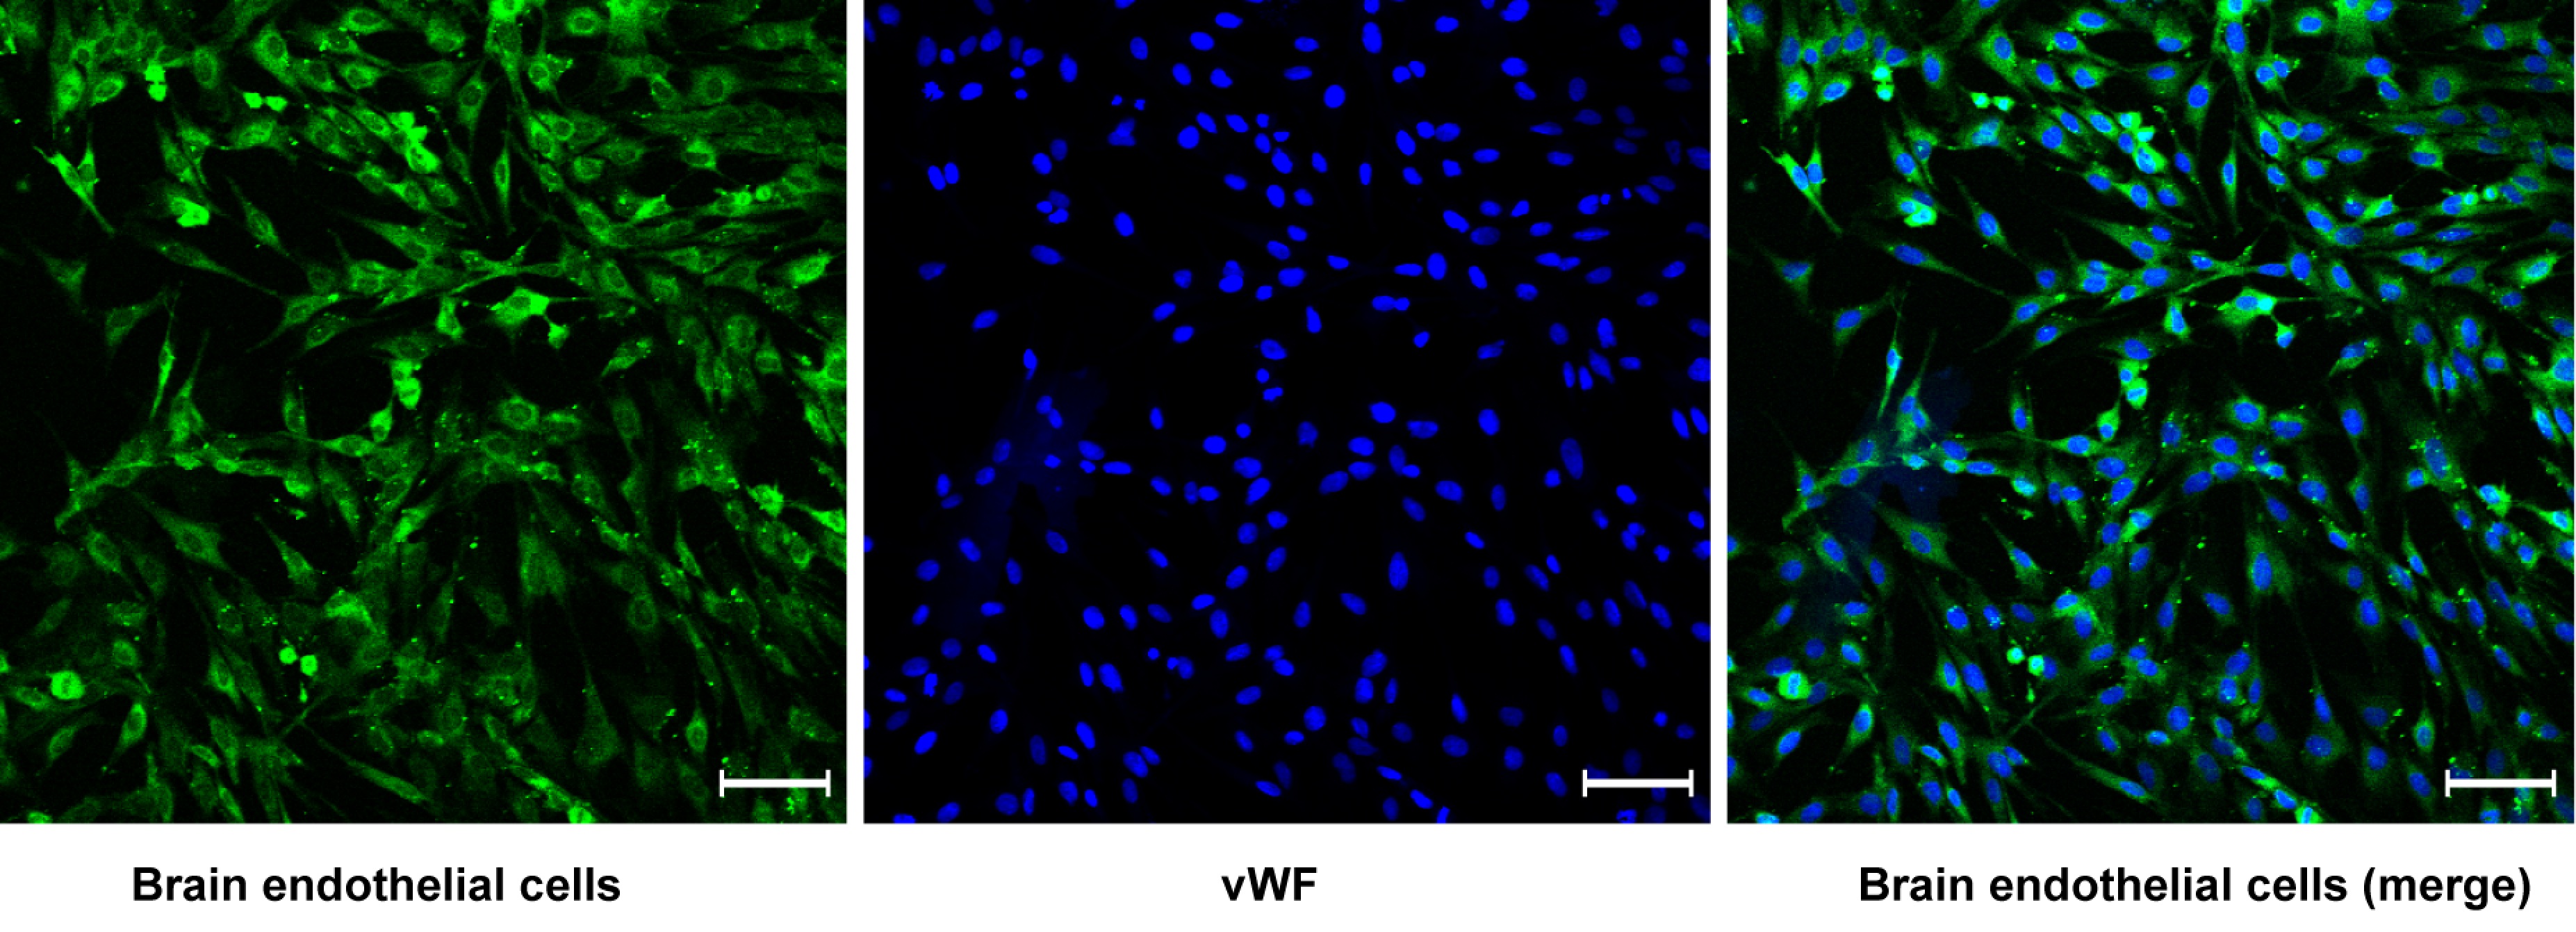
Brain microvascular endothelial cells (BMECs) were extracted from 3-week-old rats as a described in a previous study. [24] Briefly, BMECs were cultured in DMEM/F12 with puromycin at 37 °C with a humidified atmosphere of 5% CO2/95% air for 2 d. On the 3rd day, the puromycin was removed from the medium. When the cells reached 80% confluence (5th − 6th day), the endothelial cells were passed using a trypsin/EDTA mixture (Sigma). The cells were transferred to 12-well Transwell inserts coated with collagen type IV and fibronectin to form the BBB model in vitro. The endothelial monolayer showed positive expression of the endothelial marker von Willebrand factor (supplementary Fig. 1) after immunostaining. BMECs were incubated at 37 °C for 6 h. The cells were divided into three groups (each group, n = 3): the normoxia (21% O2), hypoxia (1% O2 + 5% CO2 + 94% N2) and hypercapnia groups (1% O2 + 15% CO2 + 84% N2).
Assessment of gas analysis and cell viability
Cell culture media (before hypoxia, after hypoxia with or without hypercapnia) were removed, and gas values (pH, PCO2, PO2) were measured using a blood gas analyzer (Bayer Rapid Lab 855, Leverkusen, Germany). The viability of the endothelial cells in response to oxidative stress was assessed by measuring the lactate dehydrogenase (LDH) activity in the cell culture medium after each experiment. For this purpose a Lactate Dehydrogenase Activity Assay Kit (Sigma,MAK066) has been used. For further analysis only cultures with no increased LDH activity has been used.
Measurement of transendothelial electrical resistance (TEER)
Since resistance is inversely proportional to permeability, TEER (in Ω × cm2) was measured using an EVOM2 membrane potentiometer (World Precision Instruments, Inc., U.S.). After the samples were exposed to hypoxia with or without hypercapnia for 2, 4 or 6 h, the TEER values were measured in BMECs. The resistance of blank inserts was subtracted as background resistance from the total resistance of each treatment. [25]
Western blotting
The treated or control cells were lysed for 30 min on ice. The total protein was measured by a BCA kit (Beijing Kangwei Century, China). The electrophoresis was performed and the membrane was hybridized as described in previous studies. [26, 27] The primary antibodies were used as follows: rabbit polyclonal anti-ZO-1, anti-occludin, and mouse anti-β-actin antibodies (Zhongshan Golden Bridge, China). Anti-rabbit or anti-mouse horseradish peroxidase-conjugated secondary antibodies were purchased from Zhongshan Golden Bridge. Band intensity was normalized to protein loading band density and expressed as a percentage of normoxic values.
Statistical analysis
Statistical analysis was performed using the Statistical Package of Social Sciences (SPSS) 13.0 (Beijing Stats Data Mining Co., Ltd.). The data are expressed as the mean ± standard deviation (S.D.). One-way analysis of variance (ANOVA) was used to assess the differences followed by a post hoc test to evaluate the differences in variables among groups. The changes in variables with time were analyzed using repeated measures ANOVA followed by a post hoc test. All P values are 2-tailed, and P < 0.05 was considered significant.