2.1 | Participants And Samples
Participants were divided into the following groups; Group 1: 123 cases with type 2 diabetes mellitus, T2DM diagnosis was proved according to the American Diabetes Association practice guidelines. Their ages ranged from 35 to 83 years, with a mean of 54.69 ± 8.855 years, the median of ages was 55 years and Group 2: 106 healthy normal individuals undergoing a routine checkup at Ain Shams University hospitals. Their ages ranged from 36 to 69 years, with a mean age 53.29 ± 7.04 years, the median was 53 years. The age and sex are matched between the 2 groups.
Inclusion criteria of the study; Proved diagnosis of T2DM according to ADA practice guidelines, age of > 18 years at the time of consent giving and the ability to provide a written, informed consent, Exclusion criteria of the study; History of malignant disease, patients on steroids for the last 6 months, end stage organ disease as chronic liver disease ,pregnant or lactating women.
Whole Blood samples were collected at Ain Shams University hospitals during the period March 2018 to May 2019. Sera were obtained by centrifugation while Peripheral Blood Mononuclear Cells (PBMCs) were isolated using lymphoprep (Axis-Shield PoC AS, Oslo, Norway). All participants signed an informed consent and the study was approved by the ethical committee of the Faculty of Medicine at ASU no. FWA 000017585.
Sera were obtained by centrifugation while Peripheral Blood Mononuclear Cells (PBMCs) were isolated using lymphoprep (Axis-Shield PoC AS, Oslo, Norway). All participants signed an informed consent and the study was approved by the ethical committee of the Faculty of Medicine at ASU no. FWA 000017585.
2.2 | Measurement Of HOMA-IR:
Fasting insulin level was measured in sera of diabetic patients and healthy controls using enzyme-linked immunosorbent assay ELISA (DRG® Insulin ELISA (EIA-2935), DRG International, Inc. USA). Homeostatic Model Assessment of Insulin Resistance (HOMA-IR) was calculated according to the equation: Fasting insulin (µU/L) x fasting glucose (nmol/L)/22.5 11
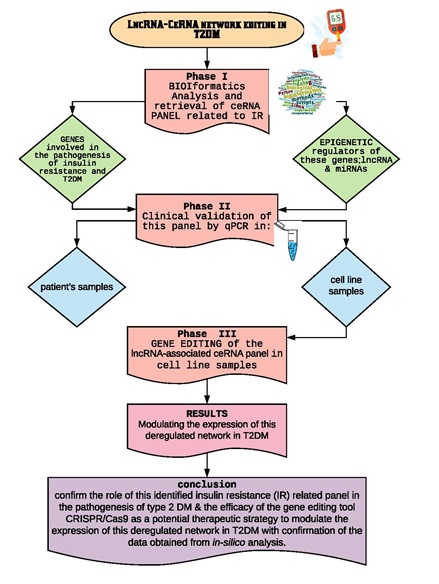
2.3 | Bioinformatics-based selection of ceRNA panel related to insulin resistance:
The identified panel was obtained through the following steps:
Retrieval of a set of candidate genes (mRNAs) related to insulin resistance signaling pathways from two public microarray databases available at (https://www.ebi.ac.uk/gxa/home) and (https://www.proteinatlas.org). Verification of the identified candidate genes expression in skeletal muscle and adipose tissues through gene cards (https://www.genecards.org/), so as to decrease the false discovery rate. Construction of mRNA/ miRNA/ lncRNA genetic axis linked to the identified candidate genes in IR in T2DM including LncRNA-RP11‐773H22.4, miR‐3163 and miR-1 microRNAs using a lnCeDB database, available at (http://gyanxet‐beta.com/lncedb/index.php). Alignment between LncRNA-RP11-773H22.4 and retrieved miRNAs: miR-3163 and miR-1, alignment between mTOR mRNA and retrieved miRNAs, as well as, the alignment between LncRNA-RP11-773H22.4 and the 2 synthesized gRNAs, to identify sequences of lncRNA-miRNAs interactions to be targeted by CRISPR/Cas9 gene editing tool through alignment database tool available at (https://www.ebi.ac.uk/gxa/home). Detailed bioinformatics are shown in supplementary figures (1a-o).
2.4 | Validation of the identified ceRNA panel related to insulin resistance in human clinical samples:
2.4.1 Extraction of total RNA, including lncRNA, miRNAs, and mRNAs from human PBMCs samples.
We used miRNeasy® RNA isolation kit (Cat no. 74104; Qiagen, USA) to extract total RNA from the PBMCs following the manufacturer’s instructions. We assessed the RNA concentration and integrity using DeNovix DS-11 micro-volume spectrophotometer (Wilmington, USA). Then, it was reverse transcribed into cDNA using RT2 first strand kit (Cat no. 330401; Qiagen, USA) for the target mRNAs and miScript II RT Kit (Cat no. 218161; Qiagen, USA) for the non-coding RNAs as per the manufacturer's protocol using Thermo Hybaid PCR express (Thermo Scientific, USA).
2.4.2 Quantitative real time-PCR of the identified ceRNA panel related to insulin resistance:
The levels of the identified mRNAs (RET, IGF1-R, m-TOR, GLUT-4 and AKT2) in PBMCs were measured using custom RT2 Profiler™ PCR Array (Cat no. 330171; Qiagen, Helman Germany, Ensembl: ENSG00000165731, ENSG00000140443, ENSG00000198793, ENSG00000181856 and ENSG00000105221, respectively) and RT² SYBR Green ROX qPCR Mastermix (Cat no: 330520 ;Qiagen, Helman Germany), using Applied Biosystems Tm 7500 Real-Time PCR system (Foster city, California, United States). Relative expression levels for LncRNA-RP11-773H22.4 were analyzed by RT² SYBR Green ROX qPCR Master mix (Cat no: 330520; Qiagen, Helman Germany) and lncRNA qPCR Primer Assay for Human RP11-773H22.4 (ENST00000588211) supplied by Qiagen. GAPDH (Ensembl: ENSG00000111640) was used as a reference gene. miR-3163 and miR-1 miRNAs relative expression levels in PBMCs were investigated by a miScript SYBR Green PCR Kit (Cat no. 218073; Qiagen, Helman Germany), a miScript universal primer and a miRNA‐specific forward primer (Hs_miR-3163_1 miScript Primer Assay) (Accession: MIMAT0015037) (Cat no. MS00020769; Qiagen, Helman Germany) for miR‐3163 and (Hs_mir-1-1_PR_1 miScript Precursor Assay) (Accession: MI0000651) (Cat no. MP00000175; Qiagen, Helman Germany) for miR-1, and RNU‐6 was used as an internal control. All PCR primers were obtained from Qiagen. The PCR program cycling conditions were adjusted according to the type of the measured RNA according to the manufacturer's protocol. The 2−ΔΔCt technique was used to measure the expression of the IR specific RNA‐based candidate genes panel using Applied Biosystems 7500 software v2.3. Reference genes were used as an internal control to normalize the raw data of the samples and compare these results to a reference sample. In this study, appropriate standardization strategies were carried out to recognize any experimental error introduced at any stage during extraction and processing of the RNA according to MIQE guidelines 12.
2.5 | Validation of the identified ceRNA panel related to insulin resistance and CRISPR/CAS9 editing of LncRNA-RP11‐773H22.4 in lymphocyte cell line:
2.5.1 Culture Of Human Lymphocytes
Human cell culture was conducted as previously described 13. The PBMCs were transferred in 20 mL RPMI 1640 media to a T-75 culture flask containing: 10% fetal bovine serum, 1% penicillin/streptomycin, 1µg/mL phytohemagglutinin (PHA) and incubated at 37°C with 5% CO2 for 24 hours. Next day, all the media was removed from the flask, and the cell pellet was added to a 50 mL conical tube and centrifuged at 500 Xg for 5 minutes. The pellet which contained mainly lymphocytes was resuspended. The cells were transferred to a new T-75 culture flask in 25 mL RPMI 1640 media containing: 10% fetal bovine serum, 1% penicillin/streptomycin, 1µg/mL PHA and incubated at 37°C for 3 days. After 24 hours of growth, 20 mL of fresh media was added and transferred to a larger T-175 culture flask. After 3 days, media and suspended cells were removed from the culture flask and transferred to a 50 mL conical tube then centrifuged at 500 Xg for 5 minutes. The pellet was resuspended and transferred to a new T-75 culture flask containing 25 mL RPMI 1640 with 10% fetal bovine serum, 1% penicillin/streptomycin. Lymphocytes were grown for 4 days.
2.5.2 Synthesis Of Grnas
DNA oligonucleotides used for gRNA synthesis were designed with the GeneArt™ CRISPR gRNA Design Tool (available at: www.thermofisher.com). The two gRNAs were then synthesized using the GeneArt™ Precision gRNA Synthesis Kit according to the manufacture’s protocol and each was combined with GeneArt™ Platinum™ Cas9 Nuclease to form the Cas9 protein/gRNA ribonucleoprotein complexes (Cas9 RNPs), Fig. 2s and table 1s.
2.5.3 Lymphocyte transfection in a 12-well plate using Lipofectamine CRISPRMAX Reagent:
50 µl Opti-MEM medium was mixed with 1.25 µg GeneArt Platinum Cas9 nuclease and 0.25 µg gRNA, then vortexed with 2.5 µl Cas9 Plus and incubated at 25 for 5 min to form RNPs. 3 µl of Lipofectamine CRISPRMAX with 50 ul Opti-MEM were mixed and incubated at 25 for 5 min before being added to RNPs solution. The mixture was incubated at 25 for 15 min, then added to cells that were plated onto 12-well plates at a density of 8.5 × 10⁵ cells/well in 1 ml growth medium. 72 h post-transfection, lymphocytes were harvested for cell count and viability using trypan blue exclusion method and gene expression was analyzed before and after editing 14. The genomic cleavage efficiency was measured by GeneArt® Genomic Cleavage Detection kit.
2.5.4 Immunofluorescence microscopy to evaluate the activity of GLUT-4 and m-TOR proteins as major effector target proteins in the molecular pathogenesis of IR in T2DM:
The harvested cells were examined by immunofluorescence staining with specific polyclonal antibodies against solute carrier family 2 member4 (SLC2A-4/ GLUT-4) (Cat.no.FNab03503, FineTest, Hubei, China). and mammalian target of rapamycin (m-TOR) protein (Cat.no. FNab05417, FineTest, Hubei, China) (green). An alexfluor 488 anti-rabbit IgG secondary antibody (Cat.no.A-11034, Invitrogen; ThermoFisher Scientific, Hilden; Germany) was used for detection. Fluorescence was examined by immunofluorescence microscope (Labmed; USA), using Optika ISview image acquisition and processing software.
2.6 | Statistics
Statistical Package for the Social Sciences (SPSS, Chicago, IL) version 20 was used to perform all statistical analyses. Kruskal-Wallis test, Mann-Whitney rank sum U test, independent samples t-test, ANOVA and chi square test were used for comparison, as appropriate. (ROC) curves were used to explore the predictive value of investigated panel. The relationships between the investigated parameters were assessed using Spearman rank correlations. A 2-tailed p value of ≤ 0.05 was considered a statistically significant.
2.7 | Data And Resource Availability
The datasets and RESOURCE generated during and/or analyzed during the current study are available from the corresponding author upon reasonable request.