SARS-CoV-2 RNA is highly structured in host cells.
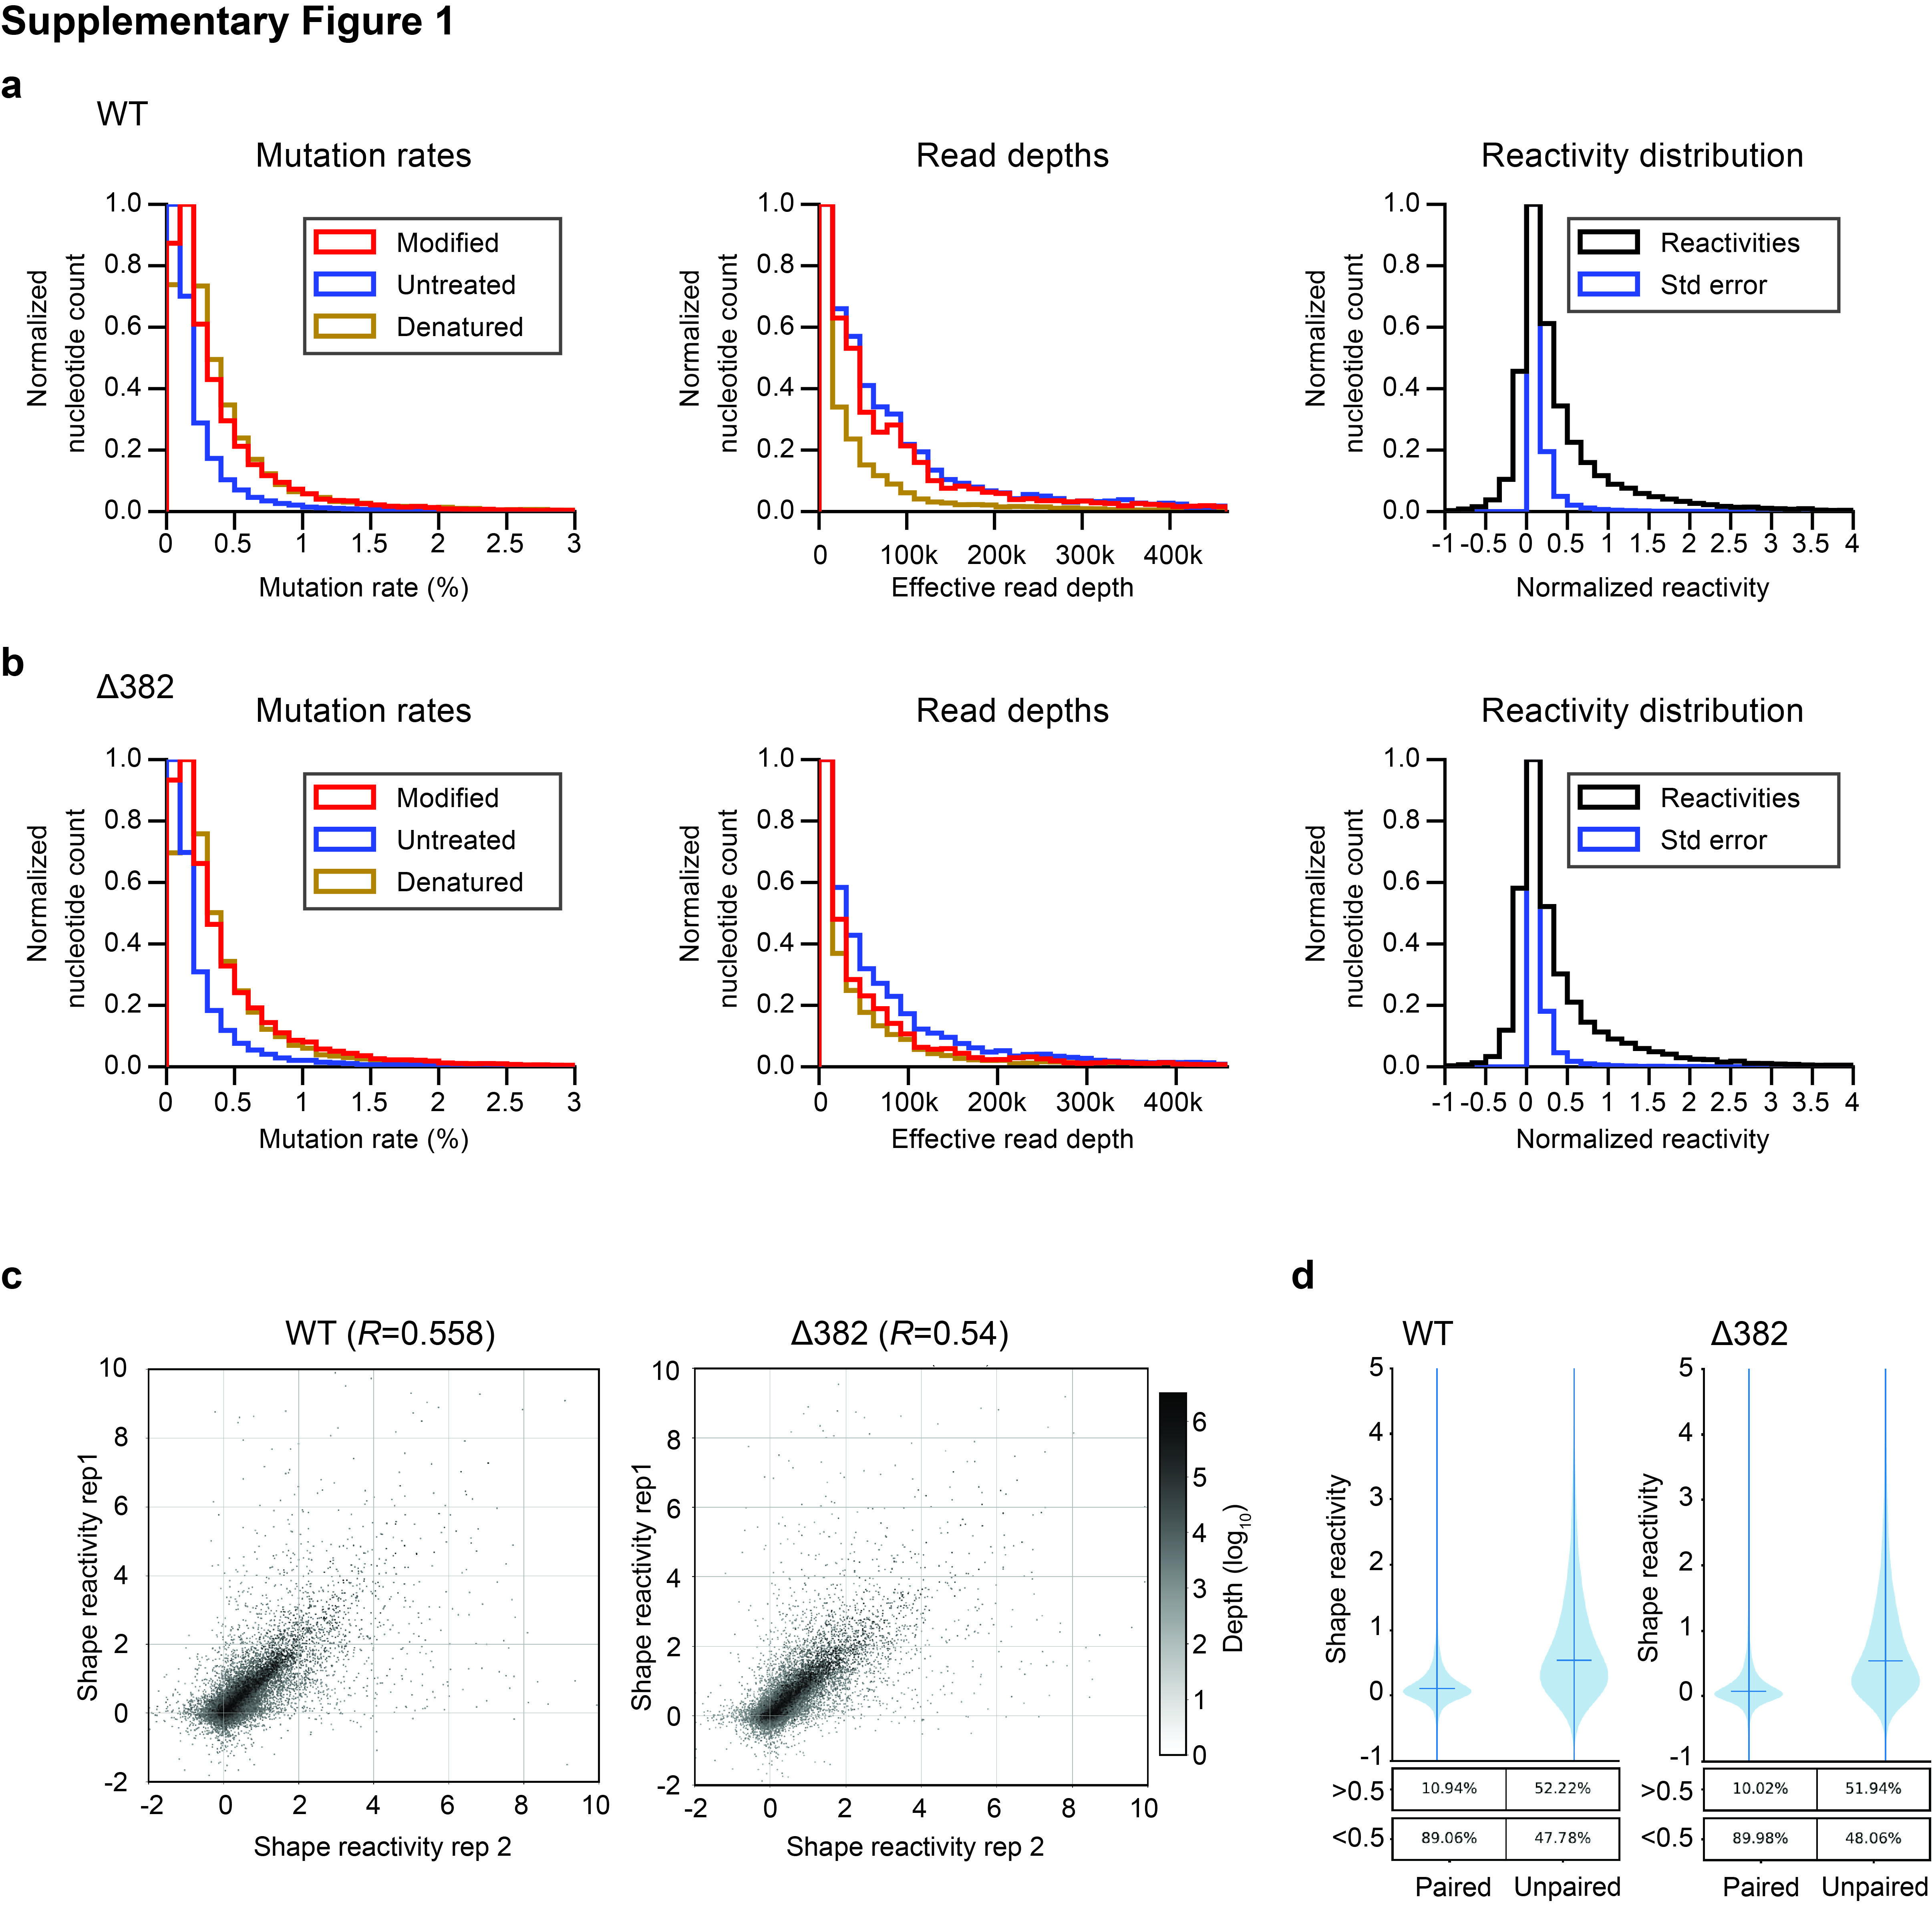
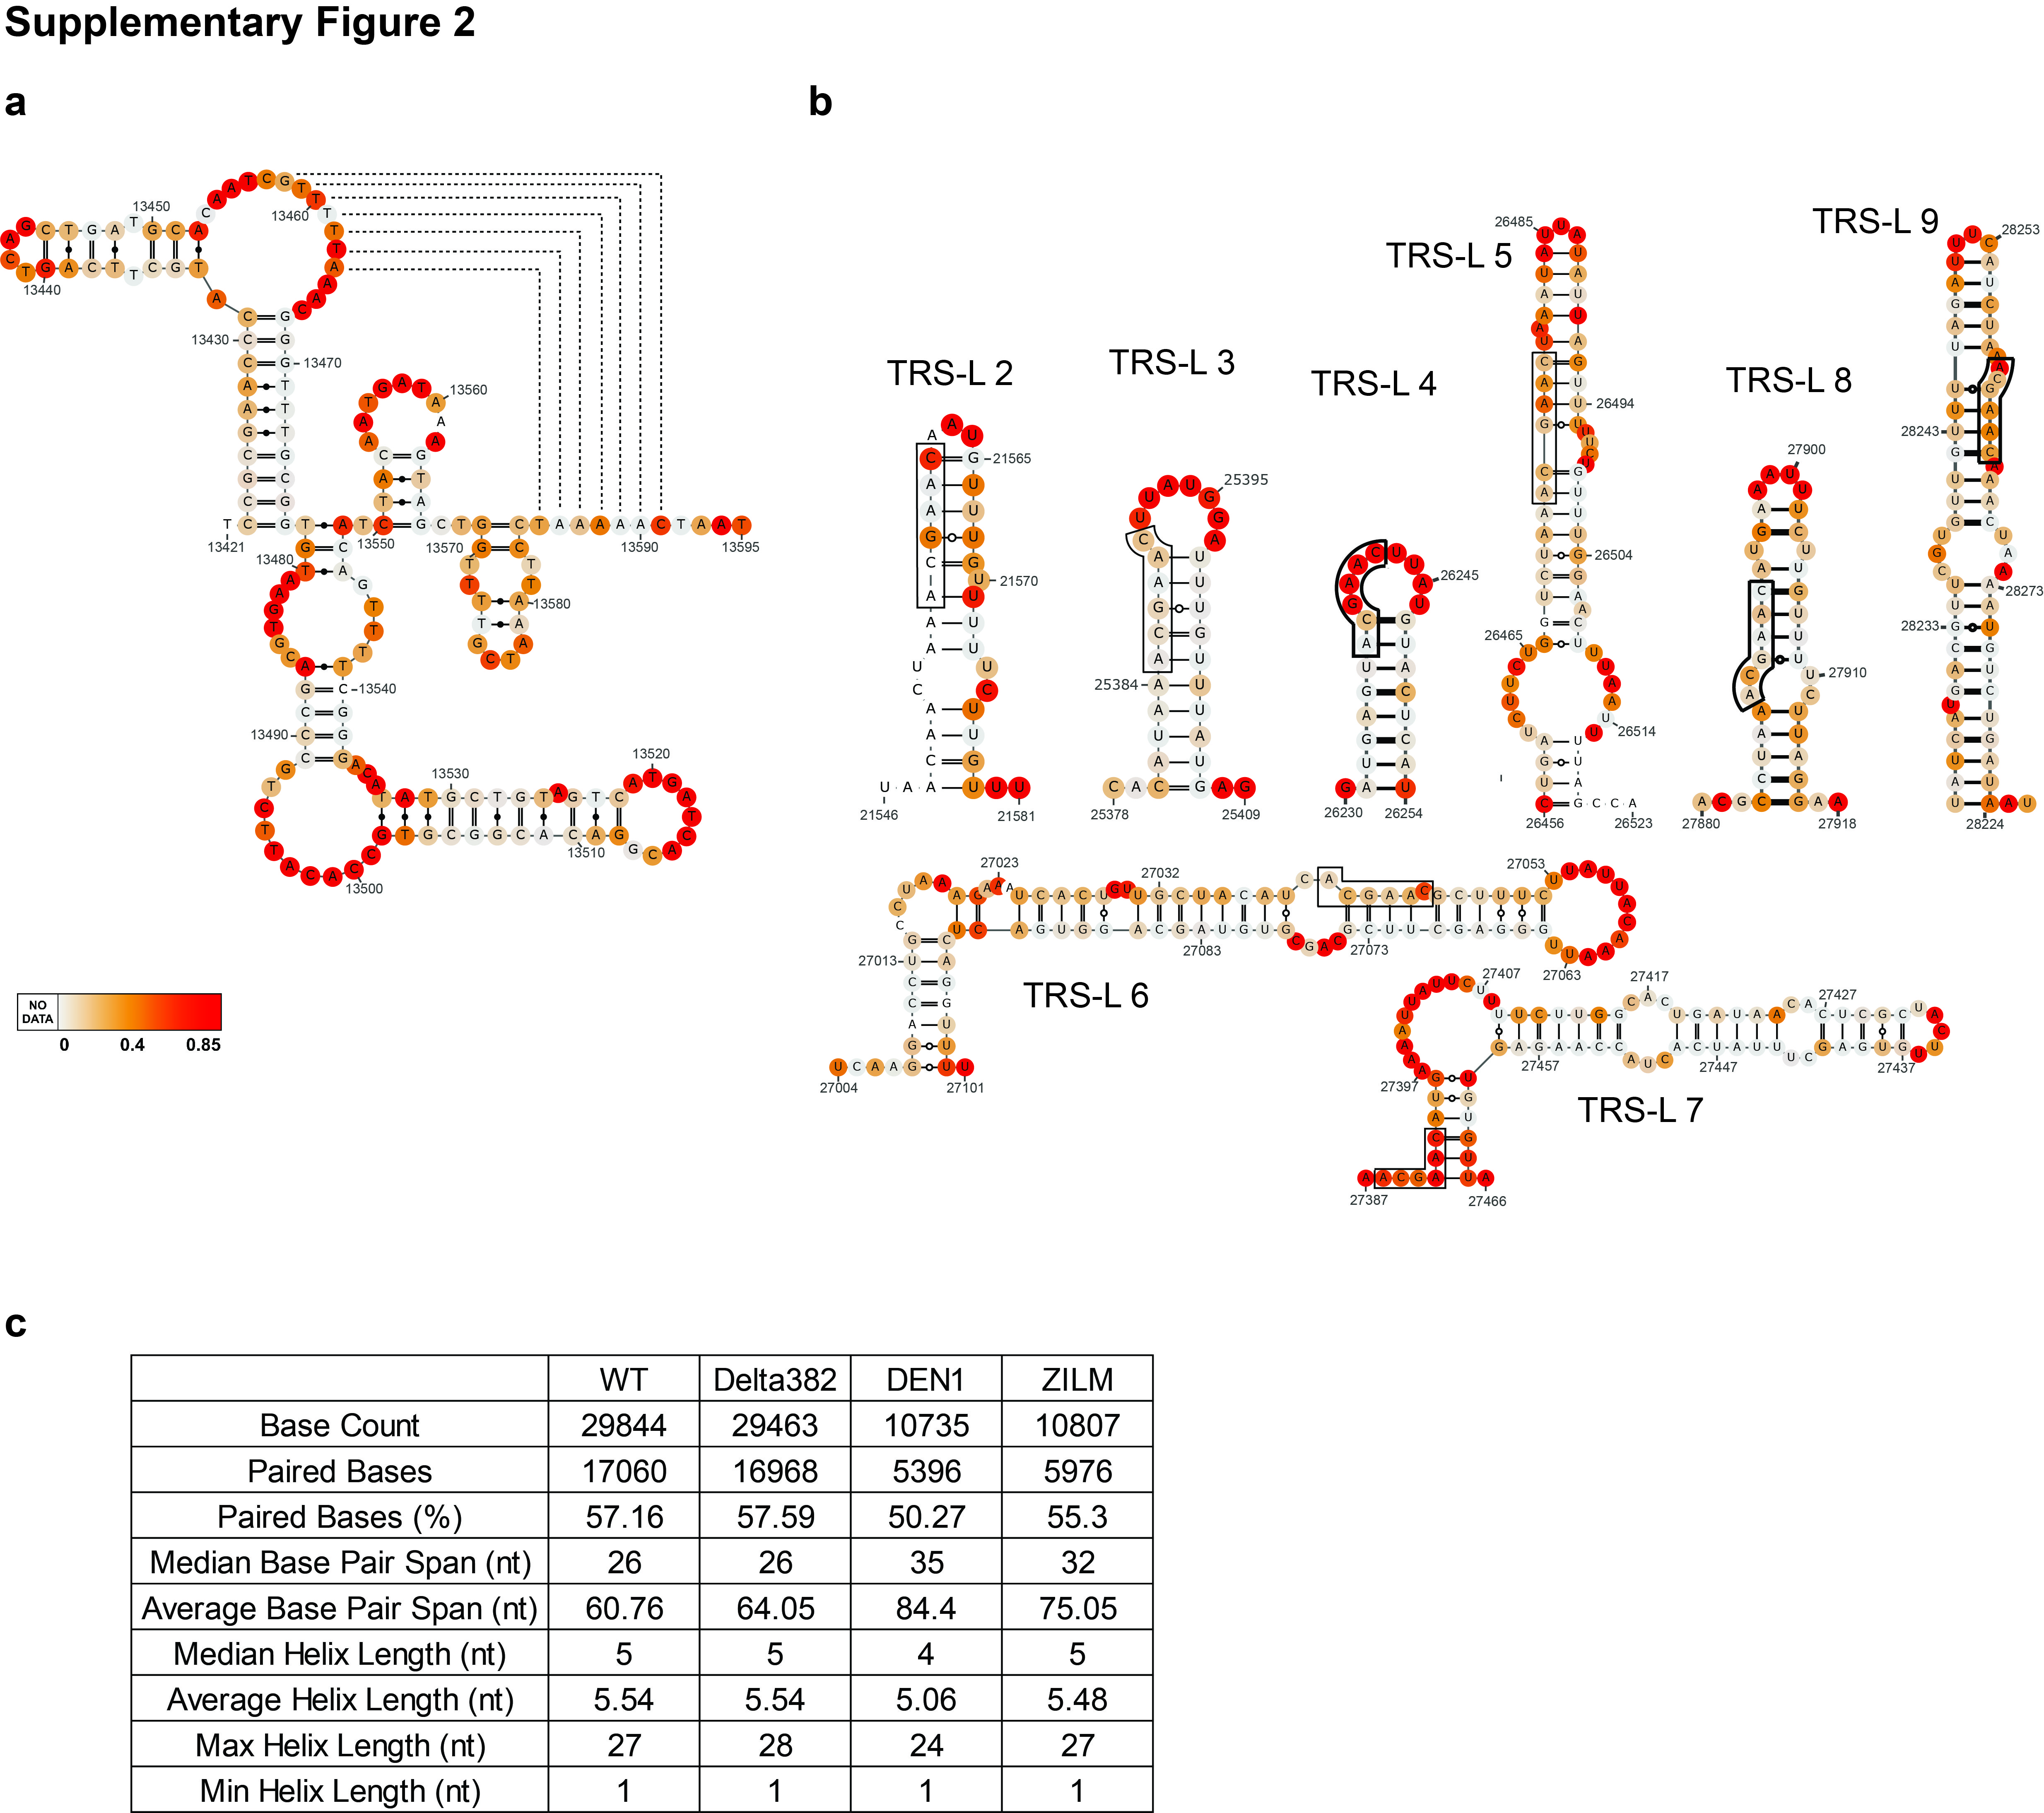
To study the secondary structures of SARS-CoV-2 RNAs inside cells, we infected Vero cells with WT and Δ382 SARS-CoV-2 and performed structure probing using the compound NAI inside cells (Methods)10,25. We then performed mutational mapping (MaP) to determine the location of high reactivity bases, indicating single-stranded bases, along the virus genome. We confirmed that mutational rates along NAI-treated, denatured and DMSO-treated samples are as expected (Supp. Figure 1a,b, Supp. Table 1). Biological replicates of SARS-CoV-2 SHAPE-MaP show that the reactivities across replicates are highly reproducible (Supp. Figure 1c), cover around 80% of the entire SARS-CoV-2 genome (Figure 1b), and map to known structures in the 5’ and 3’UTR as expected (Supp. Figure 1d, Supp. Table 2). SHAPE-MaP reactivities were used to constrain RNA secondary structure predictions to obtain accurate structure models of the entire SARS-CoV-2 genome (Methods, Figure 1c,d, Figure 2)26. Our structure models are consistent with previously identified structural elements in the 5’ and 3’UTRs (Figure 1c)27–29, existing structure models for the frameshifting element (Figure 1d, Supp. Figure 2a) and that for TRS-L elements (Supp. Figure 2b)27, confirming that models based on our data are accurate. Similar to other RNA viruses like DENV and ZIKV, 57% of the bases in the SARS-CoV-2 genome are predicted to be paired, with a median helix length of 5 bases in both WT and Δ382 genomes (Supp. Figure 2c)10. These short helices enable RNA viruses to escape from host immune responses.
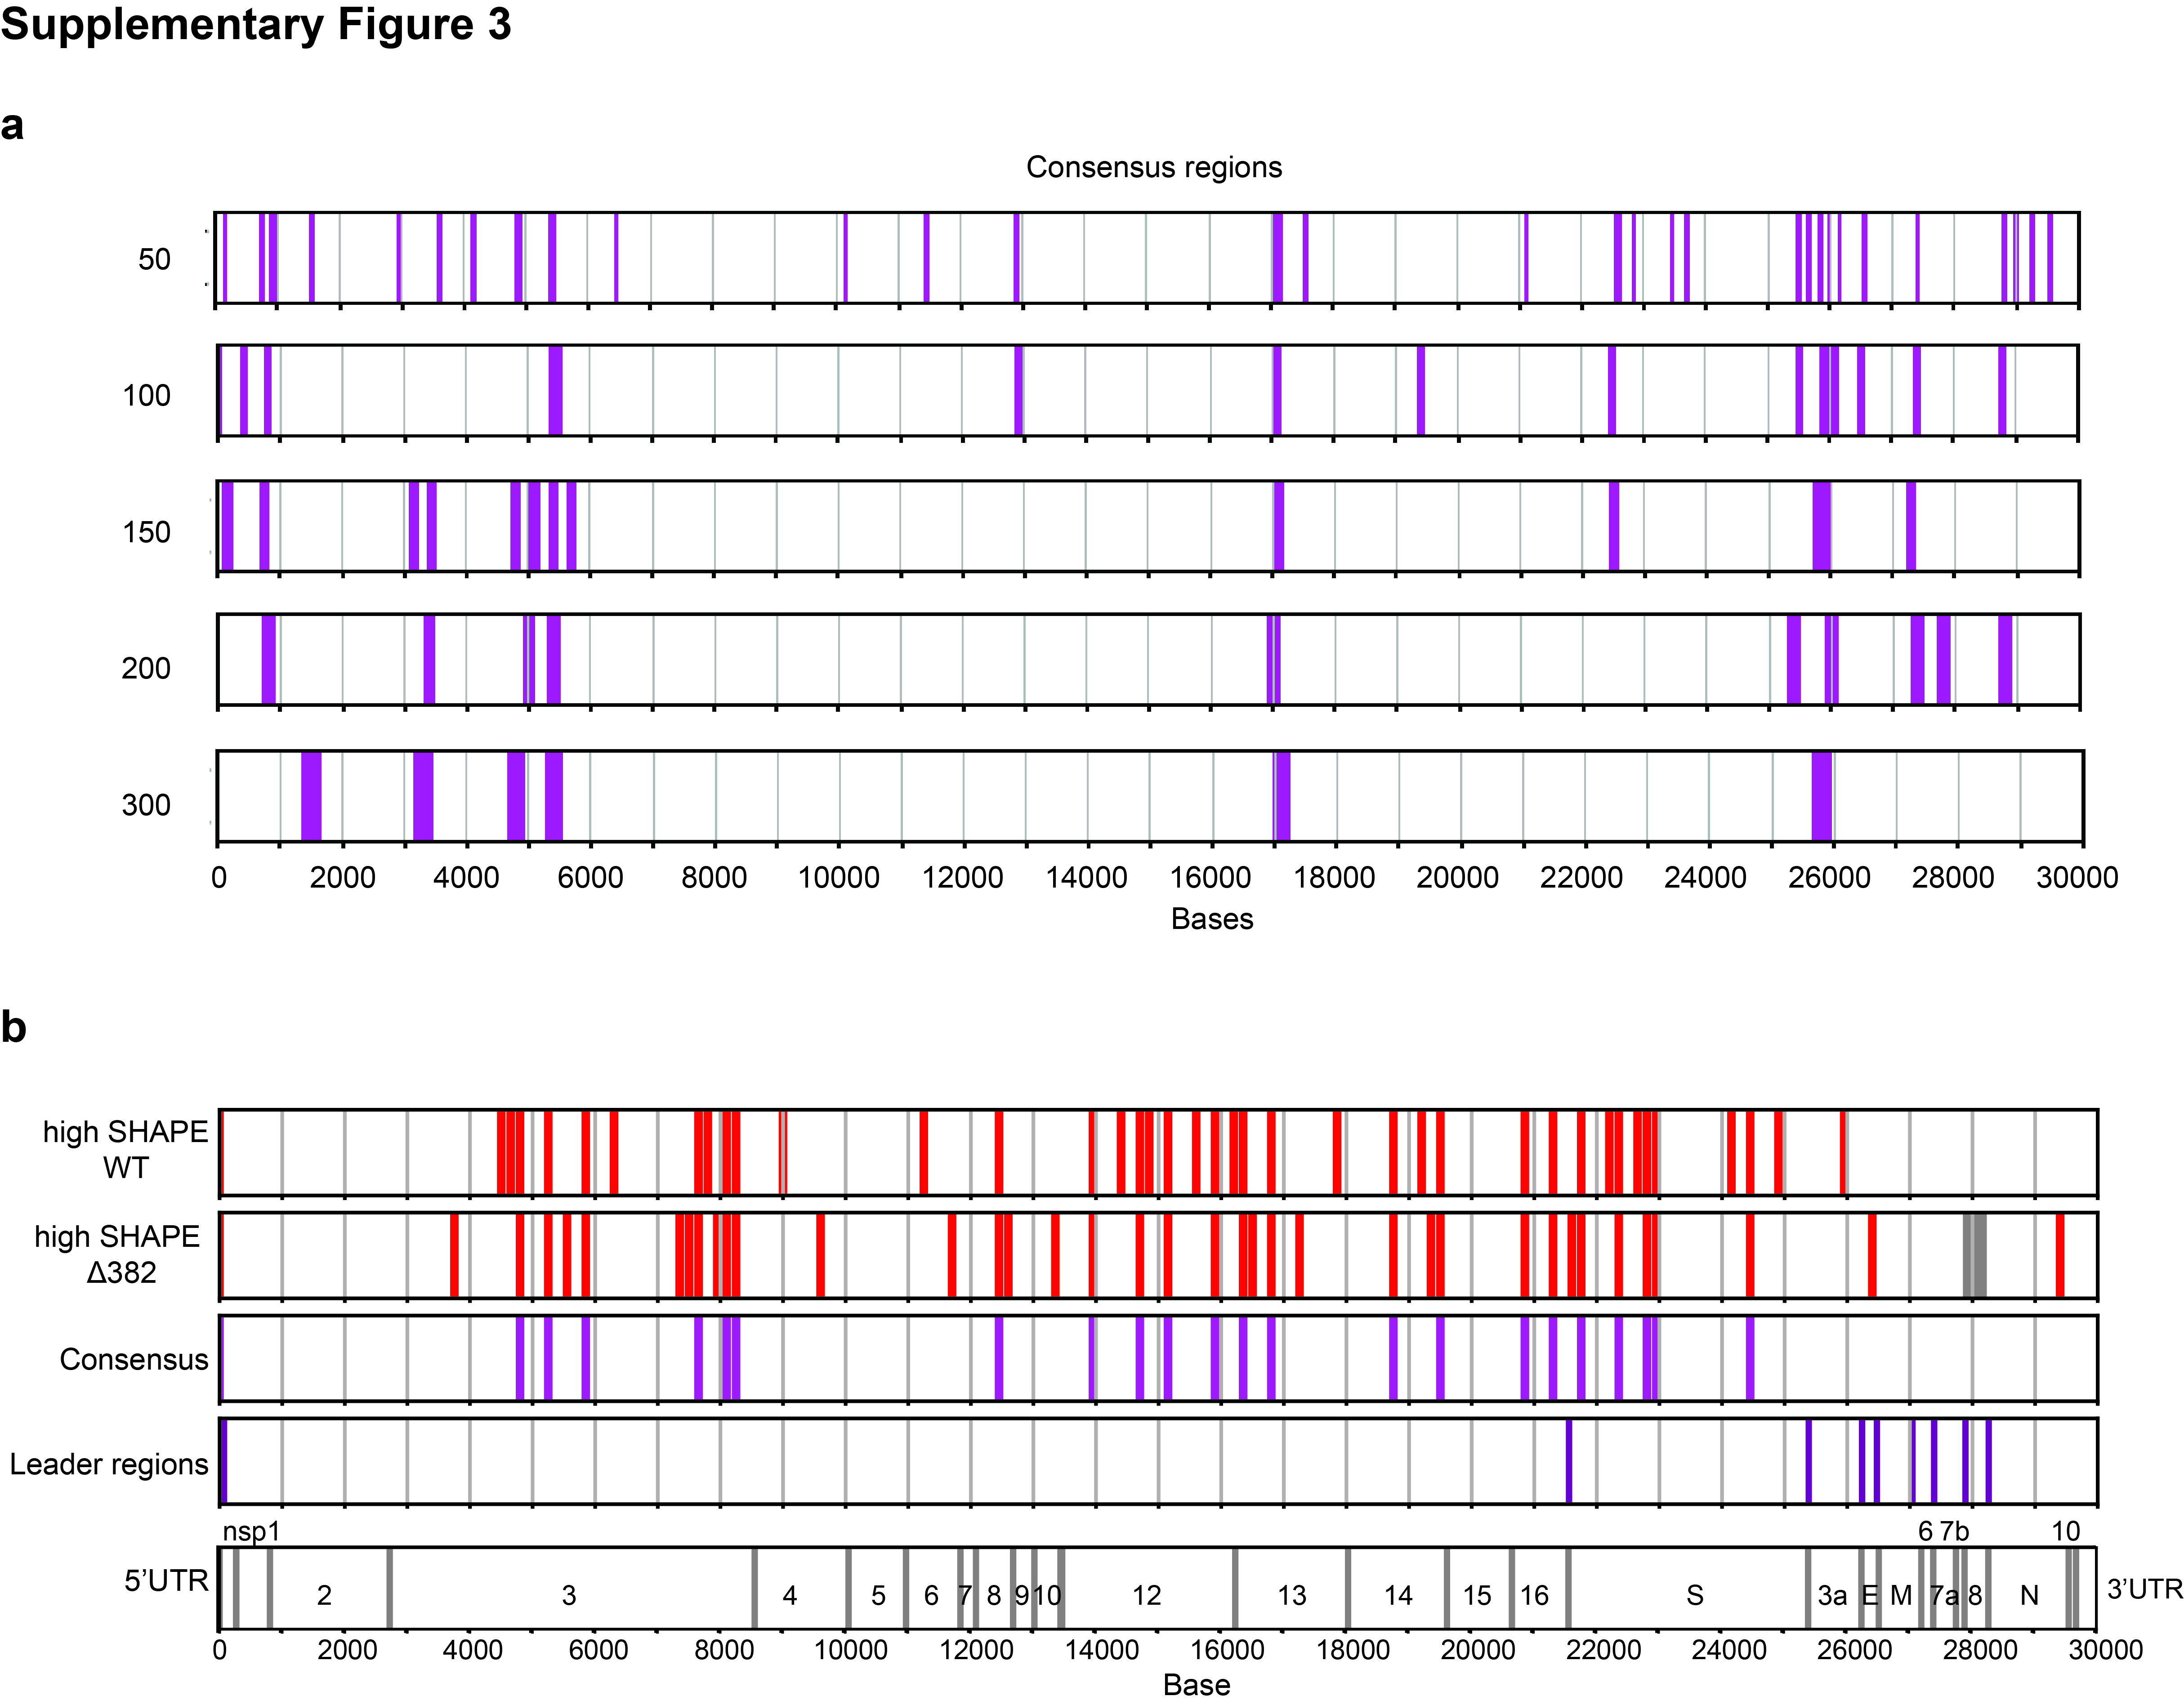
To identify potentially functional structural RNA elements in the SARS-CoV-2 genome, we used a consensus model between WT and Δ382, incorporating local SHAPE reactivity, local Shannon entropy of the structure models and local ‘Scan-Fold’ energies in 150 nt windows (Figure 2a)30,31. We evaluated window sizes of 50 nt to 300 nt which yielded consistent results (Supp. Figure 3a). We considered a position a consensus candidate if it had at least four out of six possible characteristics of ‘low average SHAPE’ as an indication of structuredness at a location, ‘low Shannon entropy’ as an indication of structural consistency and limited alternative folding, and ‘low Scan-Fold energy’ as a proxy for high stability of putative structural elements in both WT and Δ382 (Figure 2a). Local structure models of consensus regions were largely consistent with structures obtained in the global context and identified novel highly structured elements within the genome (Figure 2b). As single-stranded regions present in the SARS-CoV-2 genome could be used for siRNA targeting, we also identified locations with high reactivities (top 20%) in both the WT and Δ382 genomes (Supp. Figure 3b). We identified a total of 21 regions that could be used for siRNA targeting, to facilitate potential treatments for COVID-19 disease.
SARS-CoV-2 genome contains hundreds of regions involved in intramolecular long-range interactions
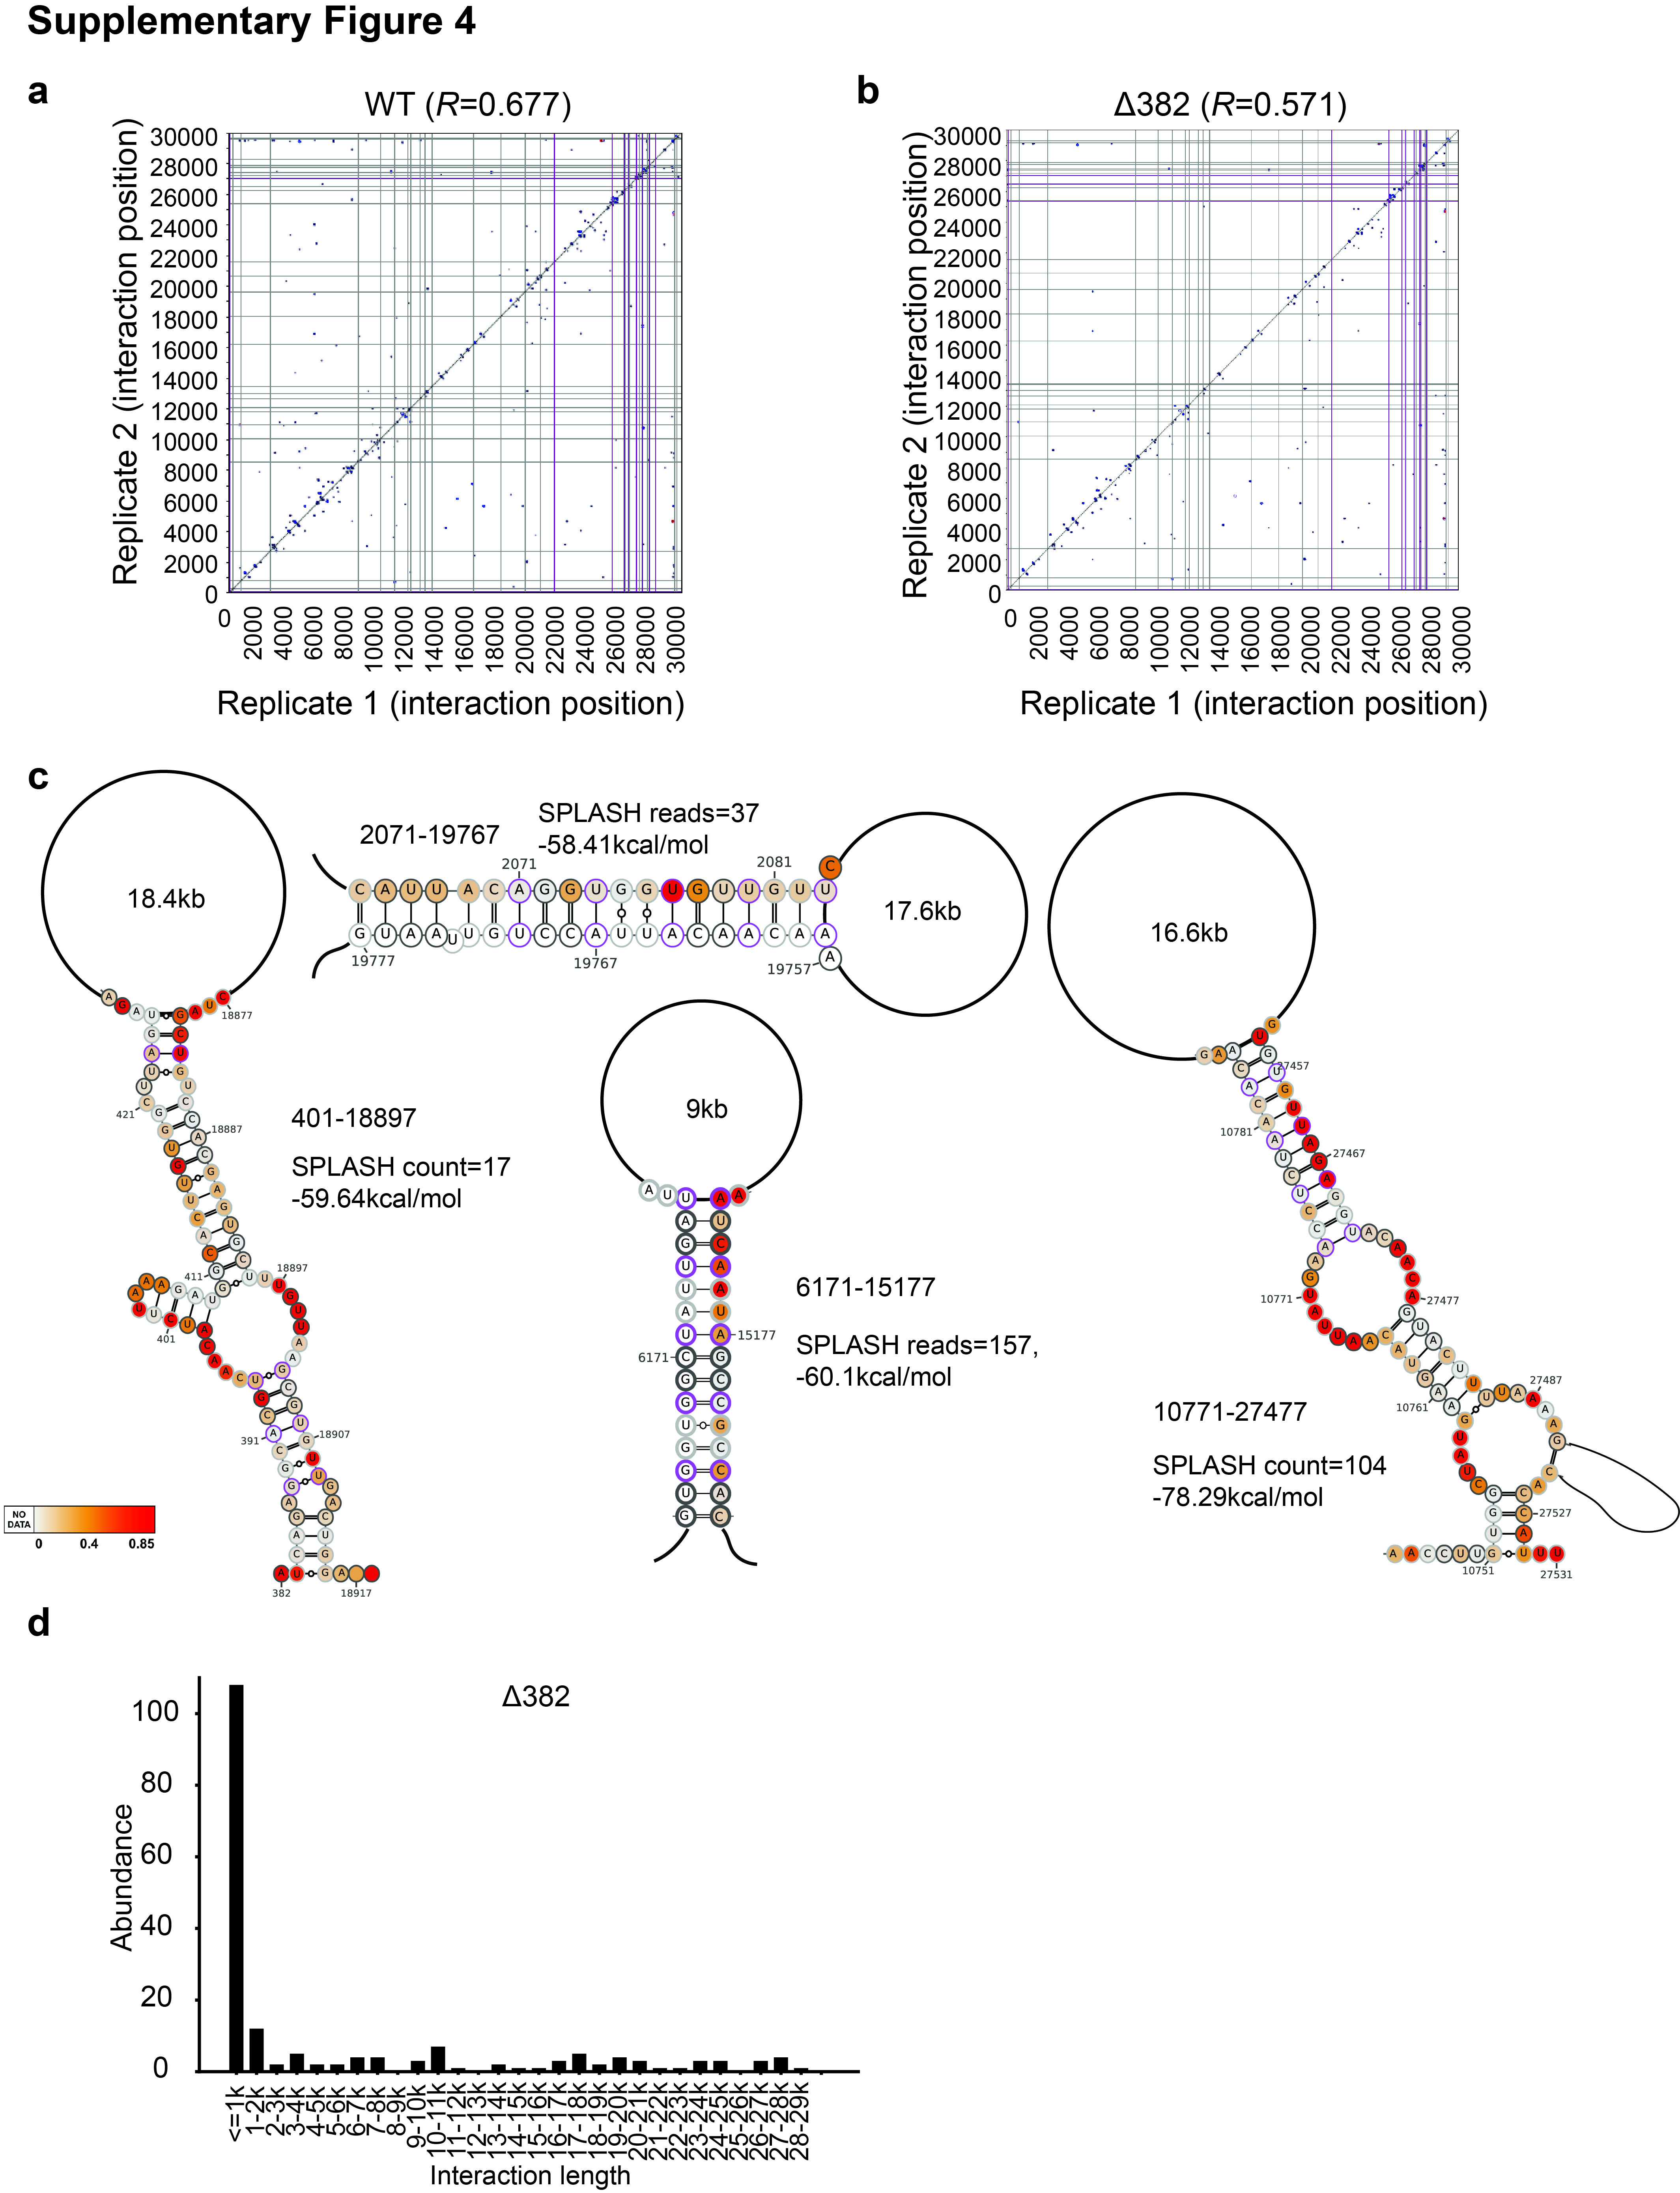
In addition to determining which bases are paired or unpaired in the SARS-CoV-2 genome, we also wanted to know the identity of pairing partners within the genome. To identify pair-wise RNA interactions, we treated SARS-CoV-2 or Δ382 infected Vero-E6 cells with biotinylated psoralen and performed proximity ligation sequencing (SPLASH)20. Biological replicates of SPLASH showed good correlation of pair-wise interactions between the samples, indicating that our method is robust (Supp. Figure 4a,b).
We identified 237 and 187 intramolecular interactions along the WT and Δ382 genomes respectively (Figure 3a, Supp. Tables 3,4). SPLASH pair-wise interaction patterns are largely consistent between WT and Δ382 genomes, indicating the robustness of our method (Figure 3a). 45.6% and 42.3% of the intramolecular interactions occur over distance longer than 1kb in the WT and Δ382 genomes respectively, indicating that the viral sequences are involved in extensive long-range interactions (Figure 3b, Supp. Figure 4c,d). Longer-range interactions (>1kb) tend to have lower number of reads than shorter-range interactions, indicating that they are formed more transiently inside cells (Figure 3c), consistent with previous literature that longer-range interactions tend to be disrupted32. As RNA structures could have an impact on regulation of virus gene expression, we examined whether RNA pairing could be associated with translation using publicly available SARS-CoV-2 ribosome profiling data. We observed that ribosome pause sites from cycloheximide experiments have more pair-wise interactions than non-pause sites (Figure 3d)33, suggesting that RNA structures could be associated with translational pauses and thus regulate the translation of SARS-CoV-2.
Interestingly, we observed that SARS-CoV-2 RNA exhibit more alternative interactions than DENV and ZIKV RNAs inside the cell, with 55.6% and 48.1% of the WT and Δ382 pair-wise interactions involving two or more partners (Figure 3e)10, suggesting that SARS-CoV-2 RNA takes on numerous conformations that are present simultaneously inside host cells. We observed that a location at the 3’ end of sgRNA N is particularly promiscuous and interacts with regions throughout ORF1a (Figure 3f). Structure modelling of SPLASH identified interactions using the program RNA-cofold revealed that energies calculated from the predicted pairings are coherent with the SPLASH interaction counts (Figure 3g)34, indicating that the relative abundance of SPLASH counts between different interactions could serve as a proxy for the relative prevalence of these interactions inside cells.
SARS-CoV-2 sgRNAs are structurally different
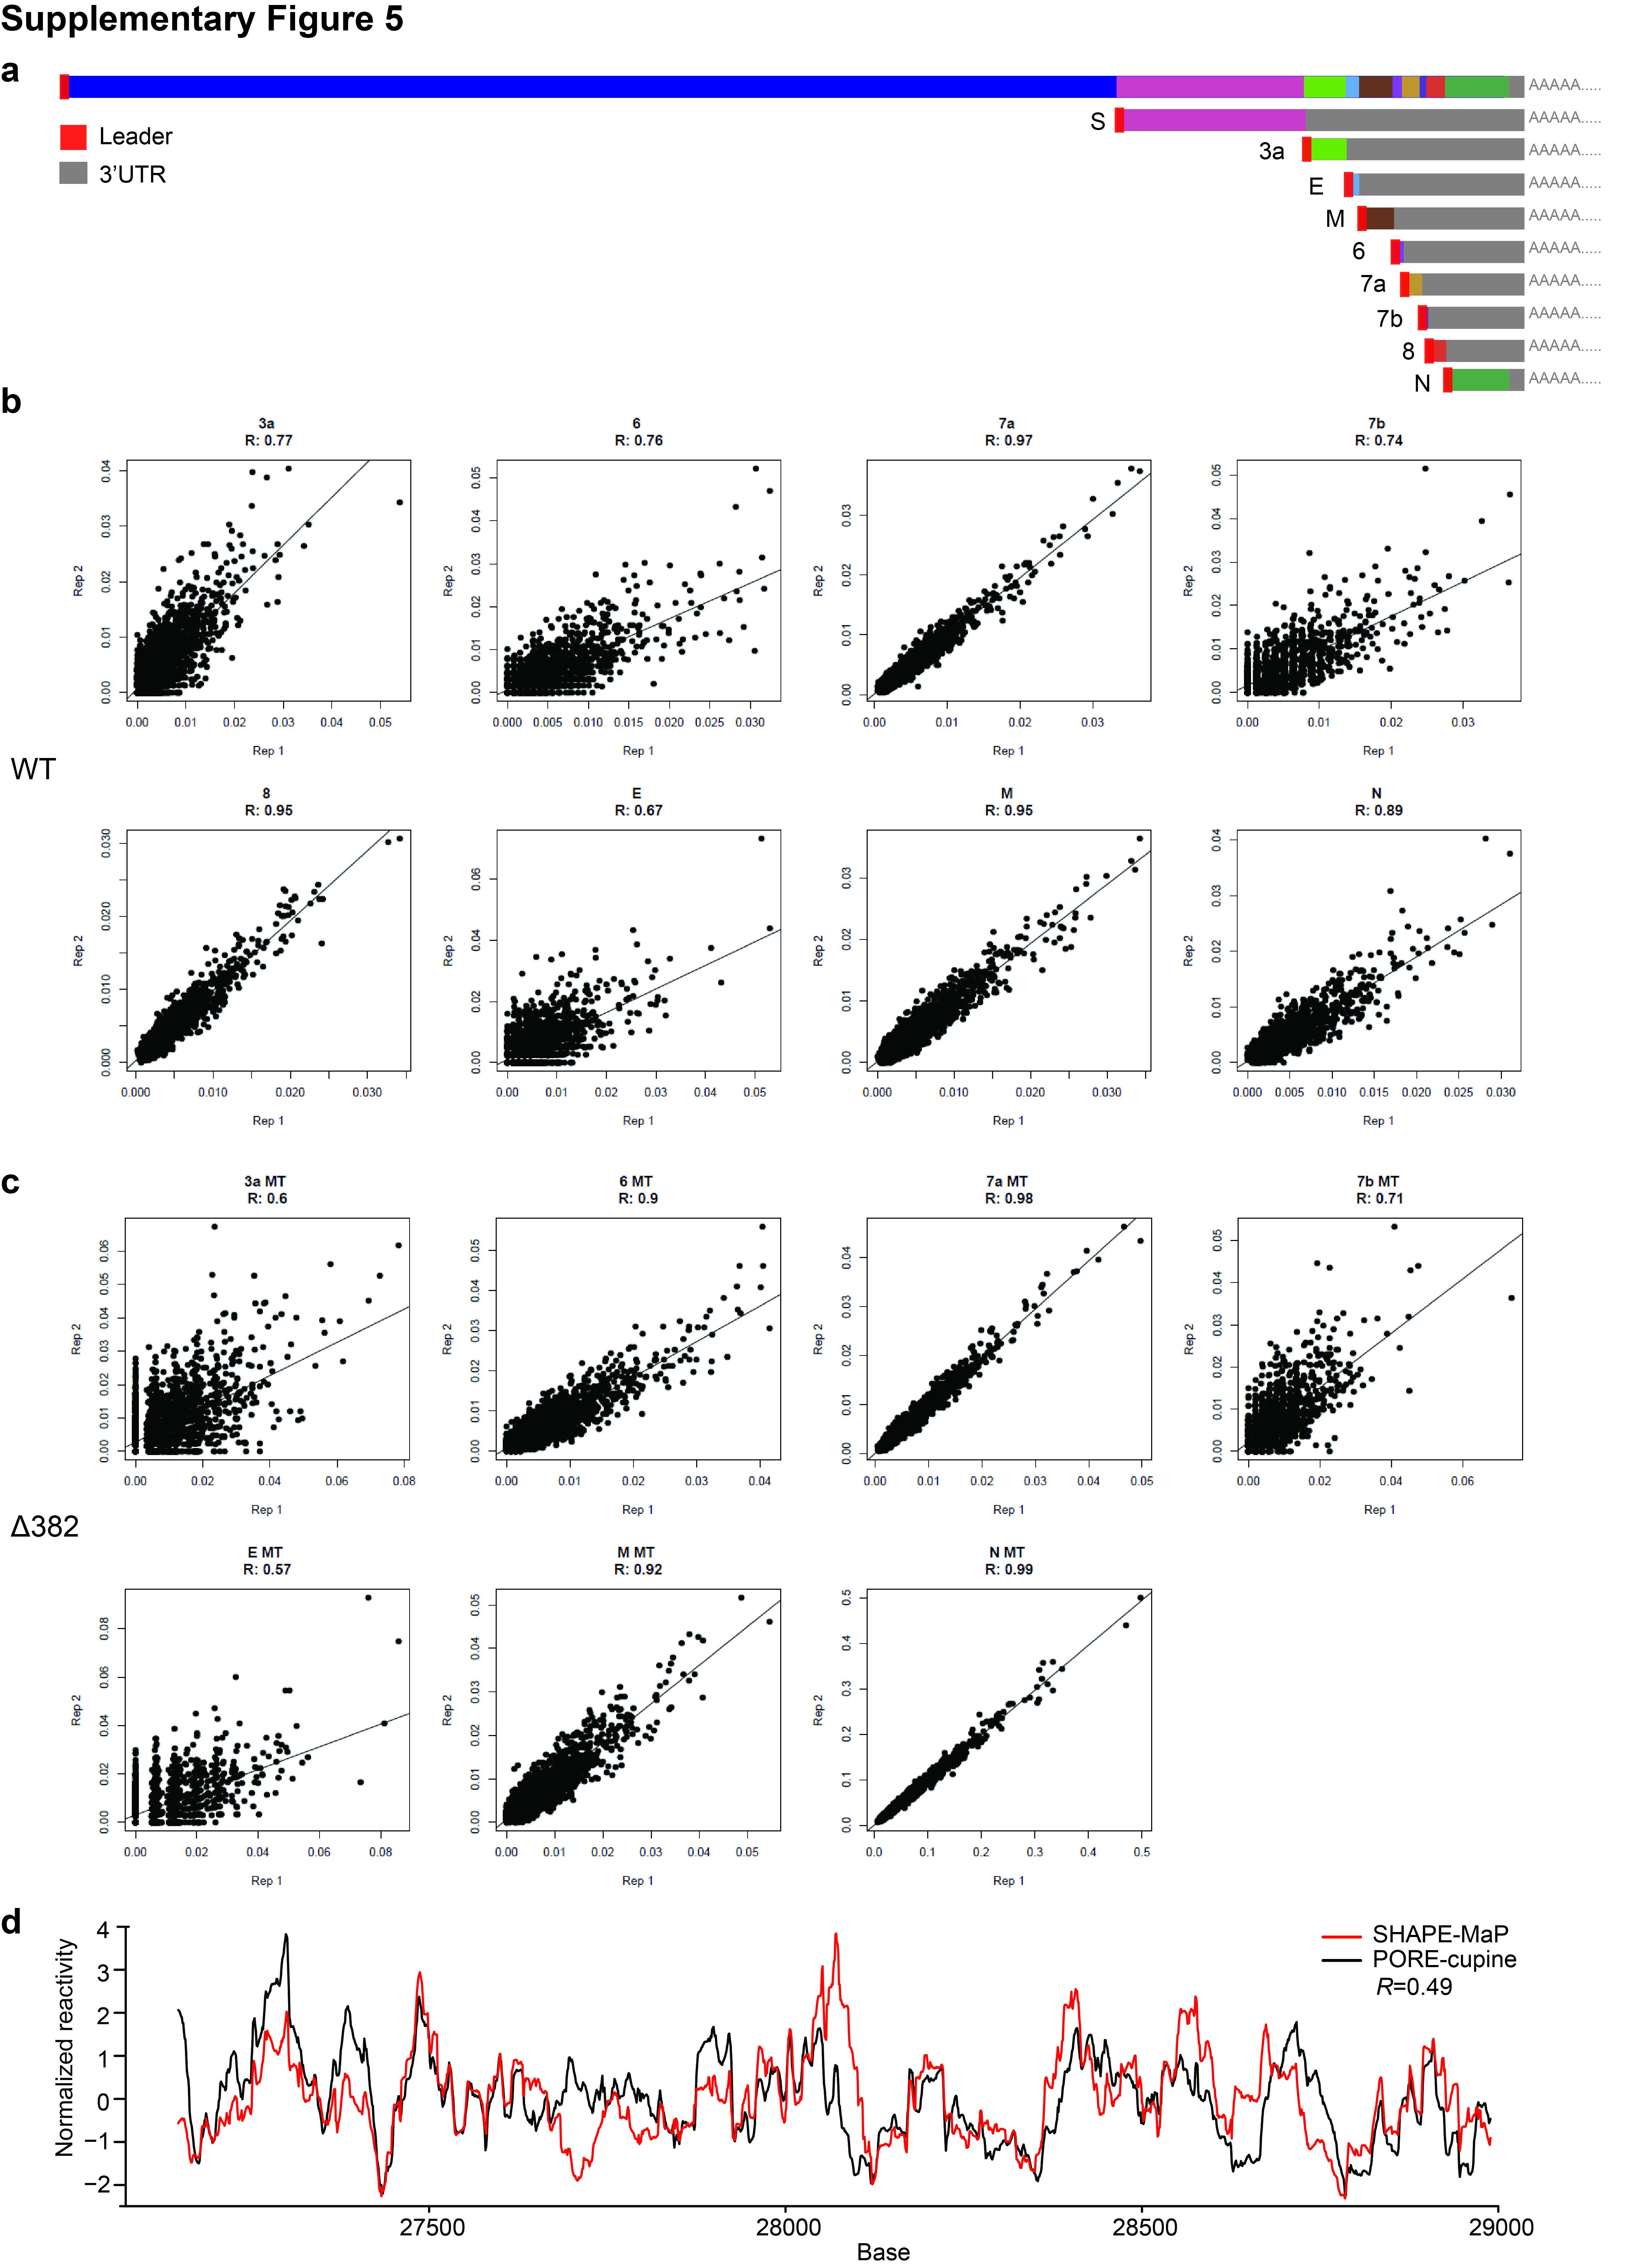
In addition to the synthesis of the full-length genomes, a nested set of 3’ co-terminal sgRNAs are made in SARS-CoV-2 infected cells using discontinuous RNA synthesis9 (Supp. Figure 5a). These sgRNAs range from 2-8 kb long, contain a leader sequence and are produced at different amounts. While SHAPE-MaP provides information on single nucleotide SHAPE along the genome, short-read sequencing makes it difficult to map structure information unambiguously to individual sgRNAs. As such, it is unclear if individual sgRNA contains unique structures that are different from these in the full length RNA genome and in other types of sgRNAs that could possibly be important for sgRNA-specific functions and regulation of their replication and translation.
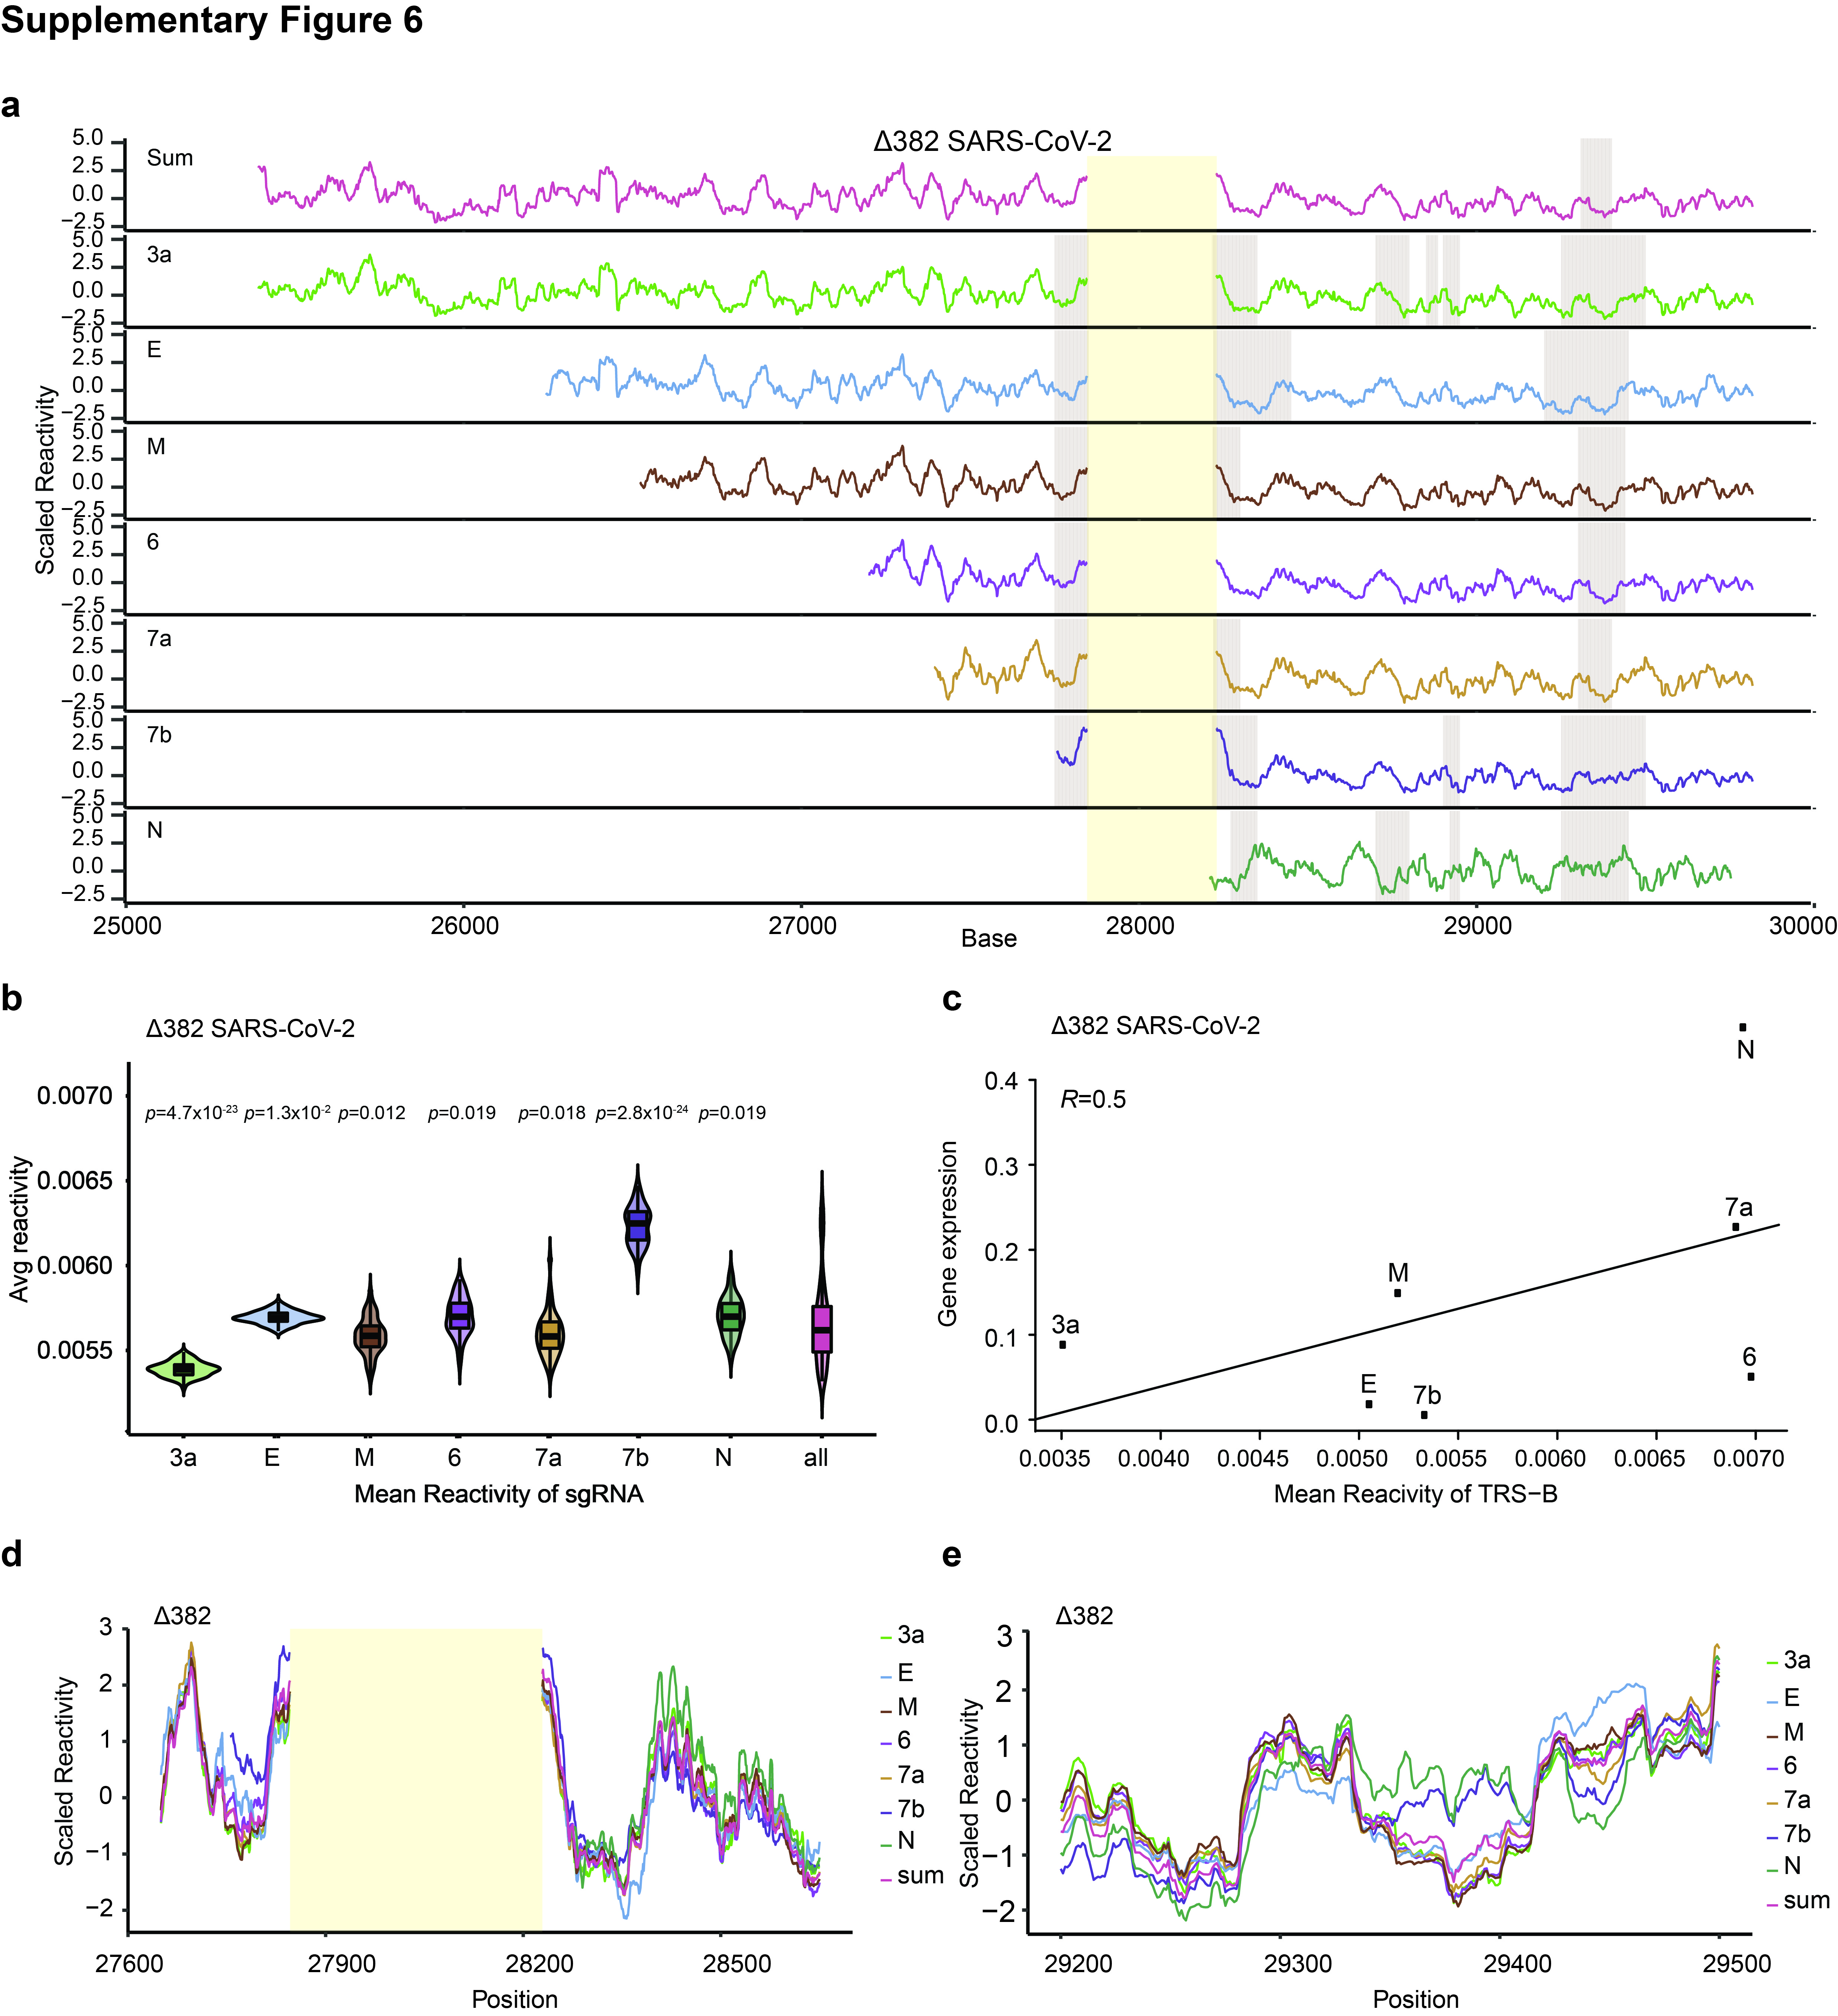
To address this, we utilize our previously developed method of coupling RNA structure probing with Nanopore direct-RNA sequencing (PORE-cupine) to allow us to read out SHAPE reactivities along long RNA molecules19. Sequencing of two biological replicates of RNAs extracted from NAI-treated, WT and Δ382 SARS-CoV-2 infected Vero cells showed good structure correlation, indicating that our data is reliable (Supp. Figure 5b,c). We also confirmed that PORE-cupine reactivity shows good correlation with SHAPE-MaP reactivity along the SARS-CoV-2 genome (Supp. Figure 5d). By filtering for the full length reads that contain leader sequences, we determined reactivities along individual ORF3a, E, M, ORF6, ORF7a, ORF7b, ORF8 (WT only) and N transcripts (Figure 4a, Supp. Figure 6a, Supp. Table 5). We observed that ORF7b RNA contains the highest average reactivities for both WT and Δ382, suggesting that it is likely to be the most single-stranded among the different sgRNAs of SARS-CoV-2 (Figure 4b, Supp. Figure 6b). As structures around the leader sequences for each sgRNA were previously shown to have weak correlations with gene expression, we calculated the correlation between PORE-cupine reactivity around TRS-B sites for each sgRNA and their relative abundance from our Nanopore data. We observe a weak positive correlation between reactivity and transcript abundance, similar to previously published literature28, for both WT and Δ382 sgRNAs, suggesting that single-strandedness around the TRS-B region could result in increased synthesis of corresponding sgRNAs (Figure 4c, Supp. Figure 6c).
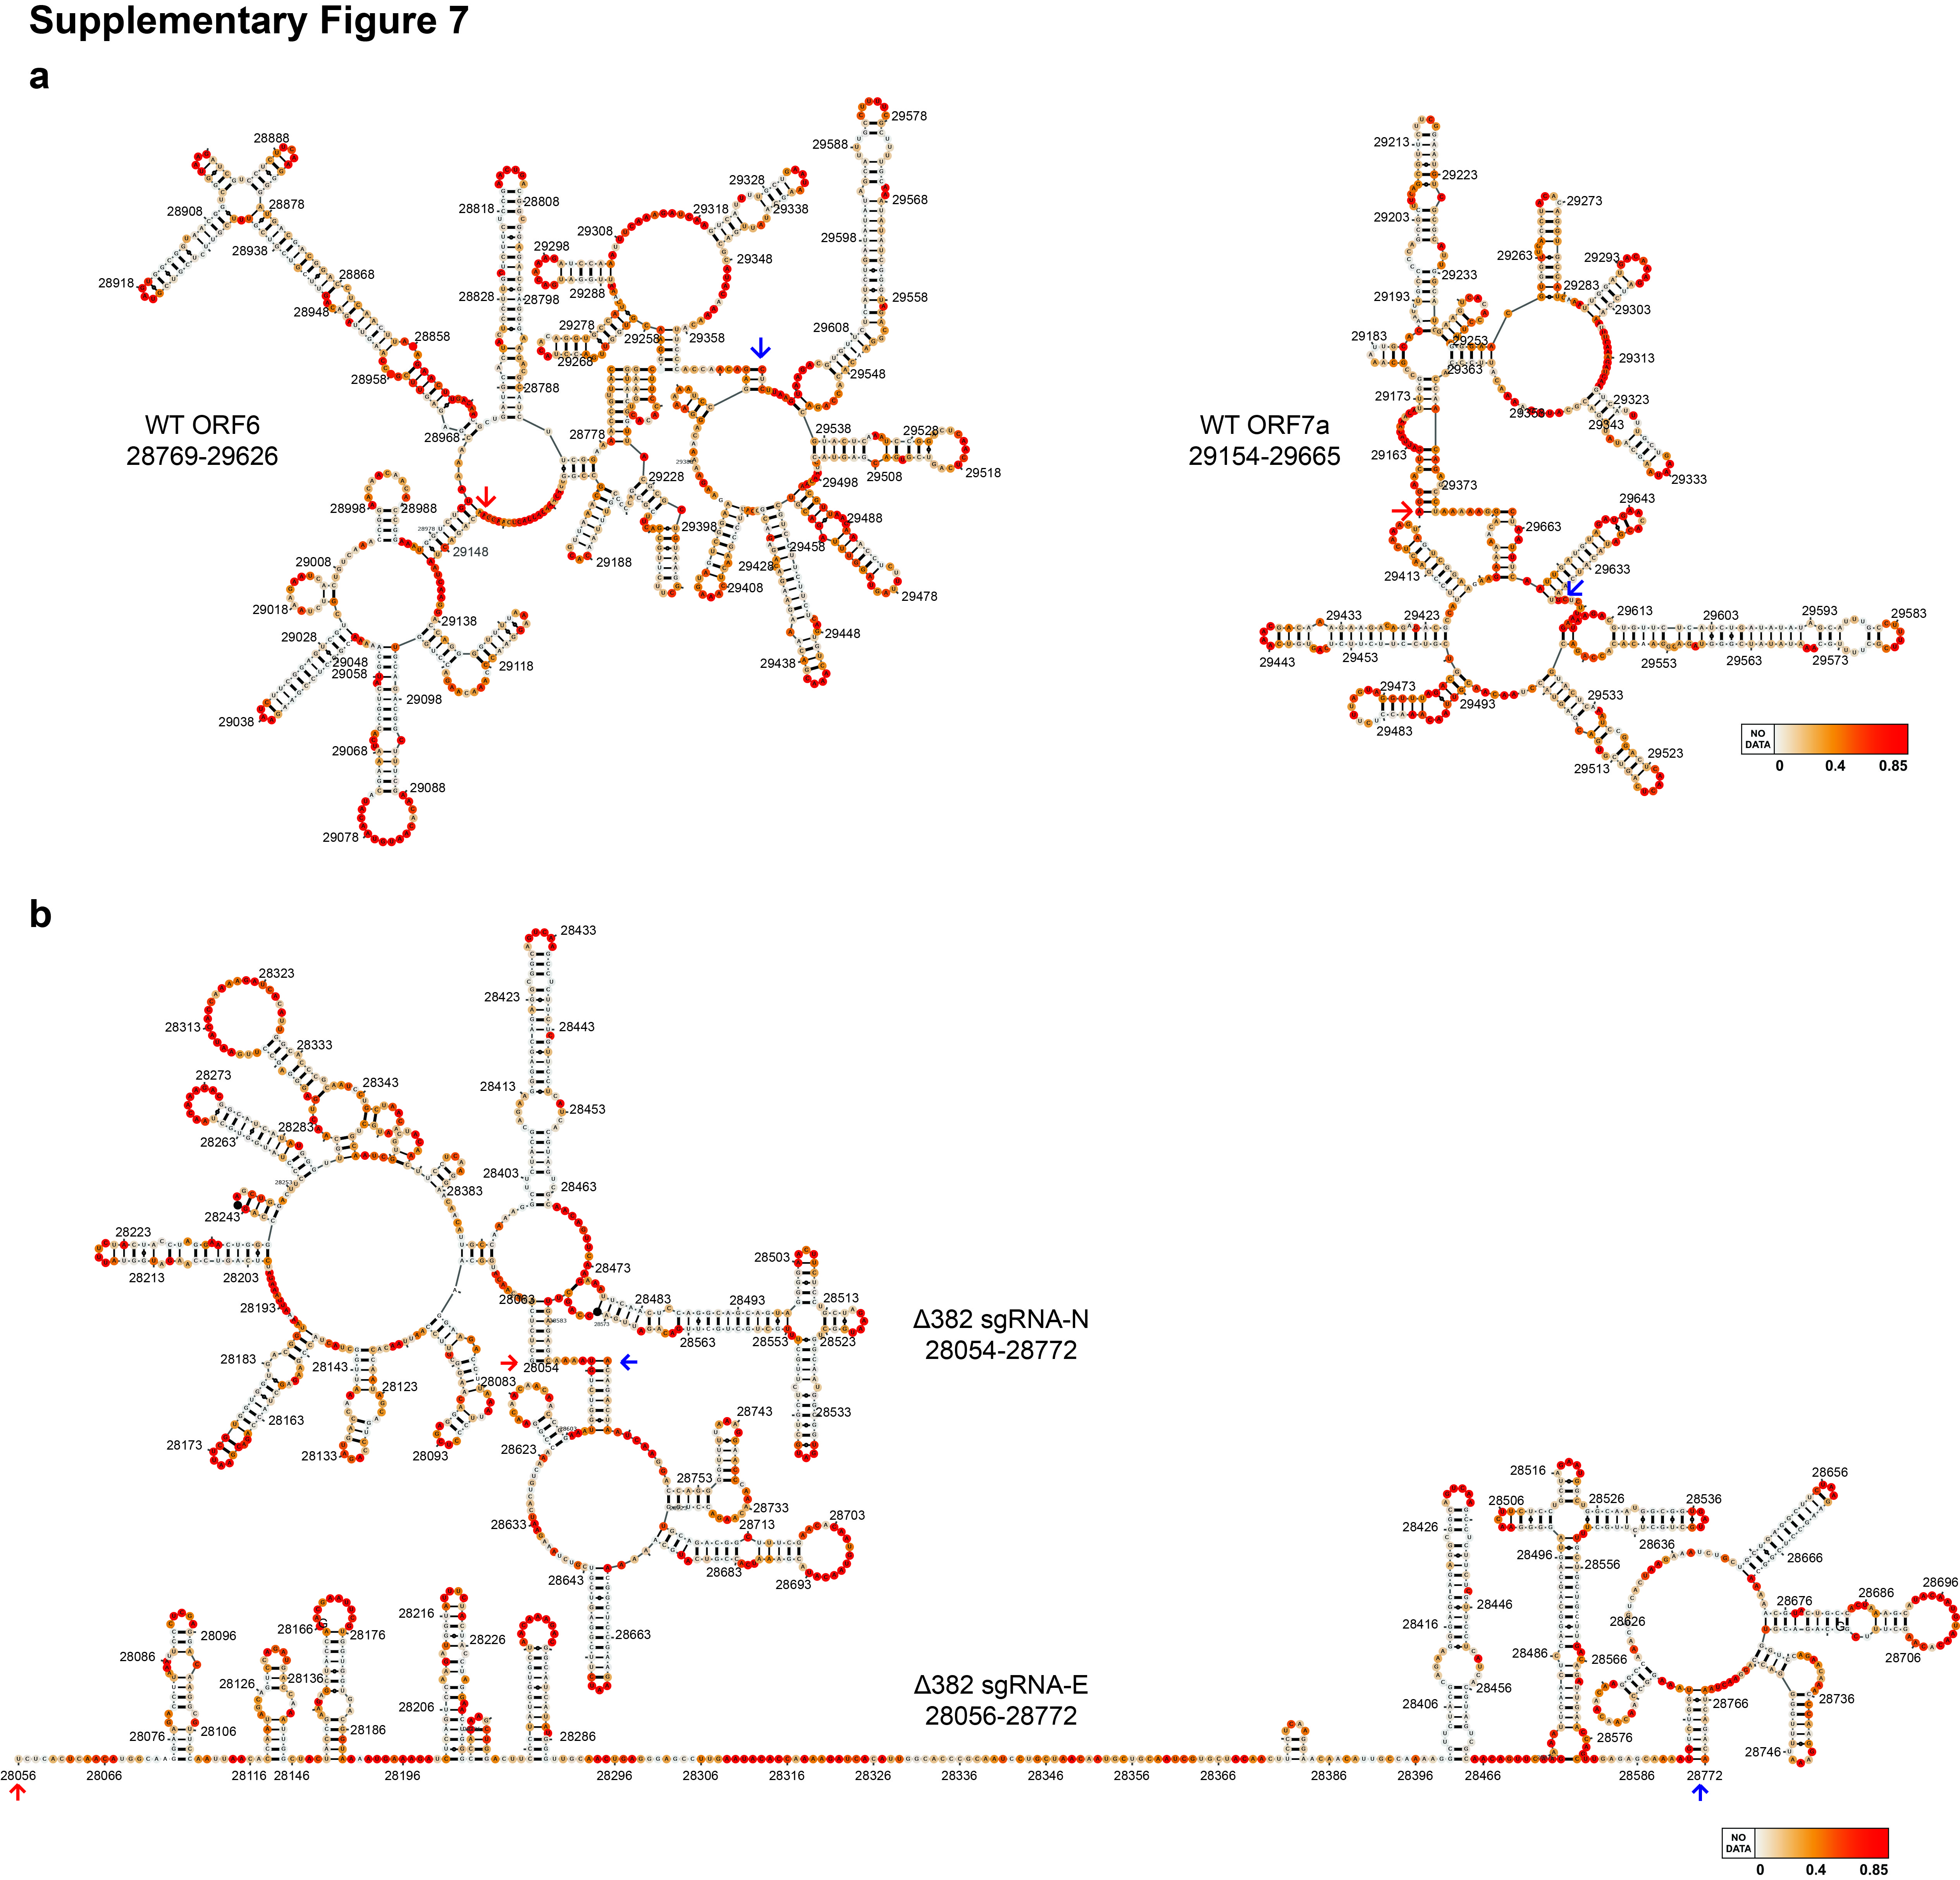
To identify structures unique to each sgRNA, we compared the reactivities among individual sgRNAs to identify highly consistent as well as divergent structural regions (Figure 4a, Methods). We found 4 regions in RNAs of WT SARS-CoV-2 that showed consistent structure differences between different sgRNAs, 3 of which are also seen in the RNAs of Δ382 sgRNAs (Supp. Figure 6a). While two regions centred around bases 27800 and 28250 correspond to the leader sequences of sgRNAs of ORF7b and N respectively, two other structurally different regions (centred around 29300 and in 3’UTR) are present within all sgRNAs, and hence cannot be identified using short-read sequencing (Figure 4d,e, Supp. Figure 6a,d,e). We checked that the regions that show diverse structures in different sgRNAs also exhibit multiple interaction partners by SPLASH, confirming that those regions do exist in alternative conformations (Figure 4f). We then visualized the sgRNA-specific structures by incorporating PORE-cupine reactivities into structure modelling and observed different structure models for the same sequence region in different sgRNAs (Figure 4g, Supp. Figure 7a,b), further confirming that different sgRNAs could exist in different structures despite sharing the same sequences.
Genomes of WT and Δ382 SARS-CoV-2 contain different RNA structures
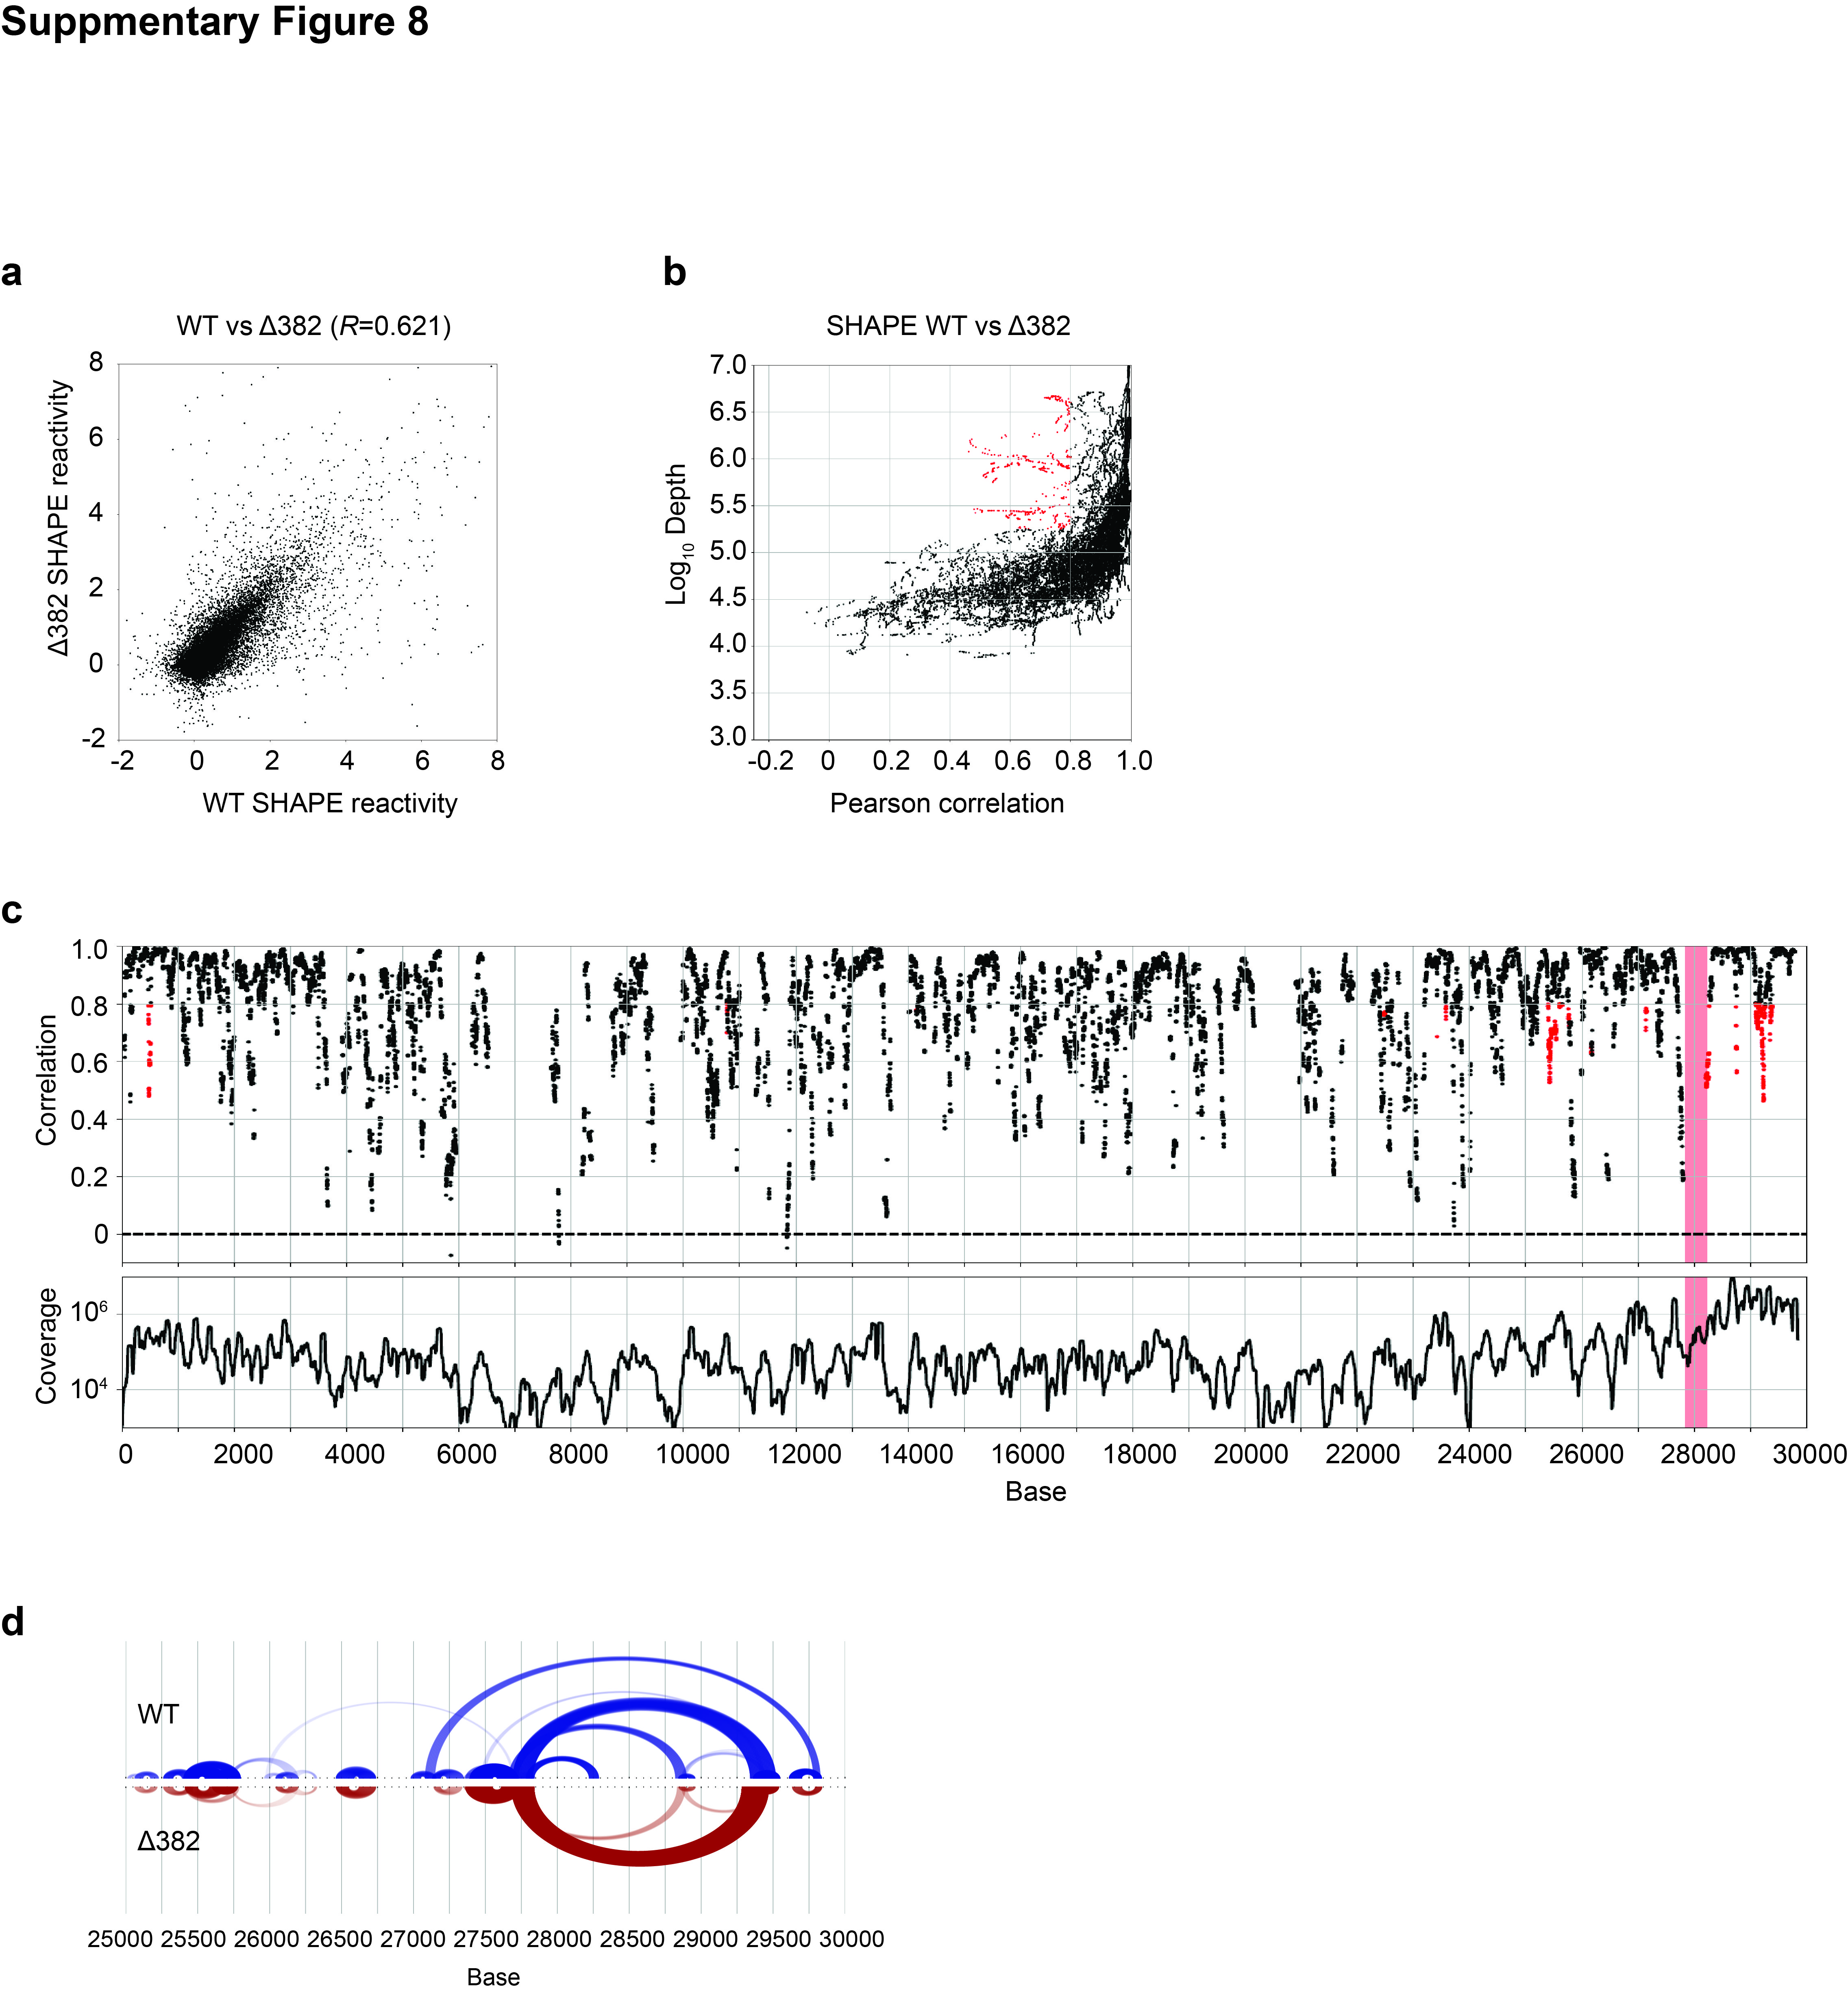
Viruses that contain genomes with various ORF8 deletions have been found in patients around the world7, however the mechanisms behind how such deletions impacts the virus are still largely unknown. To determine whether virus phenotypes could be associated with structural differences, we performed correlations of SHAPE-MaP reactivities between the two genomes. As expected, structures in WT and Δ382 genomes are generally highly correlated (R=0.62, Supp. Figure 8a), although we do observe local structure differences at the deletion region of around base 28000 (Supp. Figure 8b,c). SPLASH analysis around the deletion region also revealed differences in pair-wise interactions between WT and Δ382, confirming the local structure rearrangements between the two viruses (Supp. Figure 8d).
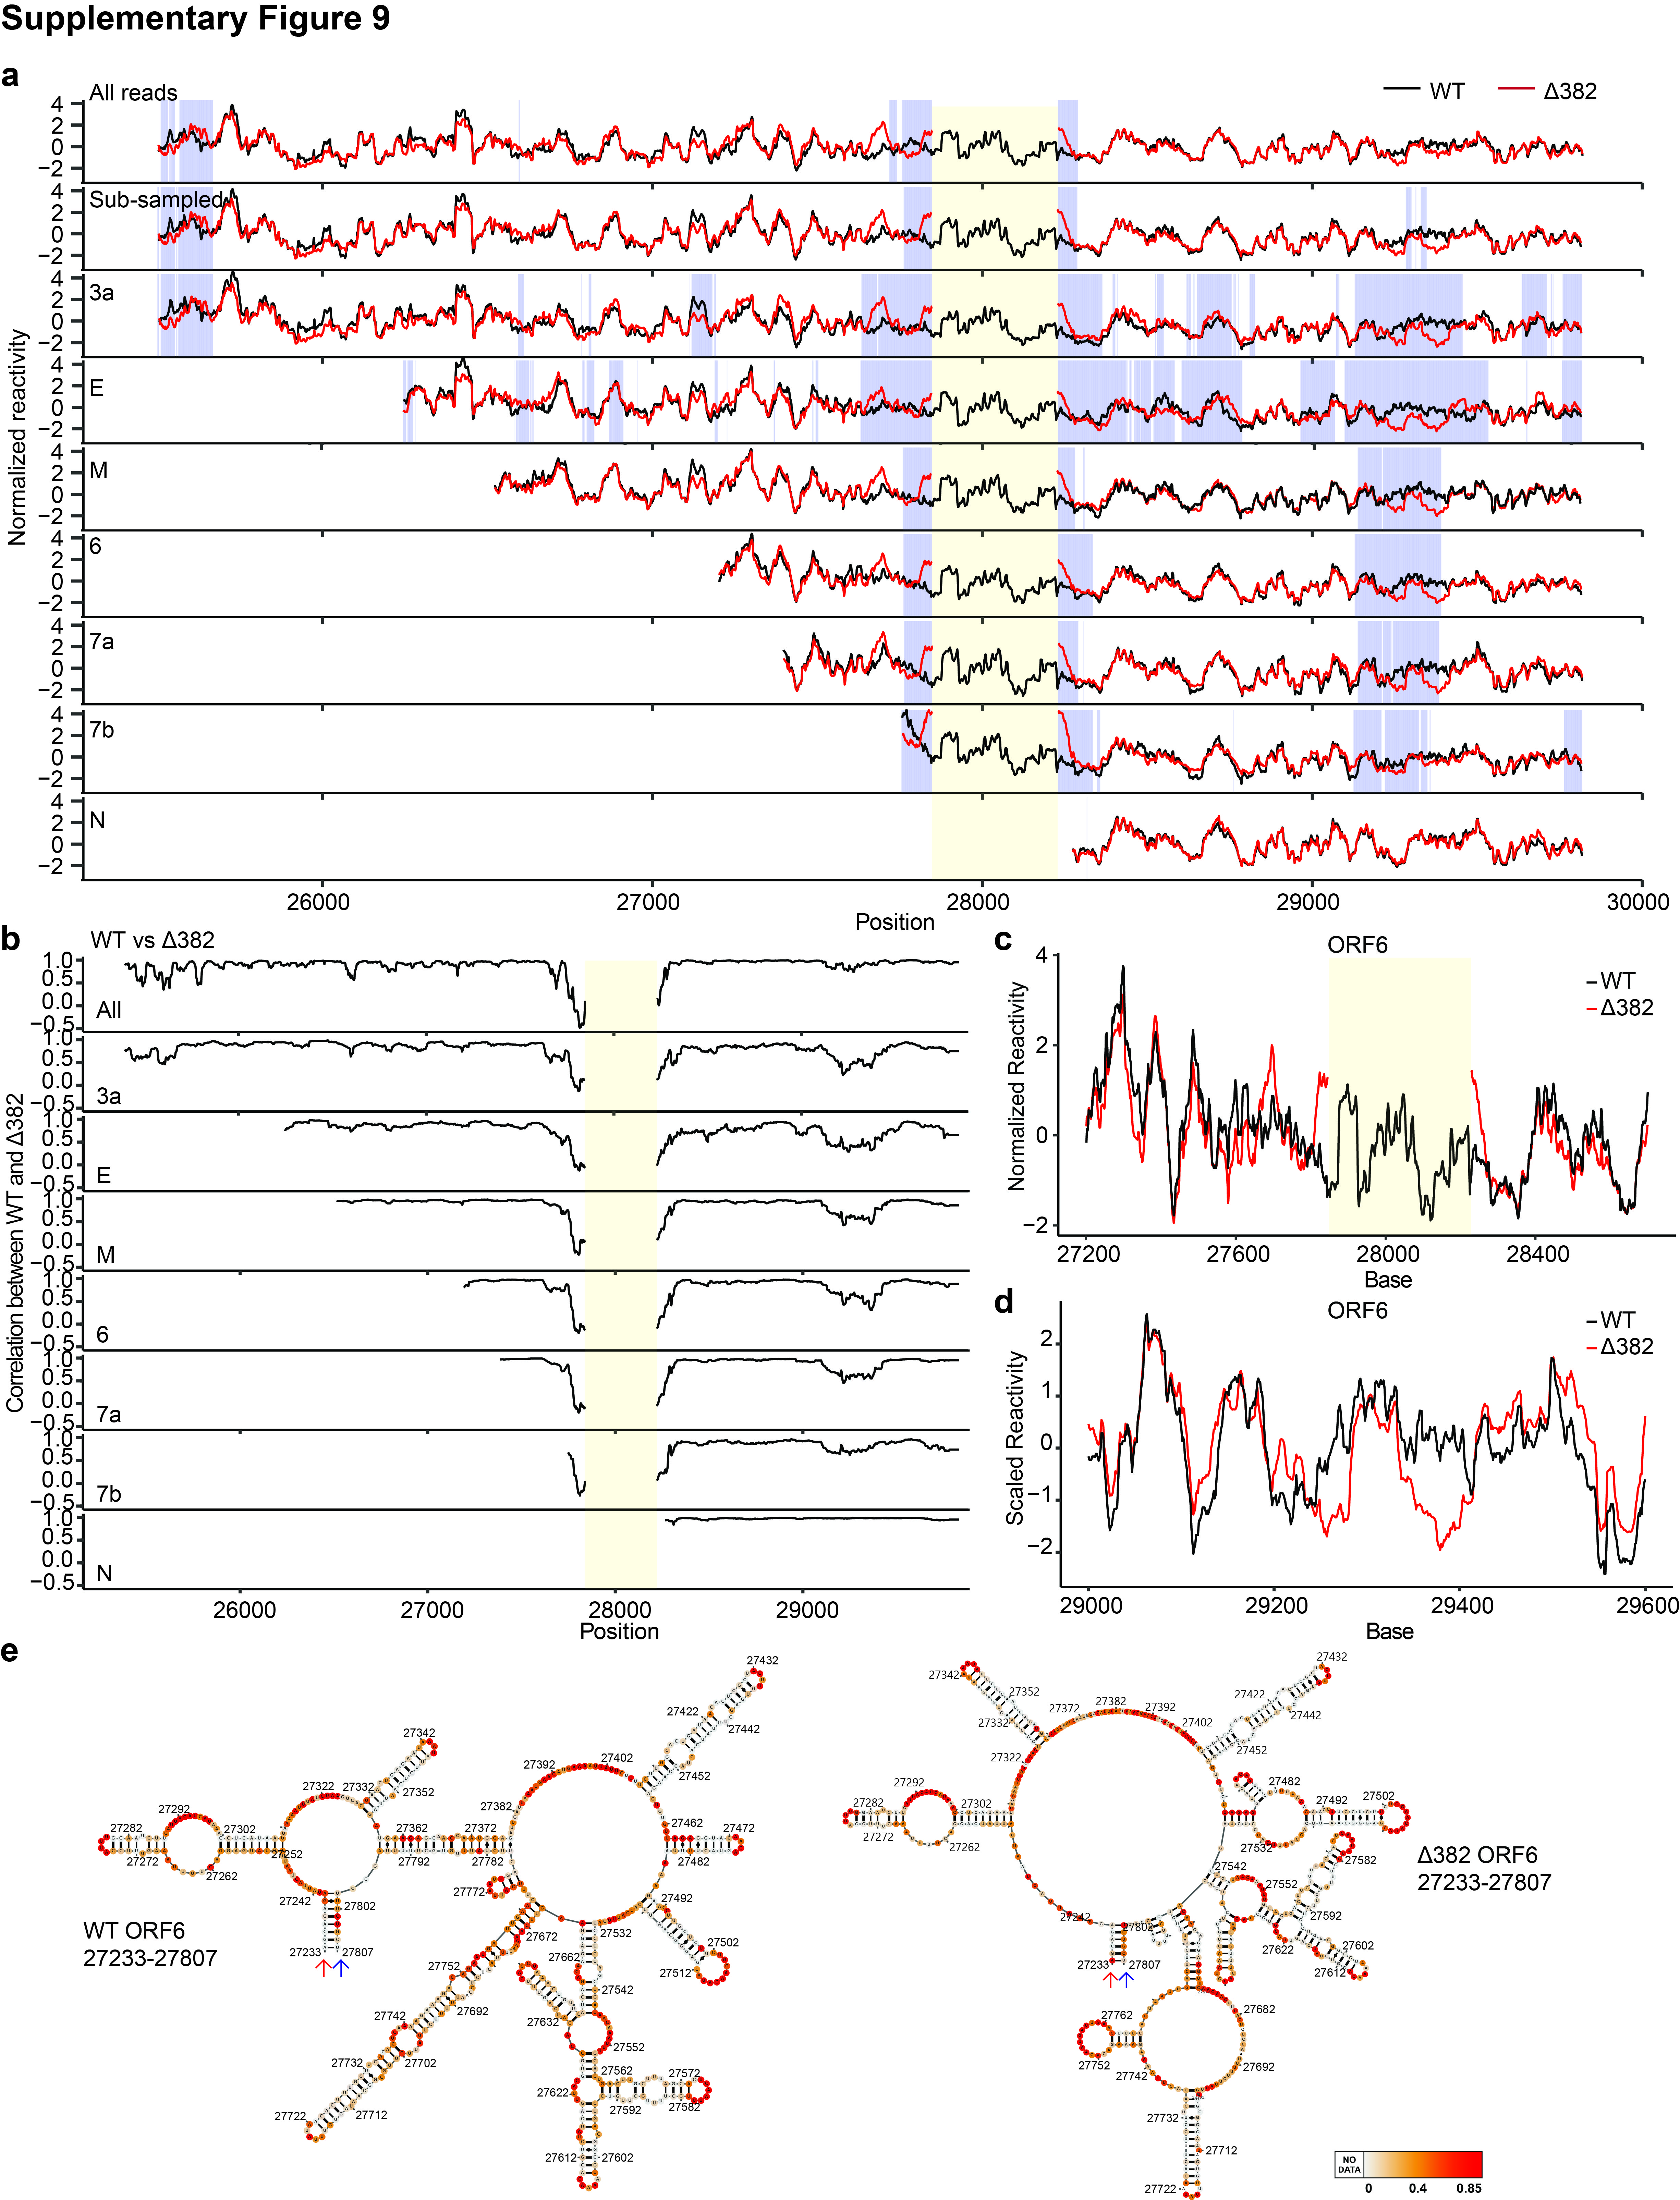
As the deletion occurs around base 28000 (ORF8), it is present not only in the full-length genome but also in most of the sgRNAs (except for sgRNA of N, starts site of which is located downstream of the deletion). Due to the extensive amount of sequence similarity between the different sgRNAs, it is difficult to map uniquely to each individual sgRNA using short-read sequencing. Consequently, it remained unclear whether the structure differences between WT and Δ382 are present in all the sgRNAs or only between some specific sgRNAs. To determine which sgRNA shows reactivity differences between WT and Δ382 genomes, we compared the PORE-cupine reactivity profiles of individual WT and Δ382 sgRNA to each other (Supp. Figure 9a). While we could only detect very local reactivity differences immediately before and after the deletion site when all of the WT and Δ382 sgRNA reads are summed and compared to each other as an aggregate (similar reactivity profiles obtained using short-read Illumina sequencing), we observed additional structure differences when individual WT and Δ382 sgRNAs are compared to each other (Supp. Figure 9a,b,c). We observed the largest structure differences between WT and Δ382 in ORF3a and E sgRNAs (Supp. Figure 9a). We also consistently observed a second structurally different region between WT and Δ382 sgRNAs at the bases 29200-29400 (Supp. Figure 9b,d), indicating that the deletion could impact distal structures that are located more than 1kb away. As expected, we did not observe reactivity differences between N-gene sgRNAs of WT and Δ382 viruses as this sgRNA is transcribed using TRS located downstream of the deletion region. This finding indicates that the reactivity differences between other sgRNAs of WT and Δ382 viruses are likely to occur in cis due to the deletion and not due to factors that may act in trans (Supp. Figure 9a,b). As sgRNA of N is by far the most abundant sgRNA of SARS-CoV-2 and it did not show structure differences between WT and Δ382 viruses9, differences in the reactivity between the 29300 region in WT and Δ382 genomes were masked when an aggregate reactivity of all sgRNAs is used for comparison (Supp. Figure 9a,b). As such, using long-read sequencing to map RNA structures across sgRNAs can yield novel insights into sgRNA-specific RNA structures.
SARS-CoV-2 genome interacts strongly with mitochondrial RNAs and snoRNAs
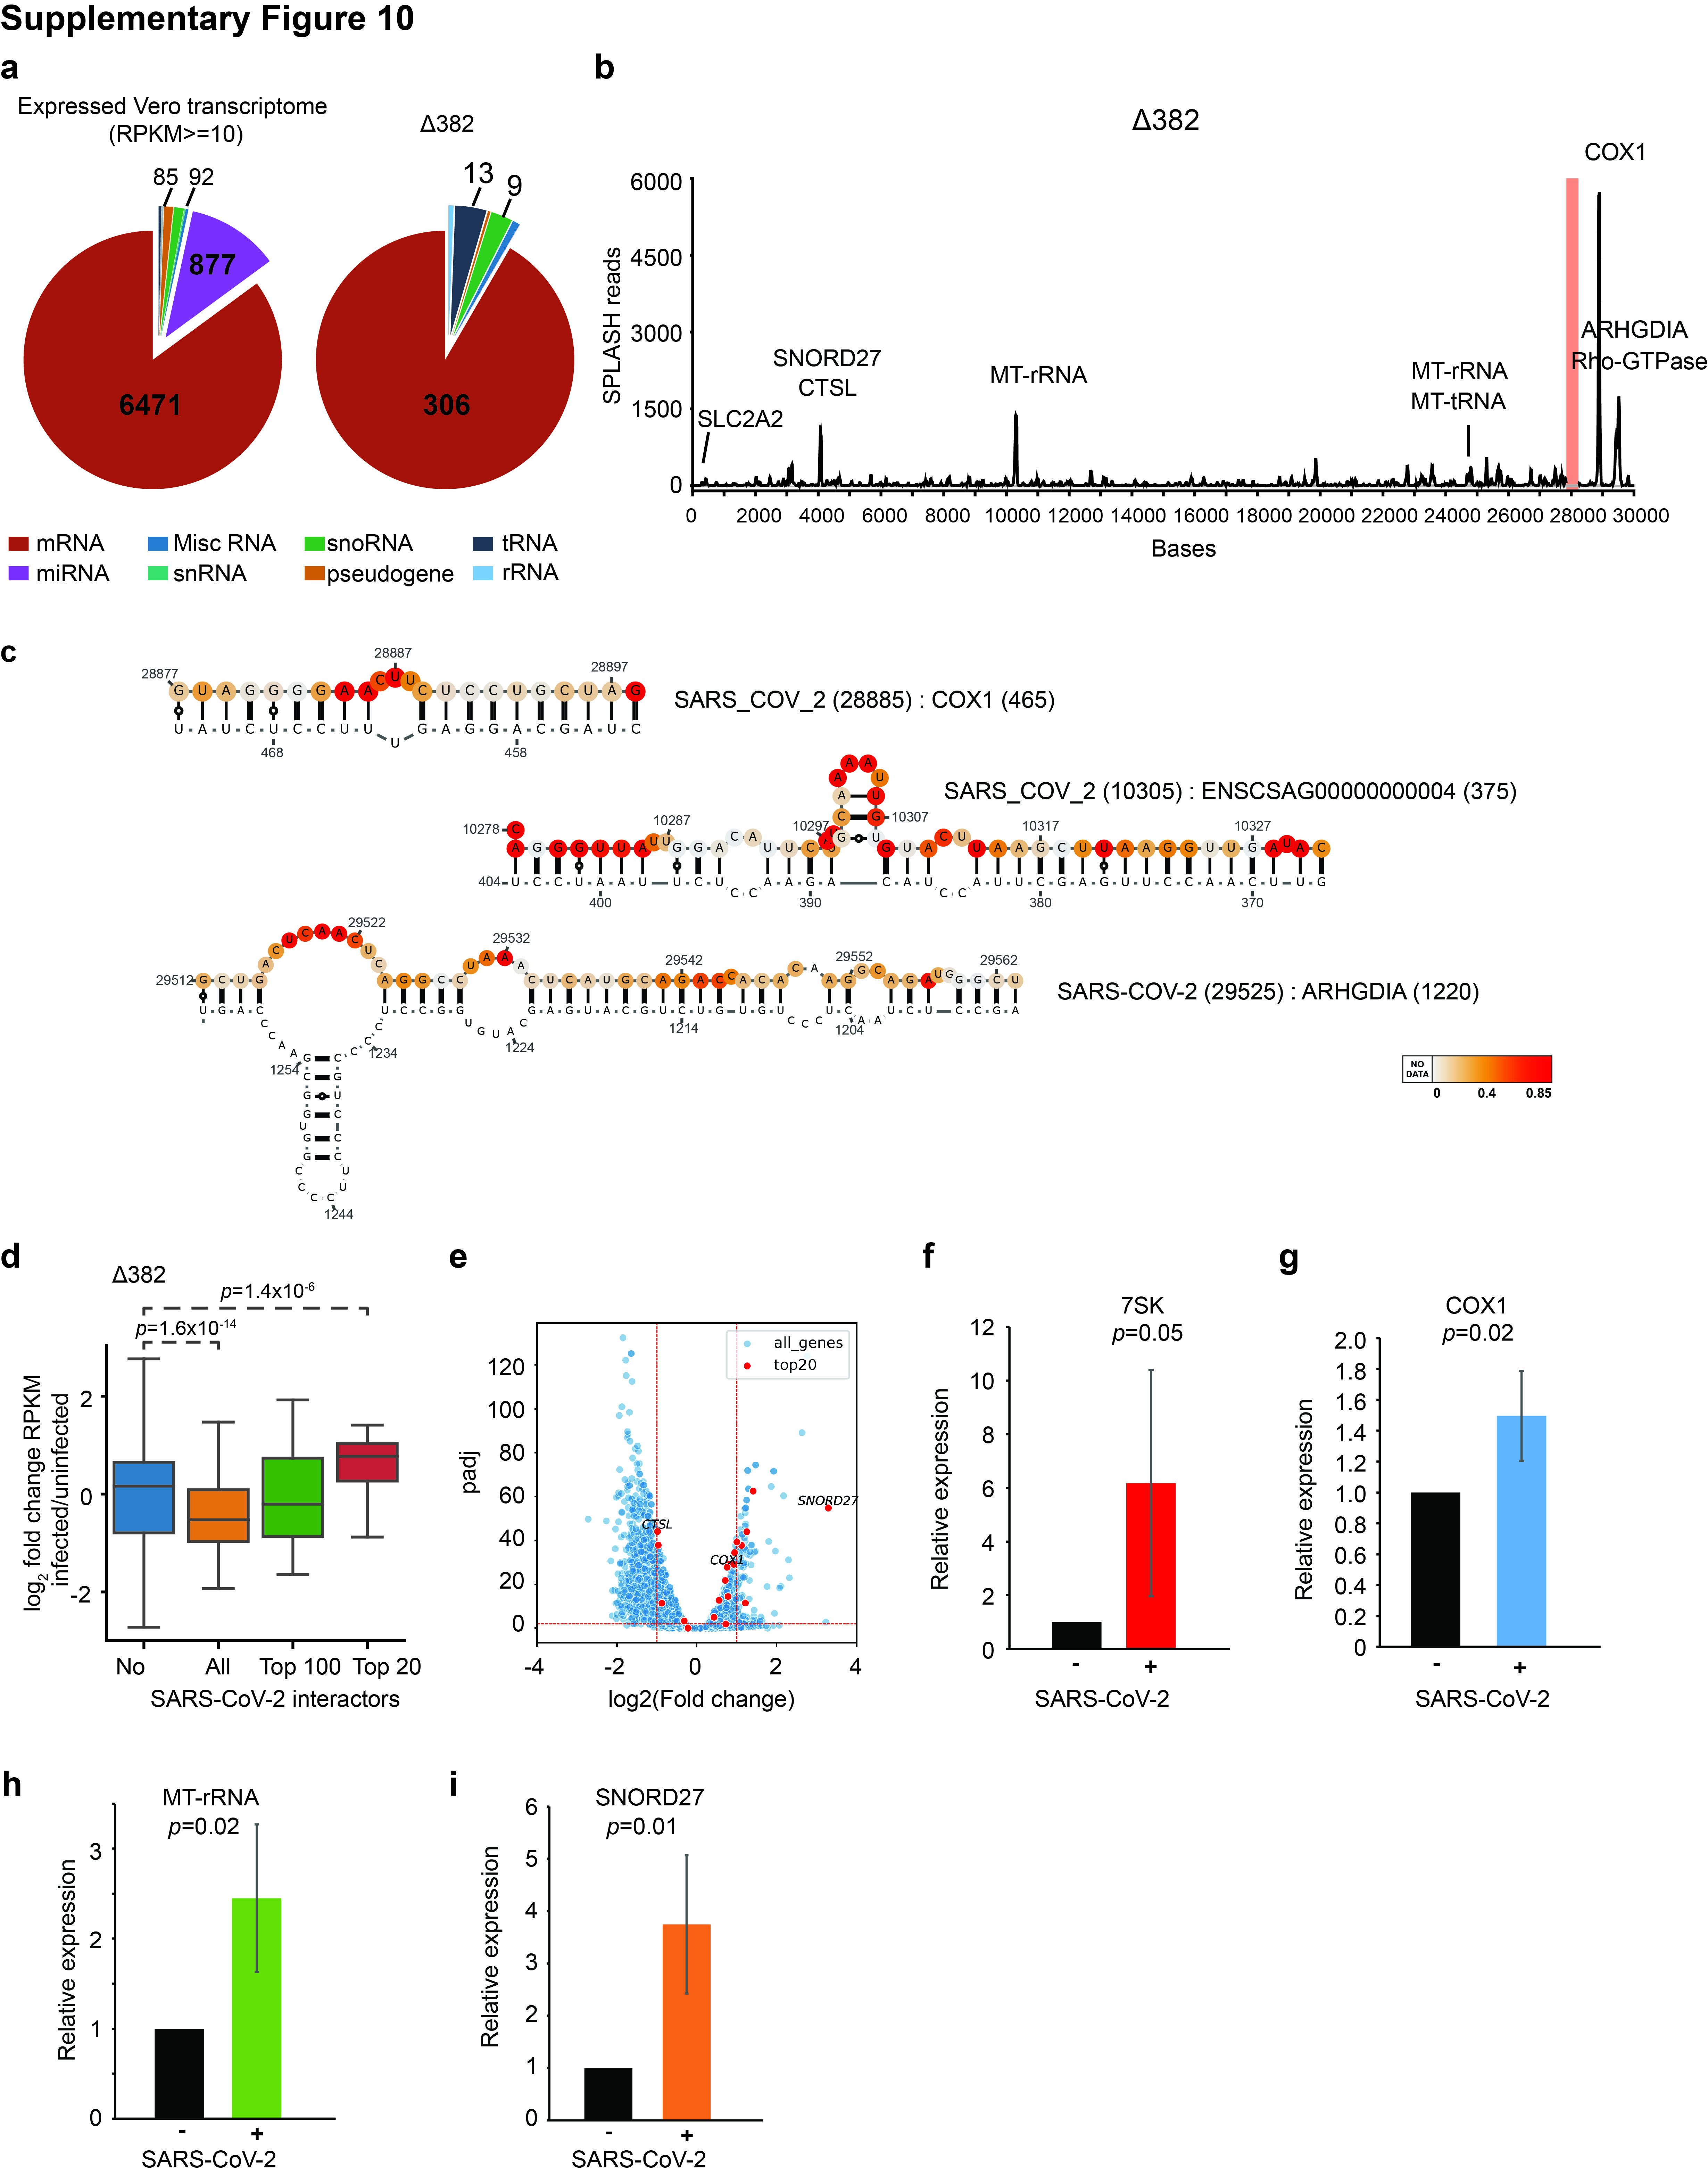
The genomes of RNA viruses can interact directly with host RNAs to facilitate or restrict viral infection. By analysing the SPLASH interactions between SARS-CoV-2 and host cell RNAs, we identified 374 and 334 host RNAs that interact with the WT and Δ382 SARS-CoV-2 genomes respectively (Figure 5a,b, Supp. Figure 10a,b, Supp. Tables 6,7). The host RNA-virus genome interactions are preferentially enriched in the coding regions along host mRNAs (Figure 5c). STRING analysis of the top 25% of SARS-CoV-2 interactors showed that they are enriched for proteins that physically interact with each other (PPI: p<10-16)35, including genes that are involved in the mitochondria, ER, GTP hydrolysis and translation processes (Figure 5d). GO term enrichment of interacting RNAs showed similar enrichments, confirming the importance of SARS-CoV-2 interactors in mitochondrial and ER function (Figure 5e)36,37.
While SARS-CoV-2 RNAs bind to more than 300 RNAs inside cells, we observed that the top 10 (2.6%) of the strongest interactors contributed to 17.5% and 24.1% of all WT and Δ382 binding events, indicating that the virus binds to them particularly strongly (Figure 5b). These strong interactors include mitochondrial RNAs such as the mRNA of COX1, a mitochondrially encoded cytochrome-c oxidase, mitochondrial rRNA, mRNA of ARHGDIA, a Rho-GTPase signaling protein and SNORD27, a snoRNA responsible for 18S ribosomal RNA methylation (Supp. Figure 10c). Previous study using RNA-GPS had shown that SARS-CoV-2 is localized to the mitochondria and the nucleolus38. SARS-CoV-2 infection also results in mitochondrial dysregulation23,39. Further experiments are needed to test whether the direct pairing between SARS-CoV-2 and mitochondrial RNAs contributes to mitochondrial dysregulation.
SARS-CoV-2 infection has been found to have an impact on almost every aspect of the host transcriptome to control virus and host gene regulation40. We observed a general decrease of RNA abundance of SARS-CoV-2 interactors upon virus infection. Interestingly, however, an opposite trend was observed for the strong interactors that were selectively stabilized and their abundance increased (Figure 5f,g, Supp. Figure 10d,e). qRT-PCR analysis of key interactors such as COX1 mRNA and MT-rRNA showed that these RNAs are indeed stabilized upon virus infection, confirming our RNA sequencing results (Supp. Figure 10f-i). Mining of published SARS-CoV-2 proteomics data revealed that proteins encoded by SARS-CoV-2 interactors were also preferentially translated and/or stabilized at the protein level as compared to proteins produced by non-SARS-CoV-2 interactors (Figure 5h)41. Thus, interaction with SARS-CoV-2 RNAs may confer a stabilizing effect on their overall gene regulation.
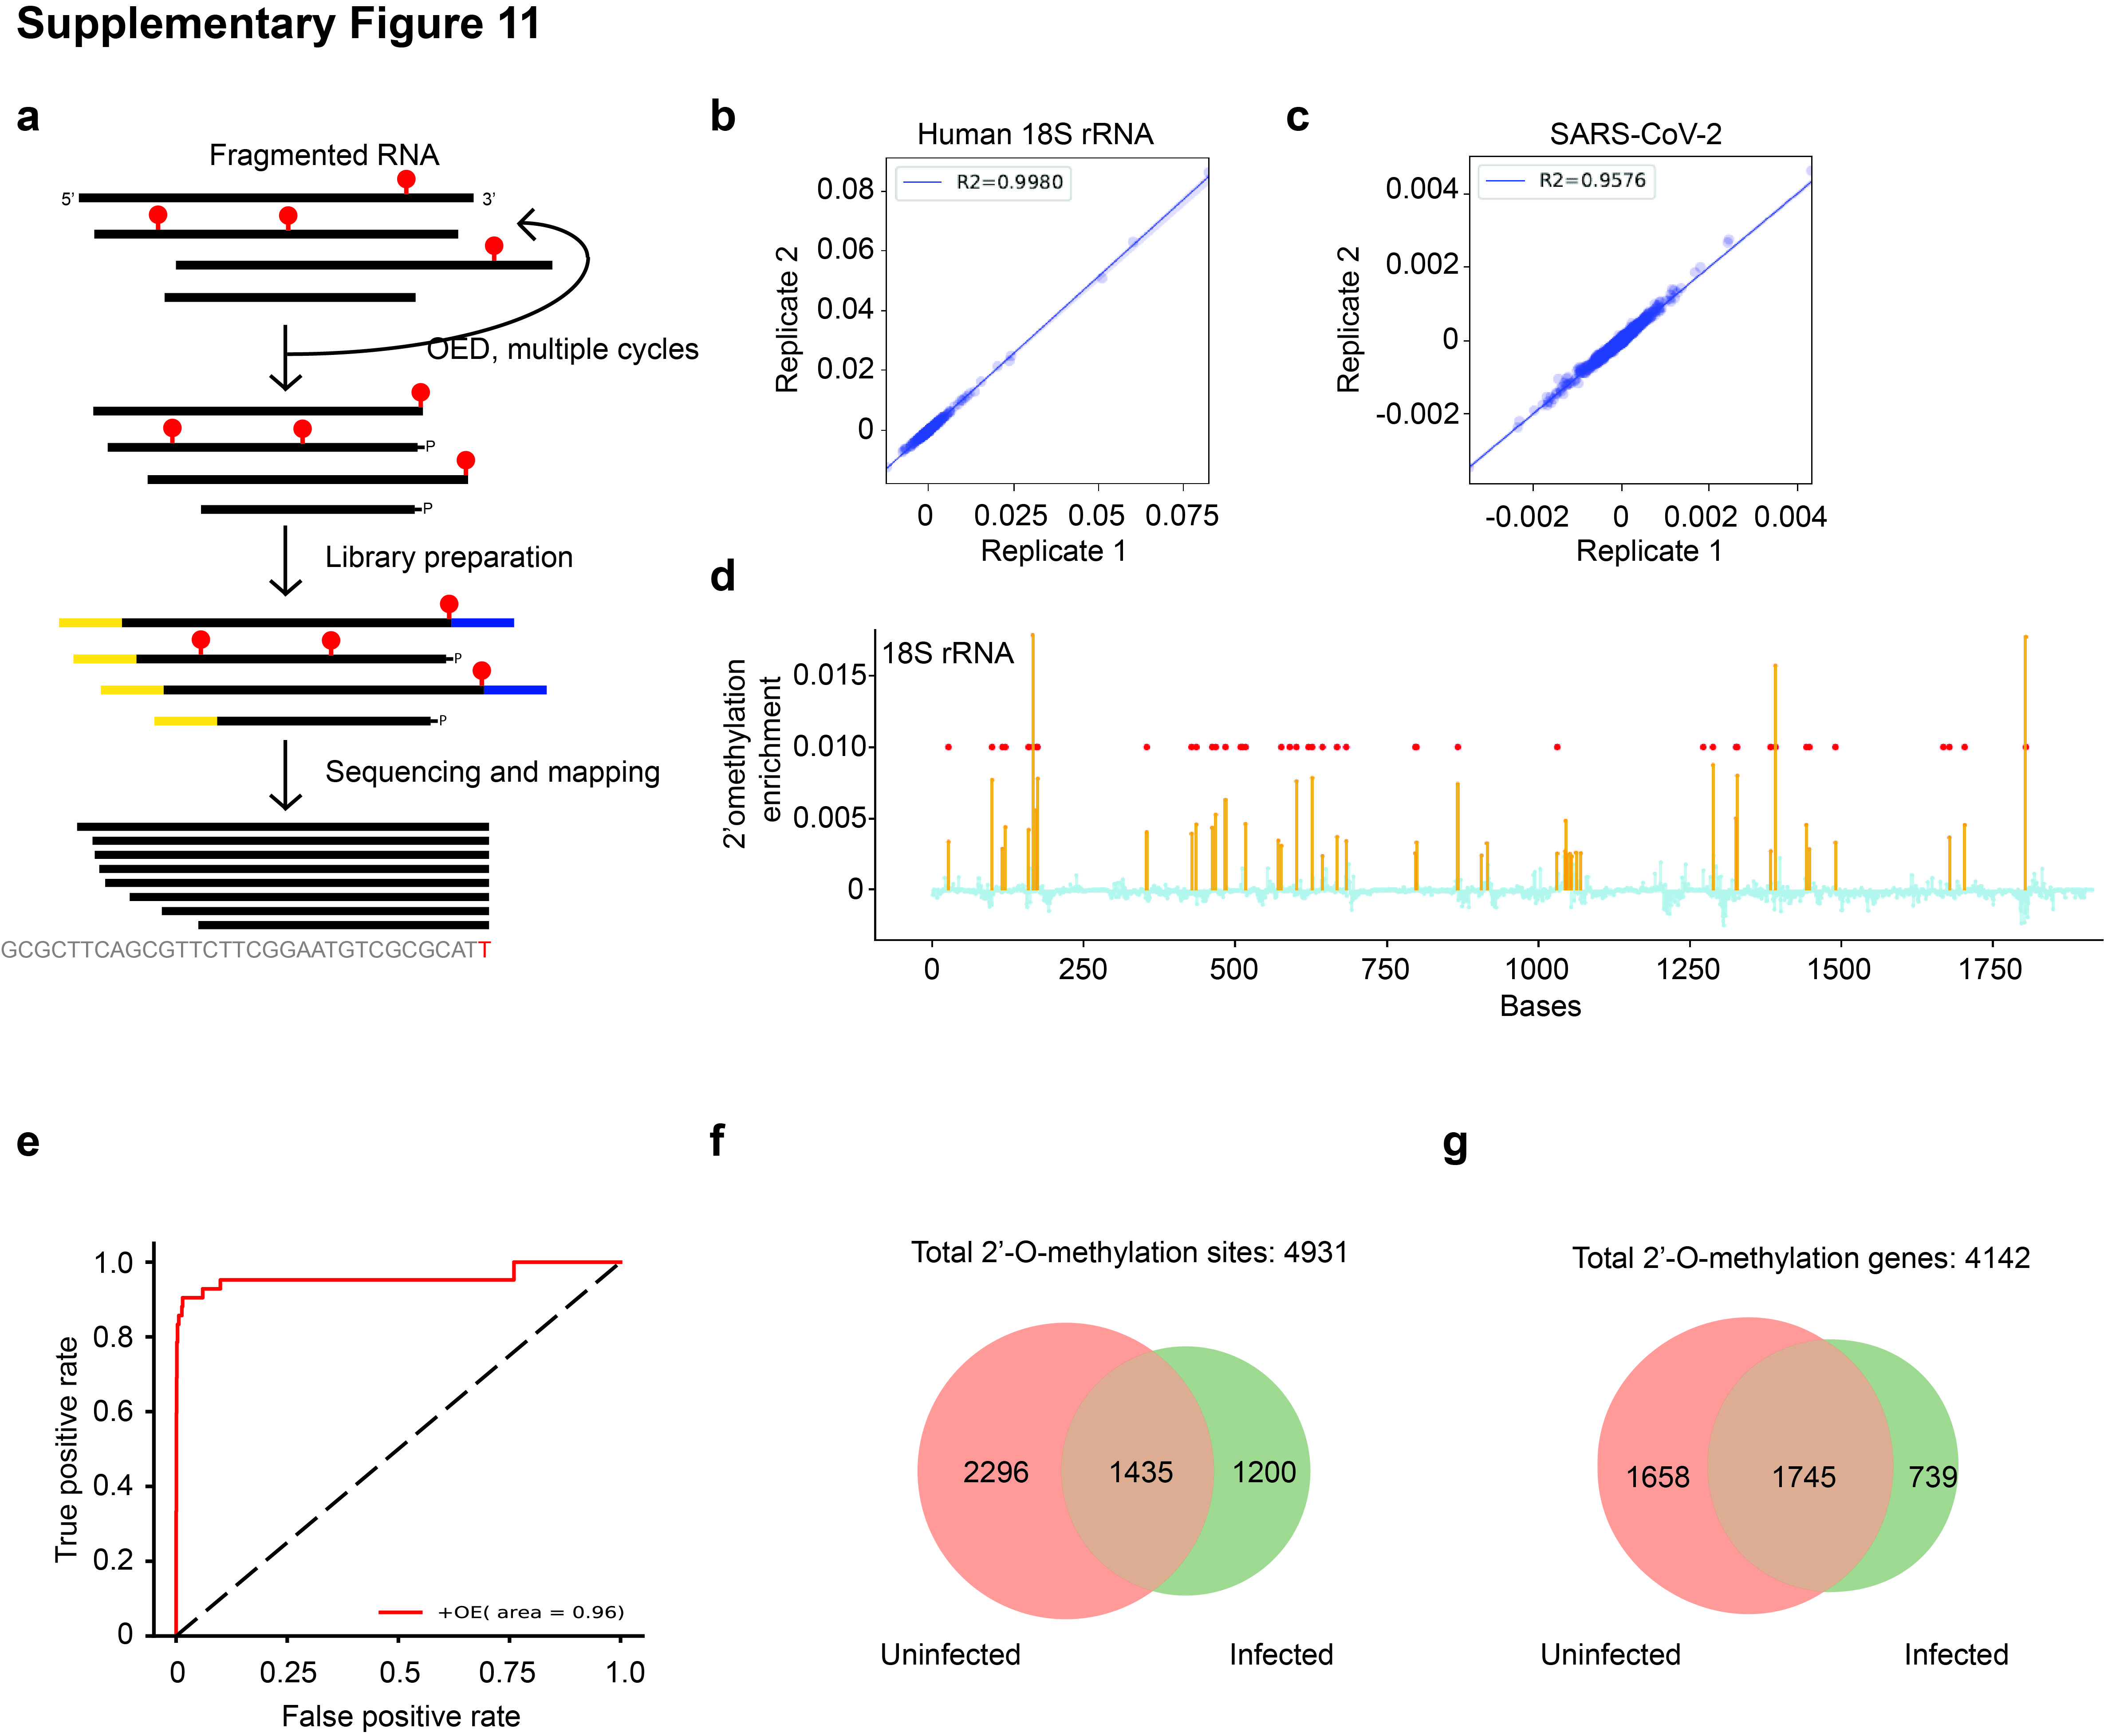
SARS-CoV-2 RNA binds to SNORD27 and is 2’-O-methylated.
SNORD27 is one of the strongest host interaction partners for SARS-CoV-2 RNA (Figure 6a) and is traditionally known to guide 2’-O-methylation of 18S ribosomal RNA42. As snoRNAs can bind and methylate cellular RNAs43, and methylation enzymes including fibrillarin (FBL), rRNA methyltransferase 2 and 3 (MRM2 and MRM3) have been found to be physically associated with SARS-CoV-2 genome23, we tested whether SARS-CoV-2 RNA could be 2’-O-methylated and whether host RNAs’ methylation levels are changed upon virus infection. We performed 2 biological replicates of Nm-seq on total RNA from Hela cells, as well as from uninfected and SARS-CoV-2 infected Vero-E6 cells (Supp. Figure 11a, Supp. Tables 8,9, Methods)44. Biological replicates of Nm-seq from both cell types show that they are well correlated, suggesting that Nm-seq data is reproducible (Supp. Figure 11b,c). Nm-seq analysis on human 18S rRNA accurately identified 36 out of 42 known 2’-O-methylation sites and had a high AUC-ROC curve of 0.96, suggesting that we are able to detect existing 2’-O-methylation sites accurately and sensitively (Supp. Figure 11d,e).
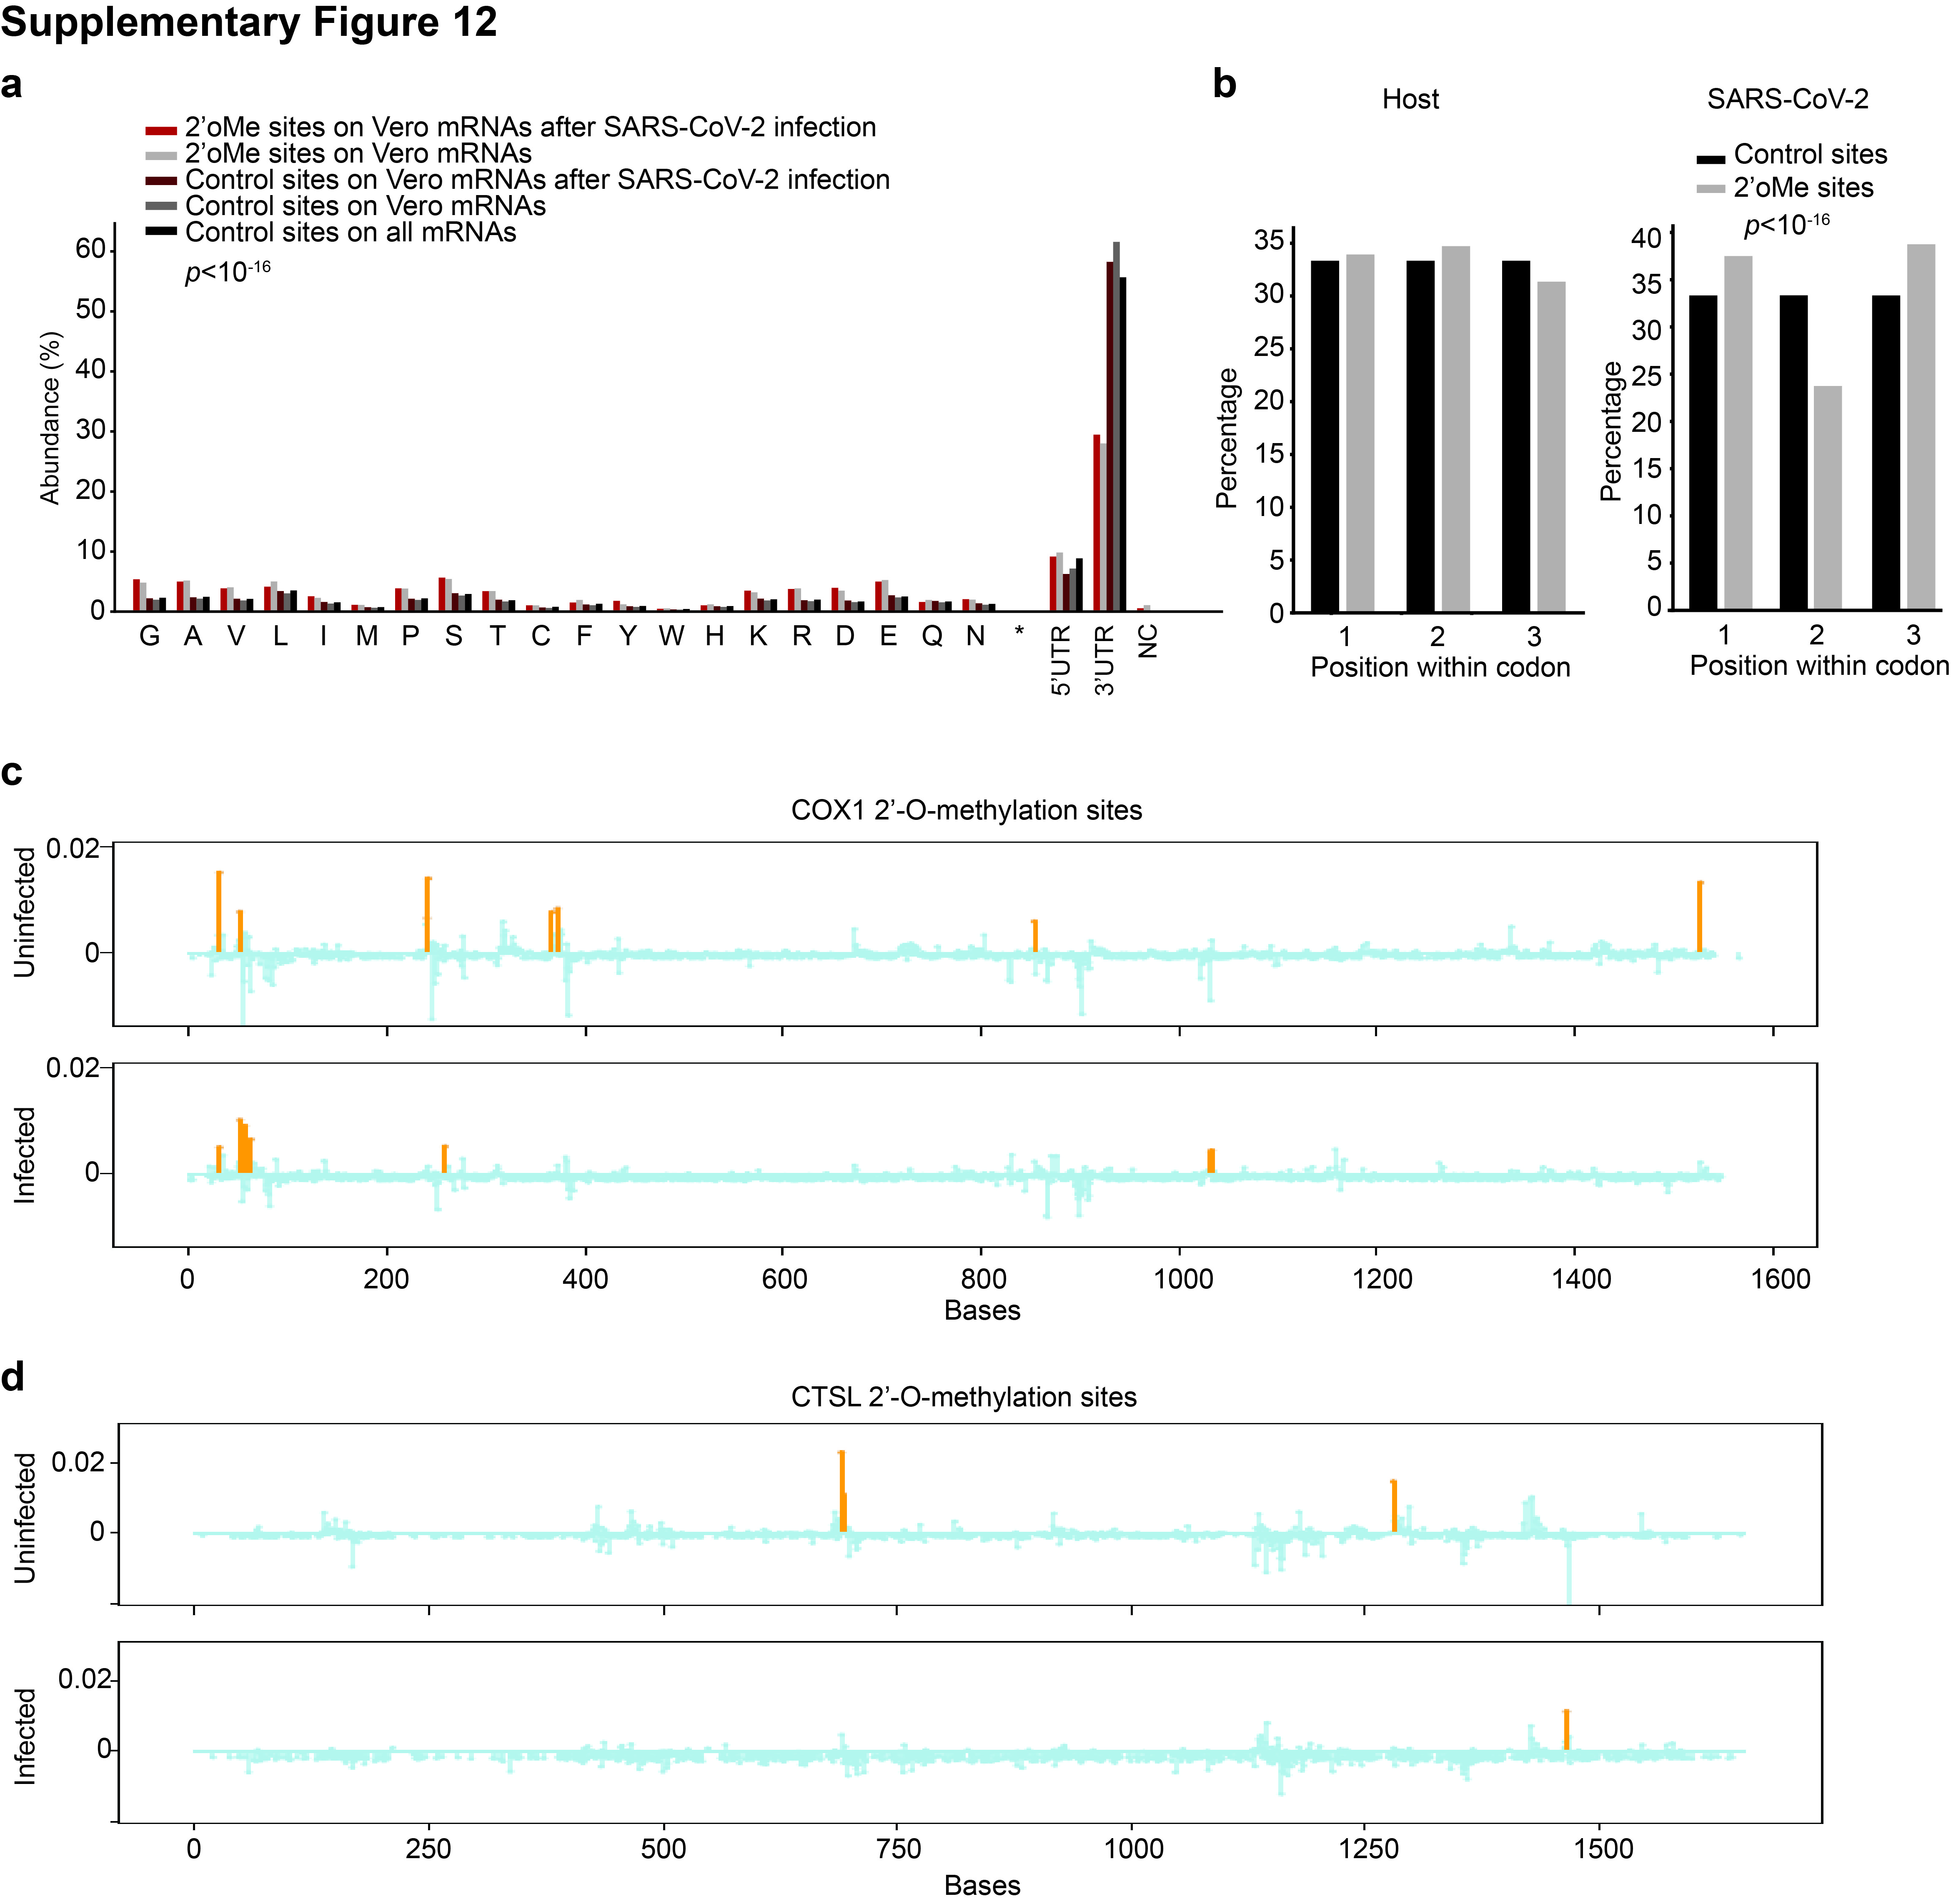
Using Nm-seq, we identified a total of 130 2’-O-methylation sites in SARS-CoV-2 genome (Figure 6b), and 4,931 sites in 4,142 transcripts in the Vero transcriptome (Supp. Figure 11f,g). We observed that a 2’-O-methylated host mRNA contains approximately 1.1 modifications per transcript in the Vero transcriptome, similar to methylated RNAs in Hela cells44. The majority of these host modification sites (60%) were located in the coding regions and were enriched for codons encoding charged amino acids (Supp. Figure 12a), as previously described44. In comparison, SARS-CoV-2 genome is 19X more modified than host mRNAs after normalizing for transcript length (Figure 6c). The 2’-O-methylations are enriched in the 5’ and 3’UTRs of SARS-CoV-2 (Figure 6d), depleted in position 2 of codons (Supp. Figure 12b), and are enriched for U and depleted for G bases along the genome (Figure 6e). 2’-O-methylation sites on SARS-CoV-2 are also associated with high SPLASH reads, indicating that they are located near positions with abundant intramolecular pair-wise interactions (Figure 6f).
As the modification of SARS-CoV-2 genome might sequester corresponding RNA modification enzymes away from the host transcriptome, we calculated the changes in modification rates in the host RNAs in the presence and absence of SARS-CoV-2 infection. We observed a decrease in host RNA 2’-O-methylation frequency upon virus infection, supporting our hypothesis that they become less methylated (Figure 6g). In addition, we also observed that host RNAs that interact strongly with SARS-CoV-2 genome show greater 2’-O-methylation changes, and show large losses and gains in modification sites within the RNAs (Figure 6h,i, Supp. Figure 12c). We hypothesized that RNAs interacting with SARS-CoV-2 genome could be methylated near their interacting regions, presumably due to proximity to SNORD27, while methylation sites that are located far away could be lost. To determine whether 2’-O-methylation sites on SARS-CoV-2 genome interacting RNAs are closer to the locations of virus-RNA interactions regions, we calculated the closest distance between virus-host interaction to host 2’-O-methylation site. We observed that sites that had 2’-O-methylation were indeed closer to virus-host RNA interactions sites (Figure 6j), supporting the hypothesis that proximity to SARS-CoV-2 genome might allow interacting RNAs to be methylated together within a hub.
2’-O-methylation has been shown to stabilize RNA gene expression inside cells43. Therefore, we hypothesized that the loss of 2’-O-methylation on host RNA upon virus infection may facilitate host RNA decay. Indeed, we observed that the abundance of host RNAs that show a decrease in methylation sites was significantly decreased in infected cells. In contrast, the abundance of host RNAs that show an increase in methylation sites was increased (Figure 6k). Thus, together with the production of NSP-1 from SARS-CoV-2 to cleave cellular RNAs, the binding of SARS-CoV-2 RNAs to SNORD27 could serve as part of a multi-prong mechanism to degrade cellular RNAs and maximize virus replication (Figure 6l)45.