Genotyping of msp1 and msp2
Of 162 samples, 151 were successfully genotyped: 25 from Moroni, 49 from Mitsamiouli, and 77 from Mbeni. Among them, 21 individual alleles were found, including 12 alleles for msp1 gene and 9 alleles for msp2 gene.
For msp1, 7 K1 type alleles (150–300 bp), 3 MAD20 type alleles (190–230 bp), and 2 RO33 type alleles (150 and 200 bp) were observed (Fig. 2). The most frequent K1, RO33, and MAD20 type alleles were 200 bp (60/132), 150 bp (17/18), and 200 bp (34/64) fragments, respectively. For msp2, 3 FC27 type alleles (350–450 bp) and 6 IC3D7 type alleles (450–700 bp) were obtained. For FC27, the most frequent type allele was 400 bp fragment, and the most frequent type allele for IC3D7 was 500 bp fragment (Fig. 3).
In all three sites, the K1 family was predominant (55%) for msp1 gene (Table 1). It was more frequent in Mbeni (71.1%) compared to Moroni (50%; p = 0.059) and Mitsamiouli (30.6%; p < 0.01) (Fig. 4). There was no significant difference of K1 frequency between Moroni and Mitsamiouli (p > 0.05). However, MAD20 msp1 allelic family was a sensibly high more frequently observed in Mitsamiouli (22.4%) than in Moroni (19.2%; p = 1) or Mbeni (9.6%; p = 0.29). RO33 msp1 allelic family was poorly represented (2.4–4.0%) in all three sites.
For msp2 gene, IC3D7 allelic family was predominant in Moroni (65%). Its frequency was lower in both Mitsamiouli (39%; p = 0.80) and Mbeni (31.6%; p = 0.36). The FC27 family was found to be predominant in Mbeni (60.5%), in comparison to Moroni (20%; p < 0.01) and Mitsamiouli (36%; p = 0.019).
In Moroni, a total of 10 (40%) samples showed polyclonal infection with at least two clones, resulting in mean MOI of 1.40 (Table 2). In Mitsamiouli, 26 (53%) samples showed polyclonal infections with at least two clones (MOI=1.57) and in Mbeni 26 (33.8%) samples were polyclonal (MOI=1.35). There was no significant difference in MOI between Moroni and Mitsamiouli (p = 0.30). In Mbeni, 26 (33.8%) samples were polyclonal, and mean MOI was 1.35. The difference in MOI was not significant between Mbeni and Mitsamiouli (p = 0.06) and between Moroni and Mbeni (p = 0.67).
Genotyping of SNPs
In this study, 50 of 151 (33%) samples were genotyped for 24 SNP markers. Among these, 42 samples (1 from Moroni, 17 from Mitsamiouli, and 24 from Mbeni) and 21 SNPs yielded interpretable results (Additional file 1: Table S1). These 42 samples were used for analysis by SNPs. Considering the similar level of genetic diversity included in this sub-sample (He=0.82) and in all 151 samples (He=0.83) based on msp genes, the representativeness of our sub-sample was confirmed.
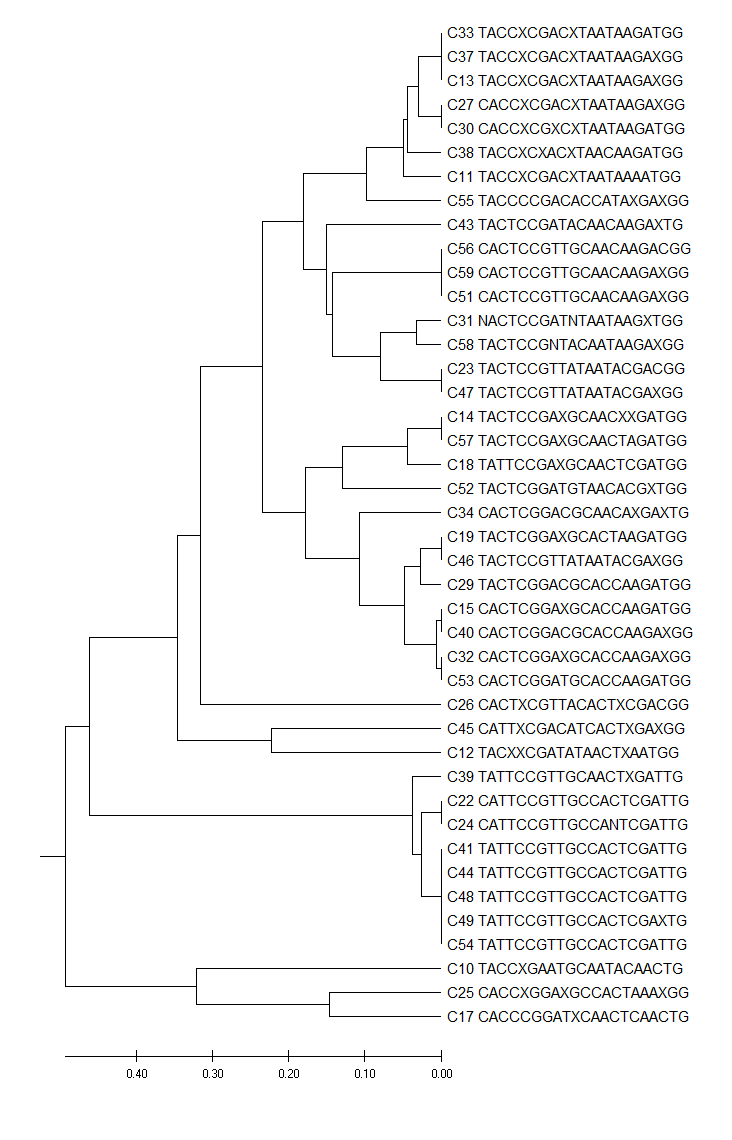
Overall, 36 of 42 (85.7%) different genotypes were obtained from 42 samples. Six of 42 (14.3%) isolates grouped into two clusters, defined as a group of parasites with identical SNP barcode: one cluster consisting of 2/42 (4.8%) parasite populations from Mitsamiouli (defined by the barcode TACCXCGACXTAATAAGAXGG; “X” denotes an absence of amplification) and another cluster consisting of 4/42 (9.5%) samples from Mbeni (defined by the barcode TATTCCGTTGCCACTCGATTG). Moreover, among 36 genetically unique isolates, several had a strong linkage since they only differed from each other by a few nucleotides (Additional file 2: Figure S1).
To investigate whether there is an association between barcode and msp1 and/or msp2 (clonality), SNPs (clusters and unique barcodes) were classified as monoclonal or polyclonal. Analysis showed that all clusters were polyclonal. Among the parasites with unique barcodes, 7 of 36 (19.4%) were monoclonal, and 29 of 36 (80.6 %) were polyclonal.
Allelic frequency
Data on allelic frequency showed that several nucleotides predominated at the study sites. At P2 position, adenine (A) number predominated at all sites. At P5 position, cytosine (C) number predominated. At positions P21 and P24, adenine (A) and guanine (G) numbers were seen in the majority of isolates collected in Mitsamiouli and Moroni, respectively. The lowest minority allelic frequency (MAF) was found in position 20 in 5 of 42 (11.9%) isolates calculated from guanine number (Additional file: Table S1).
Genetic diversity
Genetic diversity (He) was estimated from msp and SNPs. For msp genes, the highest mean diversity was observed in Moroni and Mitsamiouli (He = 0.84 in both sites) (Table 3). There was no significant difference between Moroni and Mbeni (p = 0.48). The mean genetic diversity for all sites was 0.83 (Table 3). For SNPs, He was determined at Mitsamiouli and Mbeni. The highest genetic diversity was found at Mitsamiouli (He = 1) and the lowest at Mbeni (He = 0.41).
In addition, He values based on msp and SNP were compared in both sites using Fisher's exact test. The He index based on msp gene was higher than the index based on SNP in Mbeni (p < 0.01), but an opposite but insignificant trend was observed in Mitsamouili (p = 0.08). Comparison in the whole populations did not show any difference (p=0.9) (Table 4).
