Transcriptome sequencing and read mapping
High-throughput transcriptome sequencing was used to study and compare the transcript differences in natural allotetraploid B. napus relative to its diploid progenitors. The RNA samples from stems, leaves, flowers, and siliques of B. napus and its diploid progenitors (Figure 1) were subjected to paired-end RNA sequencing, each with three biological replicates. After filtering and quality control of the raw reads, a total of 1529.93 million (M) clean reads from 36 RNA libraries were obtained (approximately 42.5 M reads per library, Table 1). An average of 85.5%, 63.9%, and 63.7% of the reads from the samples of B. rapa, B. oleracea, and B. napus were uniquely mapped to the A genome [47], the C genome [46], and the integrated A-C genome, respectively (Table 1). Gene expression correlations between the three biological replicates were high, and the Pearson correlation coefficient (R) between them mostly exceeded 0.9 (Figure 2). The transcripts per million reads (TPM) method were used to normalize the gene expression levels, and if the value of TPM was greater than 0, the gene was considered to be expressed in our study. The specific statistics of expressed gene numbers in all samples are shown in Table 2. In total, 41,914, 32,204 and 73,012 genes were detected to be expressed in the four tissues of B. rapa, B. oleracea and B. napus, respectively. Among the 73,012 genes expressed in B. napus, 40,831 genes were derived from the A subgenome, and 32,181 genes were derived from the C subgenome.
Differentially expressed genes (DEGs) between B. napus and its diploid progenitors
To study the differences in gene expression between natural allotetraploid B. napus (AnAnCnCn) and its diploid progenitors (ArAr and CoCo), all DEGs in stems, leaves, flowers, and siliques were identified using DESeq2, with and padj ≤ 0.001. Compared with diploid progenitors B. rapa, a total of 17,463 DEGs were identified in four tissues, including 10,084 in stems, 6,614 in leaves, 8,557 in flowers and 8,246 in siliques (Figure 3). Compared with diploid progenitors B. oleracea, 11,930 DEGs were identified in four tissues, including 5,233 in stems, 5,025 in leaves, 6,708 in flowers and 5,122 in siliques (Figure 3). In total, the DEGs between allotetraploid B. napus and B. rapa were approximately 1.5 times that between B. napus and B. oleracea; among these, the most different tissue was stems, and the DEGs were approximately 1.9 times. In allotetraploid B. napus, more DEGs from both A and C subgenomes were downregulated relative to those in its two diploid progenitors, and an average of 53% (9,266 of 17,463) and 52.9% (6,312 of 11,930) of DEGs in the A and C subgenomes were downregulated, respectively (Figure 3).
Functional classifications of the DEGs
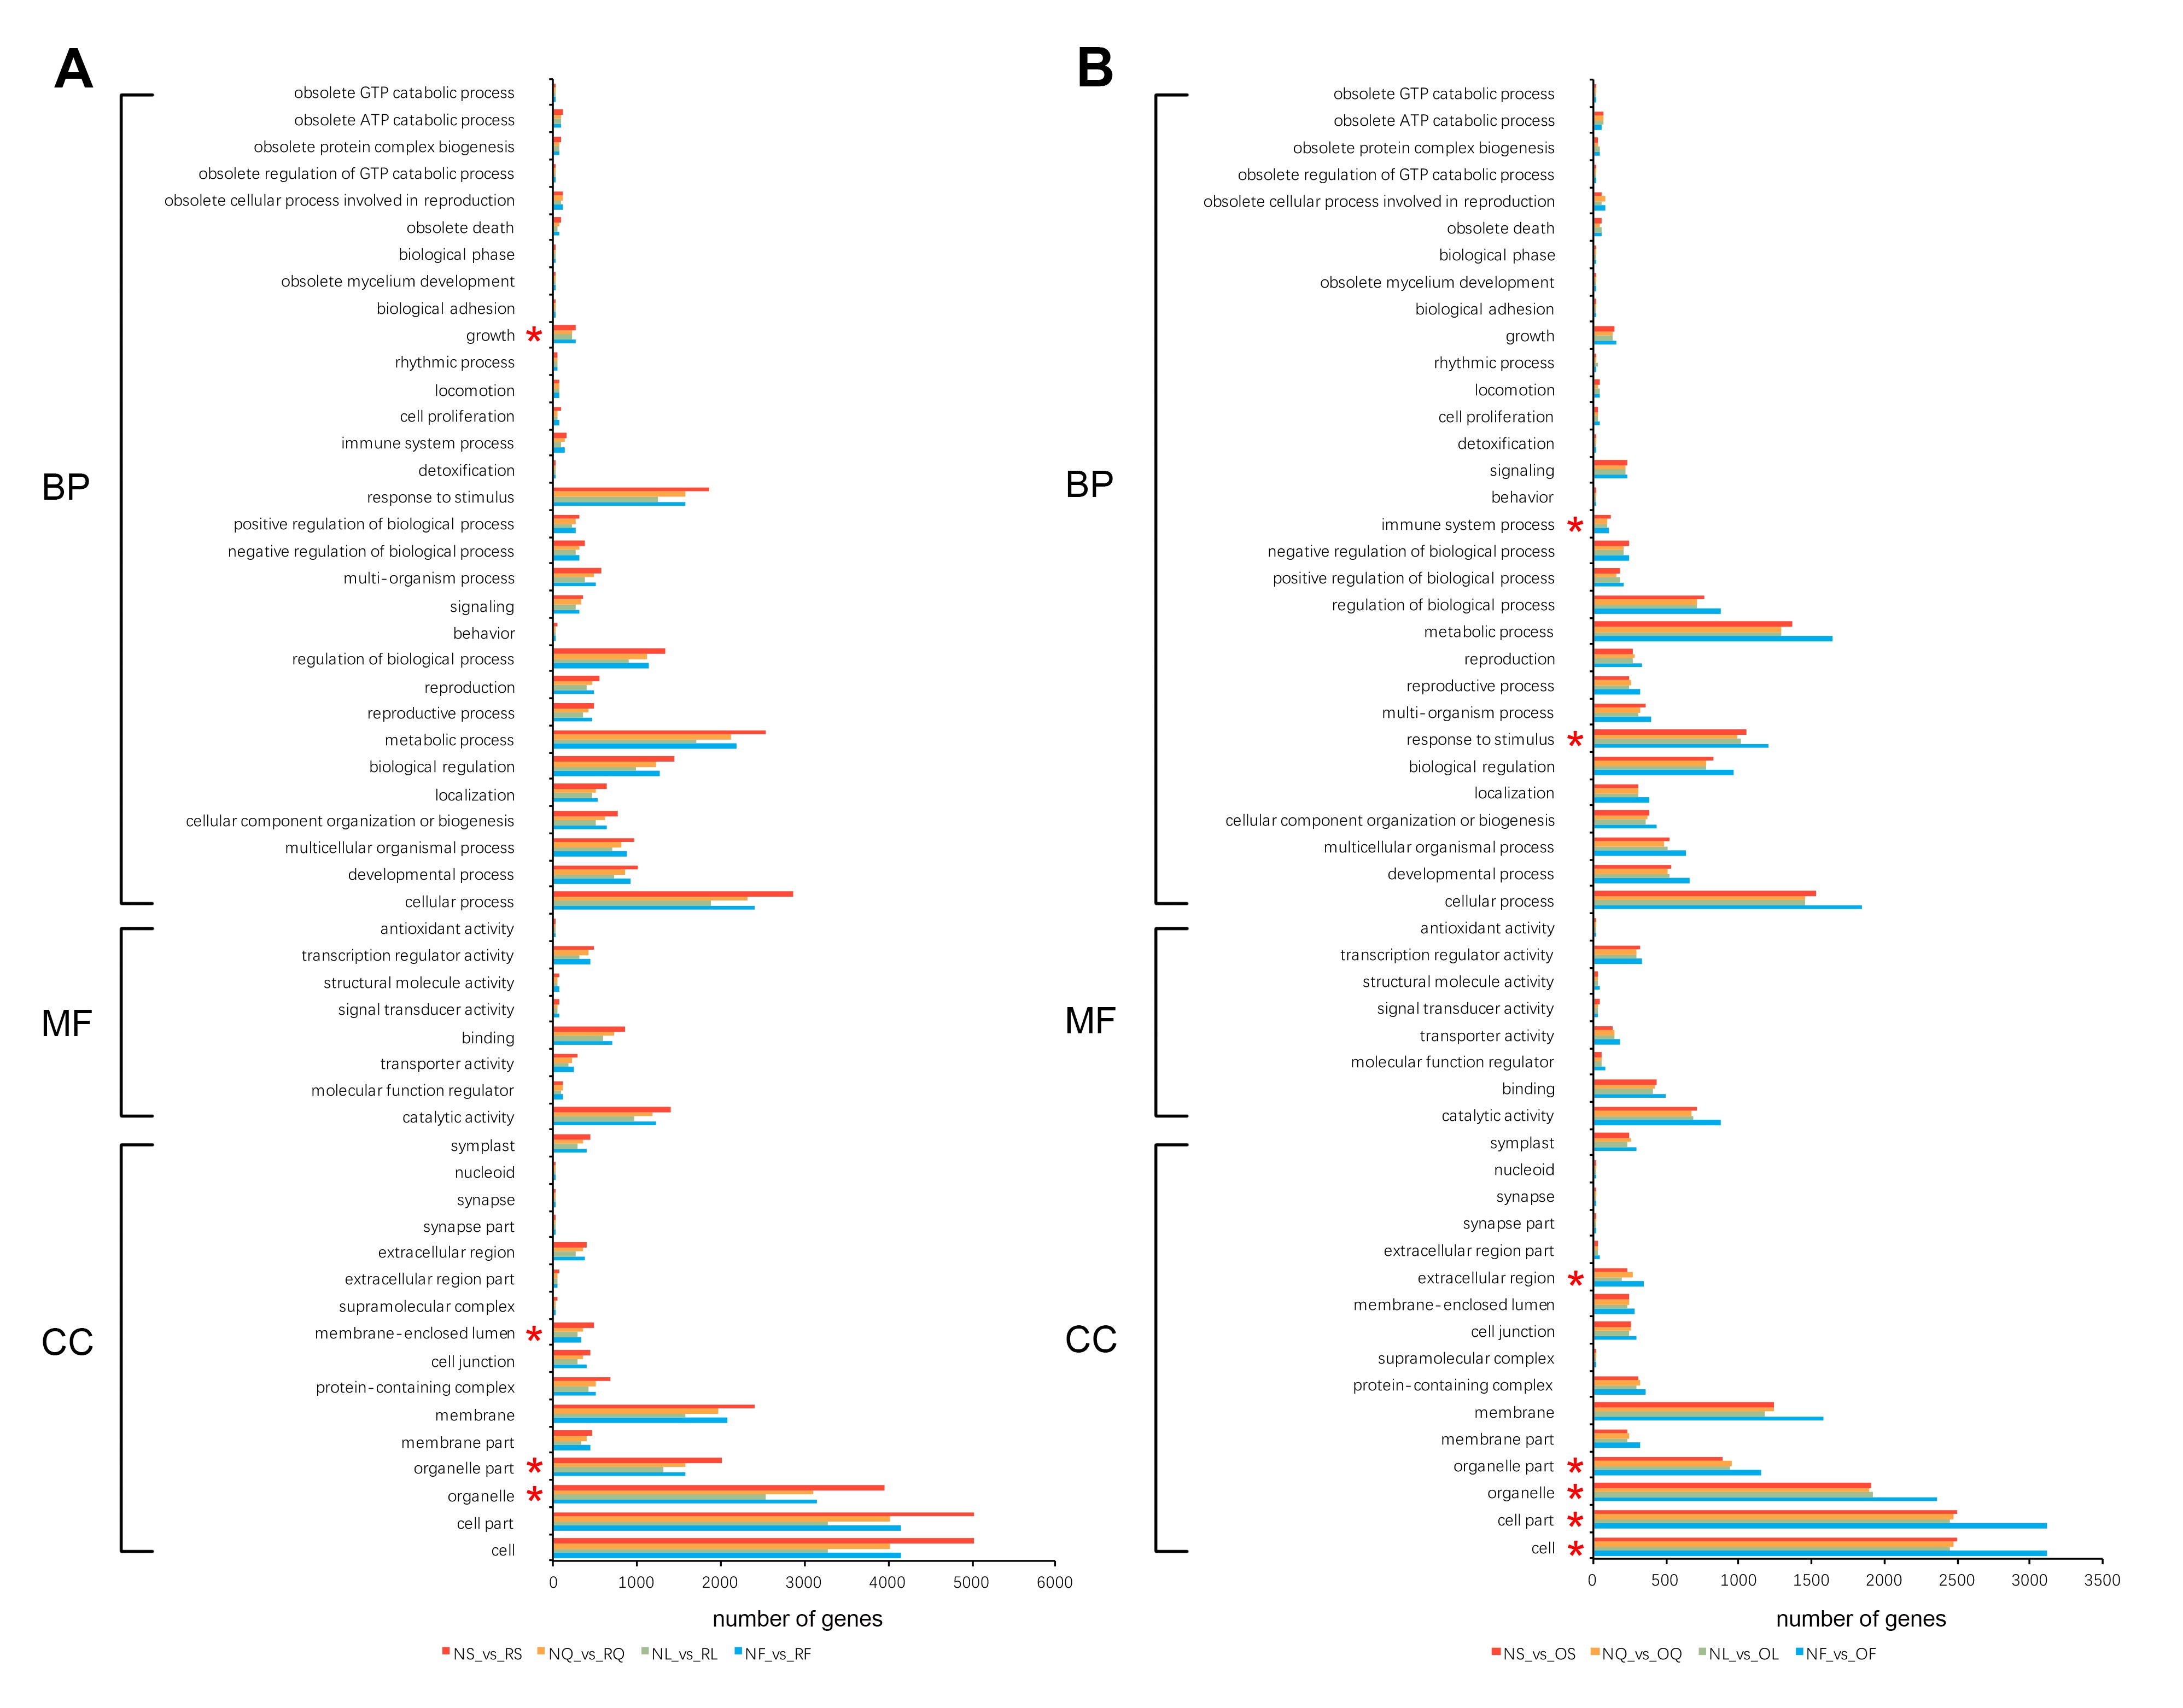
To further explore the gene functional differences between B. napus and its two diploid progenitors in four selected tissues, all genes from the A and C genomes were functionally annotated using eggNOG-mapper (Huerta-Cepas et al. 2017). A total of 91% (42,103 of 46,250) and 91.8% (42,017 of 45,758) of the genes from the A and C genomes, respectively, were annotated. Moreover, 54.8% (23,083 of 42,103) and 57.4% (24,102 of 42,017) of the genes from the A and C genomes were annotated to at least one GO term, respectively. Then, the GO functional categories of all DEGs between B. napus and its diploid progenitors were investigated using GO functional classification analysis (WEGO). A total of 55 enriched GO terms were identified among DEGs, including three categories: biological process (31 GO terms), molecular function (8 GO terms), and cellular component (16 GO terms) (Figure S1). In the DEGs between B. napus and the diploid progenitors B. rapa, there were four significant enrichment GO level 2 terms, including growth (GO:0040007), membrane-enclosed lumen (GO:0031974), membrane part (GO:0044425), and organelle part (GO:0044422) (Figure S1). While in the DEGs between B. napus and B. oleracea, there were seven significant enrichment GO level 2 terms, such as immune system process (GO:0002376), response to stimulus (GO:0050896), extracellular region (GO:0005576), and organelle part (GO:0044422) (Figure S1). In addition, in order to obtain more useful information, the GO enrichment analysis of up-/downregulated DEGs between B. napus and its two diploid progenitors was performed separately (Table S1). The upregulated DEGs between B. napus and the diploid progenitors B. rapa were significantly enriched to the largest number (22) of GO items (Table S1). Only upregulated DEGs between B. napus and B. rapa were significantly enriched the largest number of GO items in category biological process, while the other three groups of DEGs (including downregulated DEGs between B. napus and B. rapa and up-/downregulated DEGs between B. napus and B. oleracea) all significantly enriched the largest number of GO items in category cellular component (Table S1). These results showed that the upregulated DEGs might play an important role in biological process (such as developmental process and multicellular organismal process), while the downregulated DEGs might play a critical role in cellular component (such as cell part, organelle part and membrane) in the DEGs between B. napus and the diploid progenitors B. rapa. However, both upregulated and downregulated DEGs might play a major role in cellular component (such as such as cell part, organelle part and cell junction) in the DEGs between B. napus and the diploid progenitors B. oleracea.
KEGG analysis of the DEGs
To identify the metabolic or signal transduction pathways involved in DEGs, all DEGs were mapped to reference pathways in the KEGG database. A total of 12 pathways were significantly enriched (qvalue ≤ 0.05) in DEGs between B. napus and its diploid progenitors B. rapa, such as photosynthesis (ko00195), pentose phosphate pathway (ko00030), and circadian rhythm-plant (ko04712). However, only 4 pathways were significantly enriched in DEGs between B. napus and B. oleracea, including plant-pathogen interaction (ko04626), photosynthesis (ko00195), photosynthesis-antenna proteins (ko00196), and carbon fixation in photosynthetic organisms (ko00710). Three pathways related to photosynthesis (ko00195, ko00196, ko00710) were enriched in both comparison groups (AnAnCnCn vs ArAr and AnAnCnCn vs CoCo). Statistics showed that these three pathways were downregulated in all four tissues of B. napus relative to its diploid progenitors, suggesting that the photosynthesis of natural B. napus might not be as active as that of its two diploid progenitors, which still needs to be verified by follow-up experiments. It was obvious that DEGs between B. napus and its diploid progenitors were involved in many plant physiological processes, and these DEGs may also be involved in plant morphogenesis, which may provide evidence for the morphological differences in the stems, leaves, flowers and siliques of B. napus and its diploid progenitors (Figure 1). The specific statistics of KEGG enrichment in every comparison group are shown in Table S2. Moreover, the sum of the TPM values of the differential genes involved in each KEGG pathway was calculated, and the top 5 up- and downregulated pathways are shown in Table S3.
Homoeolog expression bias in natural allotetraploid B. napus
Previous studies have shown that the duplicated gene pairs in allotetraploids might display homoeolog expression bias, where bias refers to the preferential and high expression of one homoeolog relative to the other homoeolog [14, 48-50]. To study the homoeolog expression bias in the natural allotetraploid B. napus, the expression levels of 27609 homologous gene pairs from B. rapa and B. oleracea were analyzed. These homologous gene pairs were obtained using a perl script. Then, DESeq2 was used to analyze whether there were expression differences between these gene pairs. Homologous gene pairs that met the condition of and padj ≤ 0.001 were considered to be differentially expressed gene pairs. Compared with the diploid progenitors, the homologous gene pairs between the two subgenomes of B. napus were divided into three categories, including the parental condition, no bias, and novel bias in progeny (Figure 4). As shown in Figure 4, the overwhelming majority of gene pairs (an average of 86.7%) from the two subgenomes of natural allotetraploid B. napus maintained their expression pattern in two diploid progenitors, and this feature was most obvious in leaves (92%) and least obvious in flowers (82.2%). Moreover, an average of 4% gene pairs that already had expression bias in the two diploid progenitors reverted to no bias expression in B. napus, and only 0.8% homologous gene pairs in leaves of B. napus had this reversion (Figure 4). In addition, an average of 9.2% homologous gene pairs displayed novel bias in B. napus, and this phenomenon was most common in flowers (13.6%). According to the statistics on the number of gene pairs with A-/C-bias or no bias expression in allotetraploid, 78.1%, 15.4% and 6.5% of the homologous gene pairs showed A-bias, C-bias and no bias expression, respectively (Figure 4). This result seems to indicate that a highly unbalanced biased expression was observed in the natural allotetraploid B. napus, which had a preference toward the A subgenome (A-bias vs C-bias = 78.1% vs 15.4%). However, further analysis showed that this is simply a parental legacy. In detail, the number of gene pairs in two diploid progenitors were also counted, and 78%, 15.5% and 6.6% of the orthologous gene pairs showed A > C, A < C and A = C in gene expression, respectively (Figure 4).
Expression level dominance (ELD) in the natural allotetraploid B. napus
In addition to homoeolog expression bias in gene pairs, ELD has been frequently described in studies of allopolyploids. Homoeolog expression bias mainly focused on the relative expression levels of the individual homologs, whereas ELD primarily focused on the total expression levels of homologous gene pairs in allopolyploids compared to their relative expression levels in its two parents [14, 48, 50-52]. To study additivity, transgressive expression and ELD in the four tissues of the natural allotetraploid B. napus, the homologous gene pairs were classified into 12 categories by comparing the total expression levels of the gene pairs in B. napus relative to its two diploid progenitors [48]. Overall, an average of 48% homologous gene pairs exhibited additivity expression (categories I and XII), and the remaining 29.7% and 22.3% of gene pairs showed ELD (categories II, XI, IV and IX) and transgressive expression (categories III, VII, X, V, VI and VIII), respectively, in natural allotetraploid B. napus (Figure 5). More A-expression level dominance (ELD-A) homologous gene pairs (categories IV and IX with an average of 15.7%) were observed in B. napus than C-expression level dominance (ELD-C) gene pairs (categories II and XI with an average of 14%, Figure 5). Therefore, the expression of gene pairs in the natural allotetraploid B. napus displayed ELD bias toward B. rapa. In addition, more gene pairs showed obvious transgressive upregulation expression (categories V, VI and VIII with an average of 17.6%) rather than downregulation (categories III, VII and X with an average of 4.7%, Figure 5).
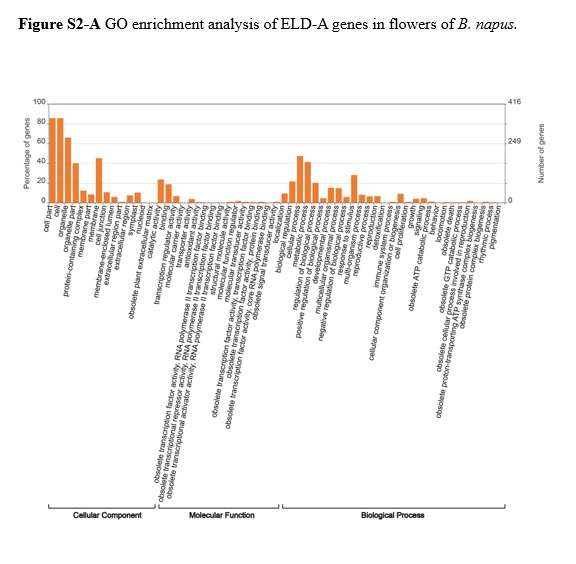
Homologous gene pairs that exhibited additivity expression were the most abundant in leaves (68.9%) and the least abundant in flowers (34%). Gene pairs showed more ELD-A than ELD-C in stems and siliques (13% ELD-A vs 10.8% ELD-C in stems and 25% ELD-A vs 17.6% ELD-C in siliques), while gene pairs displayed more ELD-C than ELD-A in leaves and flowers (3.6% ELD-A vs 5.8% ELD-C in leaves and 21.1% ELD-A vs 22% ELD-C in flowers, Figure 5). Tissues with more ELD-A genes (stems and siliques) were indeed closer to B. rapa in morphology (Figure 1) in B. napus, and it is speculated that ELD-A genes were involved in the regulation of plant tissue morphogenesis. The GO enrichment analysis of ELD-A/-C genes in each tissue is shown in Figure S2, and the results indicated that they were mainly enriched in two parts (cellular component and biological process). In addition, the proportion of gene pairs with transgressive upregulation expression was higher than that of gene pairs with downregulation in all four tissues of B. napus.
Relationship between individual homoeolog expression level and ELD
Individual homoeolog expression levels in four tissues of B. napus relative to diploid progenitors were investigated to explain the ELD phenomenon. More modifications were observed in the A homoeolog (88, 16, 293, and 169 genes in stems, leaves, flowers, and siliques, respectively) than the C homoeolog (58, 13, 185, and 125 genes) (Table 3). The dominant progenitor has a higher expression level than the nondominant progenitor in categories II and IV (Figure 5), and these findings could be explained by the upregulation of at least one homolog from dominant or nondominant progenitor (Figure 6A and 6C, Table 3). In contrast, the dominant progenitor has a lower expression level than the nondominant progenitor in categories XI and IX (Figure 5), and these findings could be explained by the downregulation of at least one homolog from dominant or nondominant progenitor (Figure 6B and 6D, Table 3). Statistics showed that the up-/downregulation of homologs from nondominant progenitors always exceeded the homologs from dominant progenitors, except for category IX in flowers (Table 3).