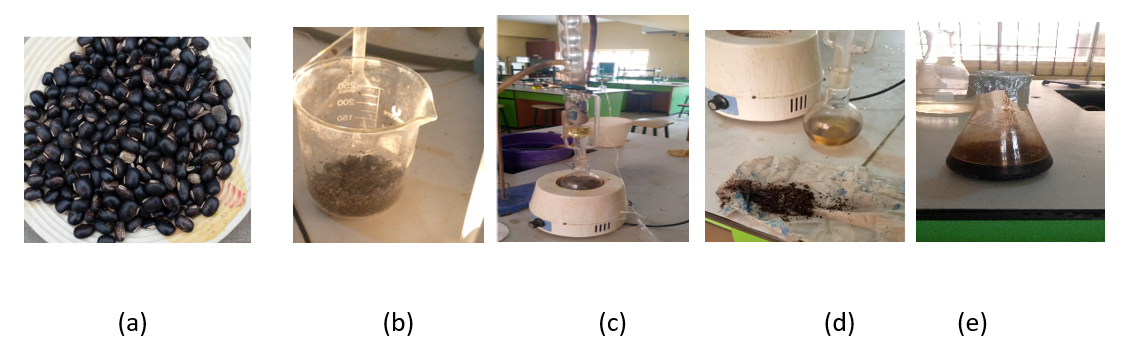
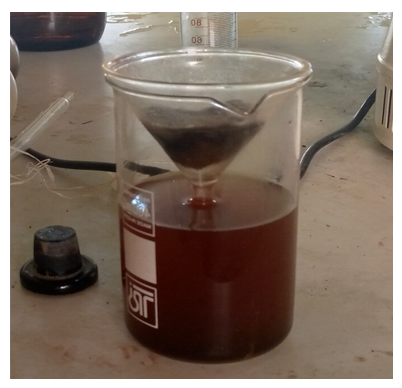
The three parametric variables—solvent to solid ratio (A), temperature (B), and time (C)—were each represented by a level, with low level (-1), medium level (0), and high level (+ 1) being the most significant. For the extraction of the oil at solvent to solid ratio 1:40, temperature at 85.0oC for a period of 30 mins produce a oil yield of 54.84%.
• Response surface methodology (RSM)
By adjusting several variables at once and doing a small number of trials, the response surface methodology (RSM) is a useful model for examining how changes in the variables affect the response factor (the target factor (Ajemba et al., 2013).RSM, which is based on polynomial analysis, is a collection of mathematical and statistical methods used to model and analyze problems when the subject under investigation is impacted by a number of different factors. The sensitive operating factors were screened using the central composite design (CCD) of RSM in order to maximize the oil yield from velvet seed with twenty experimental runs. The three parametric variables—solvent to solid ratio (A), temperature (B), and time (C)—were each represented by a level, with low level (-1), medium level (0), and high level (+ 1) being the most significant. At the three levels of low, medium, and high, the solvent to solid ratio was 4, 6.5, and 9 correspondingly. For the three levels of low, medium, and high, the temperature is 78, 81.5, and 85 oC, respectively. The three levels of low, medium, and high for the given period were 30, 50, and 70 minutes, respectively. As shown in Table 3, the oil yield varies for all these components when combined at different experimental runs according to design expert version 12.0, ranging from 37.69 percent to 54.84 percent. The solvent to solid ratio of 1:4.0 was used at 85 oC for 30 minutes to provide the greatest oil yield of 54.84 percent. When compared to the outcome of the variable factors, the design expert projected the oil yield's ideal operating conditions. The best oil output, at 54.84 percent and 54.97 percent, was produced by using a solvent to solid ratio of 1:4.0 and 30 minutes of time at a temperature of 85oC. The actual experimental value is compared to the anticipated value in Table 4, which demonstrates that the model fits well because the difference is negligibly small.
Table 3
The Central composite Design of the Variables with oil yield as Response from velvet seed extraction
| | Factor 1 | Factor 2 | Factor 3 | Response |
|---|
| Run | A: Solvent to solid | B: Temperature | C: Time | Oil yield |
|---|
| | g/g | Deg C | mins | |
| 1 | 1:4.0 | 78.0 | 70 | 48.75 |
| 2 | 1:9.0 | 78.0 | 30 | 38.22 |
| 3 | 1:9.0 | 85.0 | 70 | 39.44 |
| 4 | 1:9.0 | 81.5 | 50 | 43.00 |
| 5 | 1:6.5 | 81.5 | 50 | 42.62 |
| 6 | 1:6.5 | 81.5 | 50 | 43.85 |
| 7 | 1:4.0 | 85.0 | 70 | 49.75 |
| 8 | 1:6.5 | 81.5 | 50 | 45.46 |
| 9 | 1:9.0 | 85.0 | 30 | 43.33 |
| 10 | 1:6.5 | 81.5 | 30 | 37.69 |
| 11 | 1:4.0 | 81.5 | 50 | 52.75 |
| 12 | 1:4.0 | 85.0 | 30 | 54.84 |
| 13 | 1:6.5 | 81.5 | 50 | 42.62 |
| 14 | 1:6.5 | 81.5 | 50 | 43.54 |
| 15 | 1:9.0 | 78.0 | 70 | 39.56 |
| 16 | 1:4.0 | 78.0 | 30 | 50.50 |
| 17 | 1:6.5 | 81.5 | 30 | 39.23 |
| 18 | 1:6.5 | 81.5 | 50 | 38.20 |
| 19 | 1:6.5 | 85.0 | 50 | 49.11 |
| 20 | 1:6.5 | 78.0 | 50 | 47.38 |
Table 4
Showing the Central Composite Design for velvet oil yield using response surface methodology
| Run Order | Responses (oil yield) |
|---|
| Actual Value | Predicted Value |
|---|
| 1 | 48.75 | 48.96 |
| 2 | 38.22 | 38.74 |
| 3 | 39.44 | 39.70 |
| 4 | 43.00 | 42.39 |
| 5 | 42.62 | 43.84 |
| 6 | 43.85 | 43.84 |
| 7 | 49.75 | 49.32 |
| 8 | 45.46 | 43.84 |
| 9 | 43.33 | 43.21 |
| 10 | 37.69 | 38.72 |
| 11 | 52.75 | 53.00 |
| 12 | 54.84 | 54.97 |
| 13 | 42.62 | 43.84 |
| 14 | 43.54 | 43.84 |
| 15 | 39.56 | 39.51 |
| 16 | 50.50 | 50.33 |
| 17 | 40.11 | 38.72 |
| 18 | 44.23 | 43.84 |
| 19 | 49.11 | 49.27 |
| 20 | 47.38 | 46.86 |
• Experimental design result
The regression model was built using the ordinary least squares method based on the experimental design results provided in Table 5 in order to identify the functional link for approximation and response prediction. In order to link the response variable (oil yield) with the design variables (A, B, and C), as stated in Table 5, a second order polynomial model was fitted to the response variable. The following are the second order RS-models (in terms of coded variables) that were obtained:
Oil yield = 43.84–5.30 A + 1.21B -1.22C- 0.0431AB + 0.5350AC -1.07BC + 3.86 A2 + 4.23 B2 − 6.33C2
• Analysis of variance (ANOVA)
In Table 5, the computed F-value is 48.07 and p-value is < 0.0001. This shows that the RS-model for response (oil yield) was significant at 95% Confidence Interval. This high F-value and very low P-value indicate the high significance of the model, showing reliability of the response surface quadratic model for predicting the oil yield from the velvet seed. In this study, A, B, C,A2, B2 and C2. are significant model terms but BC is less significant with the P-value of 0.0134 while AB, AC are not significant because it is greater than 0.05 P-value as shown in Table 5 :
Table 5
Shows the ANOVA for the quadratic model
| Source | Sum of Squares | df | "Mean Square" | F-value | p-value | |
|---|
| Model | 441.83 | 9 | 49.09 | 48.07 | < 0.0001 | significant |
| A-solvent to solid | 281.31 | 1 | 281.31 | 275.43 | < 0.0001 | |
| B-temperature | 14.55 | 1 | 14.54 | 14.24 | 0.0036 | |
| C-time | 12.55 | 1 | 12.55 | 12.29 | 0.0057 | |
| AB | 0.0148 | 1 | 0.0148 | 0.0145 | 0.9065 | Not significant |
| AC | 2.29 | 1 | 2.29 | 2.24 | 0.1652 | |
| BC | 9.17 | 1 | 9.17 | 8.98 | 0.0134 | |
| A² | 39.27 | 1 | 39.27 | 38.44 | 0.0001 | |
| B² | 47.21 | 1 | 47.21 | 46.22 | < 0.0001 | |
| C² | 97.47 | 1 | 97.47 | 95.44 | < 0.0001 | |
| Residual | 10.21 | 10 | 1.02 | | | |
| Cor Total | 452.04 | 19 | | | | |
| C.V. % | 2.25 | | | | | |
| R² | 0.9774 | | | | | |
| Adjusted R² | 0.9571 | | | | | |
The Response Surface (RS)-models' statistical significance was examined using analysis of variance (ANOVA).Table 5 displays the statistical findings and displays the ANOVA coefficients, F-value, degree of freedom, mean square, and sum of squares (SS, DOF) (i.e. coefficients of multiple determination, R2 and adjusted statistic, R2adj).The significance of the RS-models was evaluated using the Fischer distribution (F-value) and the p-value. P-values under 0.05 were regarded as significant. A high F-value and a low p-value (0.05) indicate that the models are effective at predicting the responses and are significant. Utilizing R2 and R2adj, which represent the degree of dependability between the observed values (results of the simulation) and the anticipated values, the goodness-of-fit of the RS-model is assessed. The R2 value is always between 0 and 1. The closer the R2 value to 1, the stronger the model is and the better it predicts the response (Kumari et al., 2008). Employing R2 and R2adj which indicate the extent of reliability between the observed values (simulation results) and the predicted values. The R2 value is always between 0 and 1. The values of R2 and R2adj are0.9774 and 0.9571 respectively. These values indicate that the RS-model is statistically significant. Furthermore,(Kumari et al., 2008), reported that the closer the R2 value to 1 the stronger the model is and the better it predicts the response. The fitted model can be used to forecast the ideal operating state for the oil extract from velvet seed since the value of R2 (0.9774) shows that there is a high degree of reliability between the observed values (the results of the simulation) and the anticipated values. Figure 1 shows the quadrate RS-goodness-of-fit models for the response. This graph demonstrates that the projected values and actual values of the variables do not differ by much. The extremely low coefficient of variation (C.V.) of 2.25 percent, as shown in Table 5, indicates that the new fitted model's simulation results are more accurate and reliable.
• Optimization of the 3D Plot from RS model
The displays in Figs. 2, 3, and 4 are examples of three-dimensional (3D) response surface plots. These graphs demonstrate the effects that the parametric variables solvent to solid ratio, temperature, and time are projected to have on the reactions (oil yield). To identify the ideal value of the variables inside the design space, 3D plots are the graphical depiction of the regression equations. Combinations of AB, BC, and AC were the process variables' ideal values.The best optimal oil yield for AB was 54.82 percent, as shown in Fig. 2, at 82°C and a solvent to solid ratio of 1:9.According to Fig. 3, the oil yield for AC was 45 percent and the lower oil yield was 34.95 percent at a solid to solvent ratio of 1:6.5 and a period (C) of 50 minutes. The oil output of the velvet seed is 52.4 percent in the base case design.
These findings demonstrate that the best-case scenarios from the aforementioned response surface methodology (RSM) resulted in an improvement in oil yield of 37.69% for the AC combination and 54.84% for the AC combination. Figure 4 show three points above the surface of BC for both time and temperature in the 3D plot demonstrate the importance of both parameters in determining the best production of velvet seed oil.
• Physiochemical Properties of velvet seed
The following were results obtained for the analysis of velvet oil, biodiesel and diesel from fuel station in Table 6.
Table 6
Physiochemical Properties of velvet seed oil and its biodiesel
| Test | Velvet Oil | Biodiesel from velvet oil |
|---|
| Iodine Value(g/100g) | 87.90 | 85.11 |
| Saponification(mg/g) | 42.30 | 39.06 |
| Acid Value (mg KOH/g) | 4.18 | 3.45 |
| Specific gravity | 0.876 | 0.856 |
| Viscosity (cp) | 3.31 | 2.71 |
| pH | 6.75 | 6.62 |
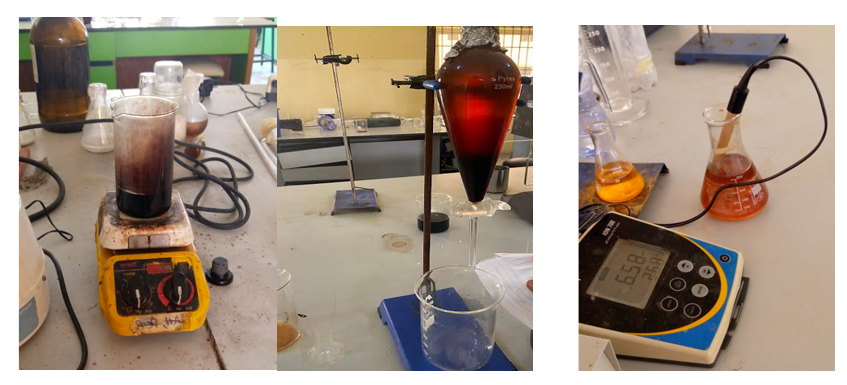
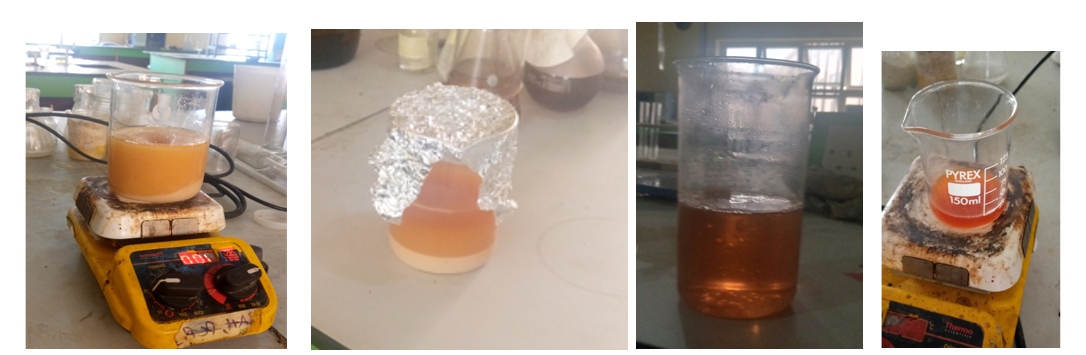
• Surface Tensiometer on Methyl Ether Sulphate from velvet seed oil surfactant
The capability of MES to decrease surface tension were measured by surface tensiometer, the result showed in Table 7. The lowest surface tension of water obtained at addition MES with pH 7 was 32.1 mN/m. it showed that MES can lower surface tension so it can be used for detergent formulation.
Table 7
The result obtained using Surface Tensiometer
| pH | Surface tension mN/m |
|---|
| 5 | 36.78 |
| 7 | 32.10 |
| 8 | 34.16 |
• Result on the FTIR of oil
The FTIR analysis was carried out to find out how the functional groups of the uncarbonized and carbonized samples had changed. Before analysis, sample tablets were made by combining each sample with potassium bromide (1:100 sample to KBr).Using an FT-IR spectrometer (Infrared spectrometer Varian 660 MidIR Dual MCT/DTGS Bundle with ATR) with a detector at a resolution of 4 cm− 1 and 200 scans per sample, the spectra were captured in the frequency range of 4000 cm− 1 to 500 cm− 1.The table below shows the refractogram between wave number and absorption that was produced by FT-IR spectroscopy. Software called IR solution is used to obtain the spectrum. The transmittance vs wavelength in FITR spectroscopy provides the data. Zero transmittance denotes complete radiation absorption, while 100 percent transmittance denotes complete radiation absorption by the sample relative to the reference. Because each molecule's produced graph is distinct, it can be utilized to pinpoint the functional groups.
The FTIR for velvet oil shown in Fig. 5 above shows stability at a transmittance of 84%, a steep decline to 58.26% peak transmittance indicating 3099.53 cm− 1 C = C-H stretching vibrations within aliphatic and aromatic compounds, and an increase from 58.26% transmittance to 64.39% at 3025.11 cm− 1 wavelength. With peak values of 85.09% and 72.33%, respectively, the stability in transmittance extends to additional functional groups found in velvet oil, such as aliphatic C-H in plane stretching and methylene bending vibration. Table 8 provides a summary of the peak values.
Table 8
Showing the Peak wavelength of Velvet oil and the functional group
| Run # | Peak Wavelength(cm− 1) | Transmittance (%) | Assignment |
|---|
| 1 | 3198.74 | 84.71 | O–H stretching vibration of intermolecular hydrogen bonding due to the hydroxyl functional group. |
| 2 | 3099.53 | 58.26 | C = C-H stretching vibrations within aliphatic and aromatic compounds |
| 3 | 3025.11 | 64.39 | Aliphatic C-H stretching vibration. |
| 4 | 1950.31 | 58.11 | C-O stretching vibration due to either ester groups. |
| 5 | 1553.92 | 72.54 | C–C stretching vibration |
| 6 | 1549.52 | 72.31 | Aliphatic C-H in of plane stretching (for CH2 and CH3) |
| 7 | 1349.28 | 72.33 | Aliphatic C-H in of plane stretching (for CH2 and CH3) |
| 8 | 1264.00 | 63.55 | C–O–C symmetric stretching vibrations |
| 9 | 953.82 | 85.09 | Methylene bending vibration |
| 10 | 800.55 | 76.27 | Aliphatic C-H out of plane bending (for CH2 > 4) |
• GCMS result of the velvet oil seed
The result analyzed by GCMS diluted in n-hexane revealed the presence of several difference peaks from velvet oil (see figure.6 and Table 9). Some of those peaks were performed by spectrum analysis revealed the fragments correspond to FFA compounds at retention time are 8.21s ,10.15s ,14.92s ,15.41s ,19.00s ,19.25s ,20.00s, 22.75s ,23.18s ,24.11s,28.00s and 29.00s Respectively. The peak area of Oleic acid at 7.67% is higher than n-Hexadecenoic acid at 6.85%, Palmitoleic acid, 3.29% correspond to 9,12,15-Octadecatrienoic acid, 6.58%. Palmitic acid levels in velvet seeds are on a lower level in reference Oleic (C18H34O2) which are the dominant unsaturated acids, making up to 8.95 wt composition of the total fatty acids.
Table 9
The compound present in the velvet seed oil.
| S/n | Compound | Mw % | Peak Area % | Comp %w |
|---|
| 1 | Octanoic acid | C8H16O2 | 4.38 | 5.00 |
| 2 | n-Decanoic acid | C10H20O2 | 6.03 | 3.92 |
| 3 | Octadecanoic acid | C18H36O2 | 4.66 | 3.10 |
| 4 | 9,12,15-Octadecatrienoic acid, (Z,Z,Z)- | C18H30O2 | 6.58 | 7.38 |
| 5 | Dodecanoic acid | C12H24O2 | 16.44 | 20.18 |
| 6 | Tetradecanoic acid | C14H28O2 | 9.86 | 10.42 |
| 7 | Palmitoleic acid | C16H30O2 | 3.29 | 2.29 |
| 8 | Internal standard(ISTD) | ISTD | 26.30 | 24.26 |
| 9 | n-Hexadecanoic acid | C16H32O2 | 6.85 | 8.39 |
| 10 | 9,12-Octadecadienoic acid (Z,Z)- | C18H32O2 | 6.30 | 4.35 |
| 11 | Oleic Acid | C18H34O2 | 7.67 | 8.95 |
| 12 | 9-Octadecenoic acid, (E)- | C18H34O2 | 1.64 | 0.98 |