Establishment and grouping of MI mice
The MI mouse model was established in accordance with a previous study [18] and specific methods were illustrated as follows. Healthy adult C57BL/6 mice of the same age were purchased from Beijing Beike Huaxia Biomedical Technology Co., Ltd. [SYXK (Beijing) 2017-0044, Beijing, China]. They were raised under the condition of temperature at 20–25°C with day and night cycle and water and food were taken freely. Mice were allowed 72 h to accommodate to the environment before the experiment. Then, mice were anesthetized using pentobarbital sodium (i.p., 60 mg/kg), and then mouse limbs were attached to the electrocardiographic (ECG) monitoring electrode (BeneHearth R3; Mindray, Wuhan, Hubei, China). Subsequently, mice were orally attached to the small-animal ventilators (R407, Rayto Life Science, Shenzhen, China) with indoor air as the source, the breathing frequency of 60 times/min, and the tidal volume of 13–15 mL/kg. A skin incision was made in the fourth left intercostal space to expose the heart and ligated using 6/0 atraumatic suture through anterior descending coronary artery. Obvious elevation of ST-segment was revealed by the ECG monitoring, which meant the success of vascular occlusion. After 60 min of occlusion, the arterial coronary was reopened by releasing the suture. The ECG monitoring revealed that the ST-segment was recovered, indicating the successful establishment of mouse models of MI. The same operation was conducted to the sham group, but the sutures were crossed through under left anterior descending (LAD) without ligation.
The modeled mice were assigned into 6 groups with 24 in each group: sham group, MI group (MI operation group), MI + antago-NC group (mice were injected with antago-NC after MI operation), MI + antago-miR-17-5p group (mice were injected with antago-miR-17-5p after MI operation), MI + S31-201 (mice were injected with S31-201 after MI operation), MI + S31-201 + antago-miR-17-5p group (mice were injected with antago-miR-17-5p on the 1st day after MI operation and STAT3 inhibitor S31-201 on the 7th day after MI operation). The 6 mice in each group were used for TUNEL and for Masson staining, 6 mice for Western blot analysis, 6 mice for 2,3,5-Triphenyltetrazolium chloride (TTC) staining and 6 mice for cerebral edema. The antago-NC and antago-miR-17-5p were purchased from Syngen (Beijing, China) and S31-201 (a STAT3 inhibitor) was from Calbiochem, La Jolla, CA, USA [19]. The 25 µL antagomiRNA was injected into myocardial tissue around the ligation site of the heart at 3 points. The first injection was performed on the 1st day to eliminate the protective effects to acute MI. Then intravenous injection was performed every 3 days until the 28th day after MI operation. On the 28th day after operation, the mice were euthanized using intravenous or intraperitoneal injection of 3 times the amount of anesthetic barbiturates after ECG monitoring.
Transthoracic echocardiography (TTE)
On the 28th day after the operation, mice in each group were anesthetized by an intraperitoneal injection of pentobarbital sodium (60 mg/kg) and were checked by TTE using Color Doppler-type ultrasonic diagnostic apparatus (Sequoia 512; Acuson, Mountain View, CA, USA) at 8.5 m/Hz and 100 mm/s. The anesthetized mice were fixed on the testing platform. The fractional shortening (FS) of short axis, left ventricular internal dimention in systole (LVIDs), and ventricular diastolic filling velocity (E-wave velocity: A-wave velocity, E/A ratio) were continuously measured and averaged. The cardiac function of mice and its correlation with the above indexes were analyzed.
TTC staining
TTC staining method was as previously mentioned [18]. Following TTE, the hearts were taken out from the mice and frozen for half an h at -80°C, and then the transverse section across the left ventricular long axis from the apex to the bottom was obtained using a vibrating blade. The section was added with 1% TTC for staining after weighing on the electronic balance. The infarcted myocardium was gray and the viable myocardium was brick red. These two types of myocardium were separated and then each was weighed on the electronic balance after drying the dye liquor with filter paper. The myocardial infarction size = weight of infarcted myocardium/total weight of left ventricular myocardium × 100%.
Transmission electron microscope (TEM)
Specimens were prepared according to the conventional specimen preparation technology of TEM.
The myocardial tissues at the location needed by the experiment were cut and trimmed to 1 mm
3 pieces and then fixed in 4% paraformaldehyde solution at 4°C. After being fully washed by 0.1 mol/L phosphate buffered saline (PBS), the sections were fixed at 1% osmium tetroxide for 2 h, followed by conventional dehydration by gradient ethanol or acetone, and soaking and embedding in ethoxyline resin. Ultrathin sections were prepared and stained using uranyl acetate and lead citrate, and observed and photographed under the scanning electron microscope.
Masson staining
After cardiac perfusion, the specimens were fixed with 10% buffered formalin, cut into pieces at 5 mm, stained using Weigert iron hematoxylin, and washed in running water. The sections were then acidized by acidic ethanol for a few seconds, washed for several minutes and stained with blue dye solution for a few seconds. Then the sections were washed for several minutes, and stained with Ponceau fuchsin staining solution for several minutes. Acetic acid working solution was prepared with distilled water and acetic acid solution in certain proportion and then used to wash the section. After phosphomolybdic acid treatment, the sections were counterstained with aniline blue dye solution, and washed by acetic acid working solution until no blue color. Then the sections were dehydrated with ethanol immediately and mounted with neutral resins.
Reverse transcription-quantitative polymerase chain reaction (RT-qPCR)
RT-qPCR was performed as mentioned in the reference [18].The TRIzol one-step method was employed to extract total RNA of myocardial tissues based on the instructions of TRIzol reagent (Invitrogen Inc., Carlsbad, CA). RNA was dissolved in ultrapure water treated by diethyl pyrocarbonate. Absorbances at the wavelengths of 260 nm and 280 nm were detected using ultraviolet-visible spectrophotometer (ND-1000, NanoDrop Technologies, Wilmington, DE, USA). The quality of total RNA was confirmed and total RNA concentration was adjusted. The experiment conditions were: constant temperature at 70°C for 10 min, ice-bath for 2 min, constant temperature at 42°C for 60 min, and at 70°C for 10 min. The complementary DNA obtained from reverse transcription was stored at -80°C temporarily. The reaction system was operated by TaqMan probe method in line with the kit (Fermentas Inc., Vilnius, Lithuania) instructions on ABI 7500 instrument (ABI, Foster City, CA, USA) with U6 as the internal control. The expression was determined with 2−ΔΔCT method. The primer sequences are illustrated in Table 1.
Table 1
Name of primer | Sequences |
|---|
miR-17-5p forward | 5'-TCTAGATCCCGAGGACTG-3' |
miR-17-5p reverse | 5'-ATCGTGACCTGAACC-3' |
U6 forward | 5’-CTCGCTTCGGCAGCACA-3′ |
U6 reverse | 5’-AACGCTTCACGAATTTGCGT-3′ |
Western blot
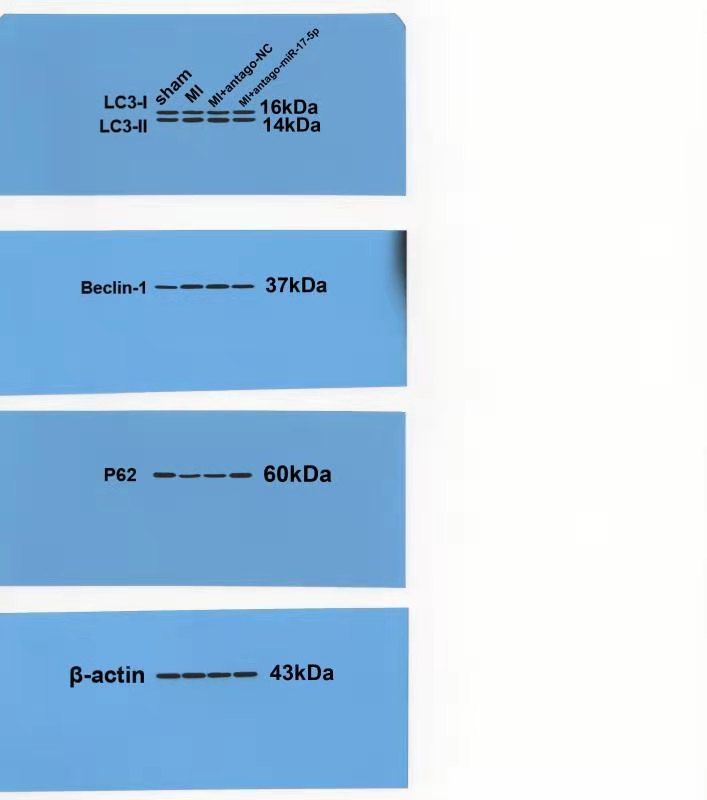
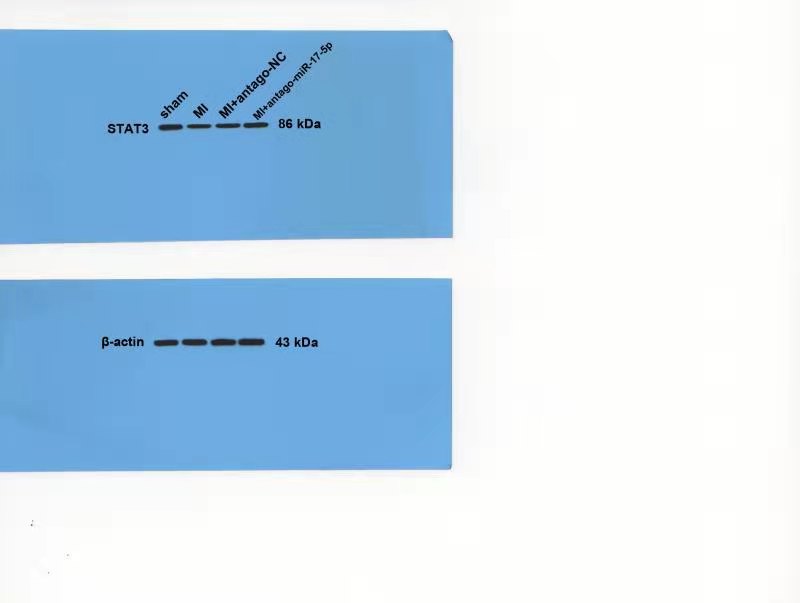
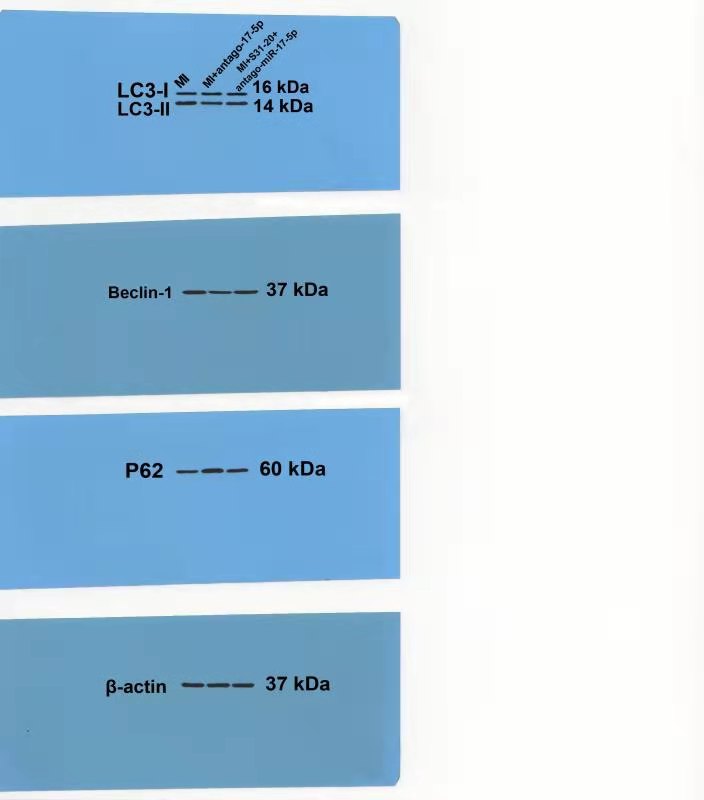
RIPA lysate was used and heart tissues were centrifuged for 20 min at 8000 x g. Protein concentration in supernatant was determined using a Bradford kit (Pierce Biotechnology, Rockford, IL, USA). Protein samples (30 µg) were segregated with 10% sodium dodecyl sulfate-polyacrylamide gel electrophoresis and transferred onto cellulose nitrate membranes (Bio-Rad Laboratories, Hercules, CA, USA). The membranes were blocked using 5% (w/v) nonfat dry milk and 0.1% (w/v) Tween 20 (TBST) for 2 h, and then the membranes were incubated with light chain 3 (LC3, sc-292,354, 1:1,000), p62 (sc-48389, 1:1,000), β-actin (sc-81178, 1:2,000), Beclin-1 (ab207612, 1:1,000), STAT3 (sc-483, 1:1,000) at 4°C overnight. The membranes were washed in TBST 3 times and incubated with the secondary antibody donkey anti-rabbit IgG (sc-2096, 1:10) and goat anti-rabbit IgG (sc-2004, 1:10) at room temperature for 2 h. Enhanced chemiluminescence was used to expose protein band and relative protein was determined by ImageJ software (the National Institutes of Health, Bethesda, MD, USA). All antibodies were purchased from Santa Cruz Biotechnology Inc. (Dallas, TX, USA).
Dual-luciferase reporter assay
Luciferase plasmid was constructed as follows: the wild-type (wt) sequence containing the target gene STAT3-3’-UTR fragment was constructed and was complementary to corresponding miR-17-5p. Then, the wt sequence fragment of STAT3 3’-UTR-wt containing predicted binding site of miR-17-5p and the mutant (mut) sequence fragment of STAT3 3’-UTR-mut were cloned to pGL3-basic vector. The 293T cells (Chinese Academy of Sciences, GNHu17, Shanghai, China) were evenly seeded in 6-well culture plate at the concentration of 3×10⁵/mL, 1 mL for each well. Subsequently, the 293T cells were co-transferred with luciferase plasmid containing STAT3 3’-UTR-wt or STAT3 3’-UTR-mut and miR-17-5p mimic or mimic control. A normal control group was set. Cells were harvested 48 h post-transfection and measured with luciferase reporter assay kit. The absorbance at the wavelength of 560 mm was detected by a microplate reader.
TUNEL
DeadEndTM luciferase TUNEL system (Promega, Madison, WI, USA) was applied to detect cardiomyocyte apoptosis. The fixed heat tissue slices were permeabilized in PBS containing 0.2% Triton X-100 for 5 min, and cut and equilibrated for 10 min at room temperature, and then incubated with terminal deoxynucleotidyl transferase (TDT) reaction mixture for 60 min in a humidified chamber at 37°C. Finally, the nuclei were labeled by Hoechst 33258 (Invitrogen). Apoptotic cells were observed under a fluorescence microscopy. Green florescence was observed in the apoptotic cells with blue nuclei. At least 6 visual fields were randomly selected to calculate the percentage of apoptosis.
Statistical analysis
Statistical analyses were performed using SPSS 21.0 (IBM Corp. Armonk, NY, USA). Kolmogorov-Smirnov was used to analyze data were in normal distribution. Data are expressed as the mean ± standard deviation (SD). Comparisons between 2 groups were performed using t-test and comparisons between multiple groups were performed using one-way analysis of variance (ANOVA) or two-way ANOVA, followed by Tukey's multiple comparisons test. P value was obtained using a two-sided test. P < 0.05 was considered a statistically significant difference.