Reagents
3-(4,5-dimethylthiazol-2-yl)-2,5-diphenyltetrazolium bromide (MTT), Fetal bovine serum (FBS), Dimethyl sulfoxide (DMSO) (culture grade), Dulbecco’s Modified Eagle Medium (DMEM) and Phosphate buffered saline (PBS) were purchased from Himedia Laboratories, India. Further, Eugenol (EUG) and Beta-caryophyllene (BCP) were acquired from Sigma-Aldrich, India. 5-flouorouracil (5-FU) was purchased from local pharmaceuticals of CELON LABS brand (IP 500 mg/10 mL).
Cell culture and maintenance
Human Colorectal Carcinoma cell line, HCT116, was obtained from National Centre for Cell Science (NCCS), Pune, Maharashtra, India. Cells were cultured in DMEM medium supplemented with 10% FBS, 100 mg/mL streptomycin and 100 U/mL penicillin and maintained at 37 °C with 5% CO2. Cells were sub-cultured on attaining ~ 80% confluency for further experiments using 96-well plate or 24-well plates.
MTT (3-(4,5-dimethylthiazol-2-yl)-2, 5-diphenyltetrazolium bromide) assay
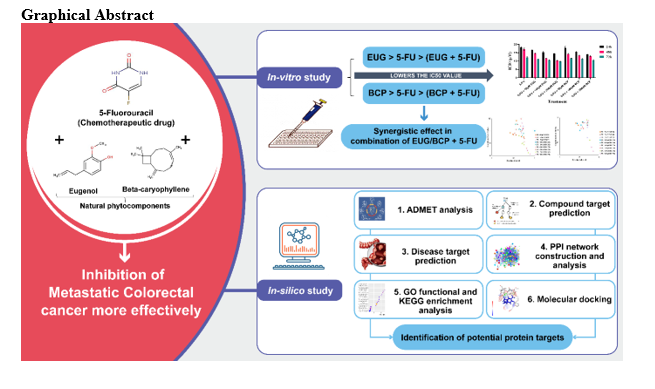
Cytotoxicity was measured using MTT reagent to detect NADH-dependent dehydrogenase activity of the test compounds (Mosmann 1983). Briefly, HCT116 cells were seeded in 96-well plate at the density of 5 × 10³ cells / well, allowed to attach and grow for 24h in complete DMEM medium. Then treated with different concentration of EUG (1 µM to 1000 µM), BCP (1 µM to 1000 µM), and 5-FU (3 µM to 1537.53 µM). For combination study, three concentrations of EUG (50 µM, 100 µM and 200 µM) and BCP (50 µM, 100 µM and 200 µM) were combined with 5-FU (6 µM to 192.19 µM) to check their effect on IC50 value of 5-FU. DMSO was used as vehicle control and maintained 1% in cultures of colorectal cancer cells. After the treatment for 24h, 48h and 72h with test compounds, culture medium was removed, followed by PBS wash (pH 7.0) and 50 µL MTT reagent (5mg/mL in PBS) was added into each well and incubated for 4h at 37 °C in humified (5%) CO2 incubator (Biocenter, Salvis Lab) in dark condition for formazan crystal formation. Afterwards 100 µL DMSO was added to solubilize formazan crystals and further incubated for 30 min. MTT product was quantified as absorbance using microplate reader (Bio-Tek Epoch microplate spectrophotometer, Vermont, USA) at 570 nm. % Cell survival was calculated using the formula, [mean A570 treated cells – mean A570 blank / mean A570 control cells – mean A570 blank]. IC50 value was counted using the GraphPad Prism V8.2.1.
Estimation of Combination Index (CI)
The CI theorem of Chou-Talalay (Chou and Talalay 1984) quantitively determine synergism or antagonism at different effect levels as indicated by Fa-CI plot in CompuSyn simulation and automated graphics which were generated for 5-FU-EUG (FE) and 5-FU-BCP (FB) combinations.
Pharmacokinetic assessment
Pharmacokinetic and pharmacodynamic studies of EUG, BCP and 5-FU such as absorption, distribution, metabolism and excretion (ADME) were carried out for drug-likeness properties and toxicity. Other pharmacologically acceptable properties such as molecular weight, solubility, hydrogen bond acceptor and donor, rotatable bonds etc. were performed using PreADMET (https://preadmet.bmdrc.kr) and SwissADME (www.swissadme.ch). These are online databases to evaluate parameters such as blood brain barrier partition co-efficient- logBB, plasma protein binding (PPB), human intestinal absorption (HIA). This is a computational approach to access if the test compounds follow Lipinski rule of five which is necessary to design any drug (Lipinski et al. 1997). SDF (Structure Data File) and SMILES (simplified molecular input line entry system) strings were employed throughout the process. The results were analysed and compared for each test compound and drug.
Compound targets prediction
PubChem (https://pubchem.ncbi.nlm.nih.gov/) is a public repository for information of chemical substances and their biological activities. 3D structure of EUG, BCP and 5-FU were downloaded in SDF (Structure Data File) format which were deposited to find Potential targets for all three compounds into PharmMapper (http://www.lilab-ecust.cn/pharmmapper/), ChEMBL (https://www.ebi.ac.uk/chembl/) and Search Tool for Interacting Chemicals (STITCH) version 5.0 (http://stitch.embl.de/) database. PharmMapper is a web-based server to identify potential targets for molecules by submitting job of query compound into it with selection of human targets and druggable pharmacophore models options in it. ChEMBL is hosted by The European Bioinformatics Institute (EMBL-EBI) for molecular data resource to develop data analysis pipelines effectively. The STITCH pipeline aggregates high throughput experiments data, manually curated datasets, and the results of several prediction methods into a single global network of protein–protein and protein–chemical interactions (Szklarczyk et al. 2016). Protein-compound interactions were analysed at 0.900 (Highest) confidence level for Homo sapience species only. We combined all the protein targets to make a common list of targets for each compound.
Acquisition of disease- associated target genes
DisGeNET (https://www.disgenet.org/) and Pathcards (https://pathcards.genecards.org/) were used to identify proteins associated with metastatic Colorectal cancer (Disease ID: C0009402). DisGeNET is a discovery platform containing one of the largest publicly available collections of genes and variants associated to human diseases (Piñero et al. 2021), in which genes ≥ 0.1 score-gda (Gene Disease Association) were selected for further study. Pathcards is a pathway unification integrated database of human biological pathways and their annotations, gives genes associated with pathways related to the disease. We clubbed together both the lists of genes to make a common list of proteins involved in metastatic CRC.
Protein- Protein interaction (PPI) network formation
PPI networks provide valuable framework of the proteins for understanding functional proteome in much better ways. That was done using String (https://string-db.org/, ver 11.5), with organism limited to Homo sapience only. PPI with highest confidence scores (> 0.9) were reserved for this study.
Compound-Disease-Target (C-D-T) network construction and analysis
Network constructed using Cytoscape 3.9.1 software. PPI networks of EUG, BCP, 5-FU were merged with metastatic CRC network using the “Merge” tool of Cytoscape (intersection and union options were selected) to construct the C-D-T network. This software is perfectly suitable for visualizing networks of intermolecular interactions, biological pathways, and many more. Besides, it provides a powerful set of data integration, analysis, and visualization functions to analyse complicated networks (Liu et al. 2018). In the networks, the node represents different genes associated with CRC targeted by compounds and the “edge” is a connection between the nodes. We removed duplicated edges and self-loops to present final network. For each network, node degree was assessed using Network Analyzer version 4.4.6 plugin (Assenov et al. 2008). The Tanimoto coefficient was calculated for comparing the similarity between 5-FU and test substances using the ChemMine tool (https://chemminetools. ucr.edu/). The value of the Tanimoto coefficient falls between 0 to 1 and its higher values indicate greater resemblance in comparison to lower ones.
Enrichment analysis for key targets
DAVID (The Database for Annotation, Visualization, and Integration Discovery) version 8.0.0 publicly available high-throughput functional annotation tools (Huang et al. 2007). It was used for GO (Gene Ontology) and KEGG (Kyoto Encyclopaedia of Genes and Genomes) pathway enrichment analysis of EUG, BCP and 5-FU involved in metastatic CRC to explore their functional role in human body like BP: Biological Processes, CC: Cellular Compounds, MF: Molecular Functions as well as different cell signalling pathways connected to them. The dotplot was constructed using targets of EUG, BCP and 5-FU intersected network with CRC using ShinyGO version 0.76 (http://bioinformatics.sdstate.edu/go/), a graphical gene-enrichment tool to visualize overlapping relationships among enriched gene-sets. It also identifies statistically significant differences in gene type, length, GC content and chromosomal distribution between query genes (Ge et al. 2020). Enrichment analysis of charts were done with False Discovery Rate (FDR) cut off 0.05, fold enrichment on X-axis and pathways on the Y-axis based on no. of genes involved in the pathways.
Extracting core targets of network
By the aid of Microsoft Excel, we intersected potential target database related to compounds and target database to get the core target related to CRC, which was used to draw a Venn diagram online (http://www.bioinformatics. com.cn/). Protein targets from intersected network as well as top 16 proteins from merged network of all three compounds with CRC, were taken for further validation using molecular docking.
Molecular docking
Molecular docking which was performed using Glide version 11.8 (Halgren et al. 2004). High resolution protein crystalline structures were obtained by the X-ray diffraction method and presented resolutions smaller than 2.8 Å (Table 8) and were downloaded from Research Collaboratory for Structural Bioinformatics protein databank (https://www.rcsb.org/) and prepared using protein preparation wizard tool (Schrödinger, LLC). Water and hetero molecules were removed, and hydrogen atoms were added to the protein structure, optimized, and minimized with inducing potential ionization at pH 7.0 ± 2.0. Restrained minimization was set default at 0.30 Å coverage heavy atoms to RMSD value. Receptor grid was generated at the active pocket site of the protein which was the native ligand called as inhibitor or positive control. Ligand structures for EUG, BCP, 5-FU and for all positive controls were downloaded from PubChem in SDF format, prepared with Ligprep tool (Schrödinger, LLC). Molecular docking was performed at the extra precision (XP) mode for all tested compounds. The final evaluation of ligand-protein binding was performed based on glide score (Kcal/mol). Discovery Studio programs was also used for visual inspection and graphical representations of the docking results.
Statistical analysis
The results were expressed as Mean ± SD analysed with two-way analysis of variance (ANOVA) for IC50 values using GraphPad Prism 8.2.1. P < 0.05 was considered to be significantly different. Dunnett’s multiple comparison test was performed to compare the IC50 value of combination group with 5-Fluorouracil alone group to test the reduction in inhibitory effect.


